Elliottwave-Forecast

Master Trader
Feb 17, 2017
2,453
9
84
www.elliottwave-forecast.com
The Sensex Index Long Term Elliott Wave & Bullish Cycles

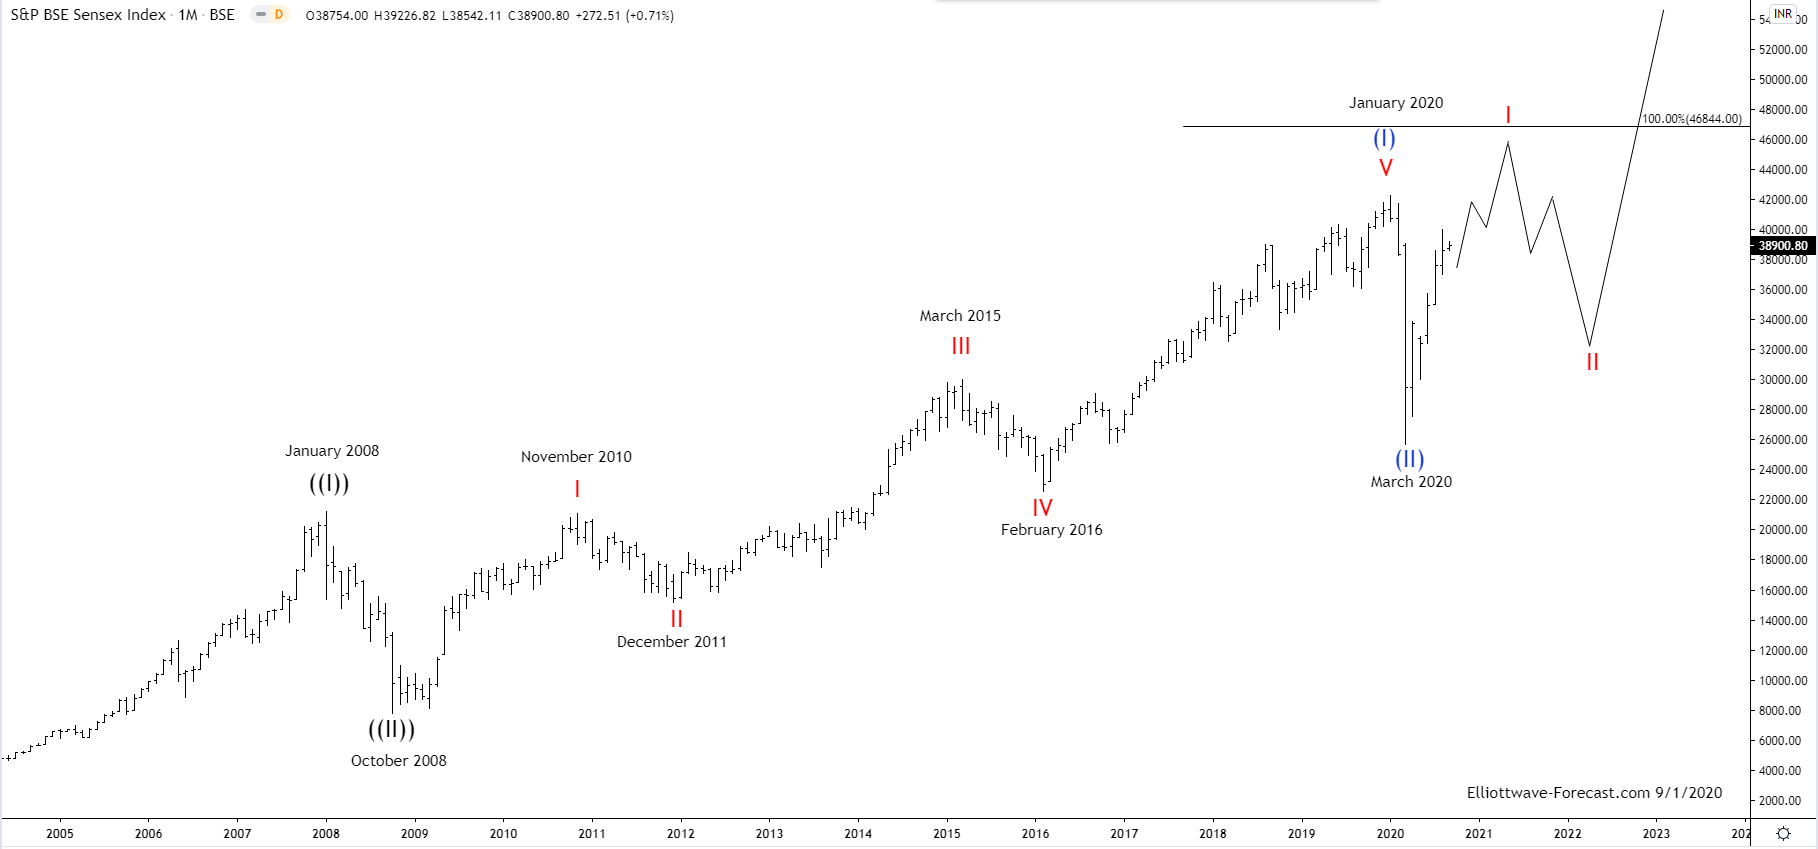
The Sensex Index has been trending higher with other world indices. Firstly in it’s base year 1978 to 1979 the index’s point value was set at 100. From there it rallied with other world indices trending higher into the January 2008 highs. It then corrected the bullish cycle as did most other world indices. It ended that larger degree correction in October 2008. From those 2008 lows, the index shows a bullish sequence that favors further upside. I will describe a less bullish alternative Elliott Wave count that has a target extension shown on the chart at 46844. This is where a larger black ((I)) could be ending. However it is not the favored view which is shown below and is more bullish.

Secondly, this Fibonacci extension is measured is as follows. Use a Fibonacci extension tool on a charting platform. Point 1 will be at zero a hypothetical beginning. Point 2 is at the January 2008 cycle high. From there on up to the March 2020 lows will be the point 3. This gives a Fibonacci extension area fifth wave target where the fifth wave would be equal to the wave one. That is not the favored count where a larger ((I)) would end but it would be a valid count. The preferred analysis continues below the chart.

Sensex Index Monthly Chart


The currently favored view in the Sensex index is as shown. It's showing a nested Elliott Wave bullish cycle. It is in a larger wave ((III)) higher. From the 2008 lows there is a clear five waves up into the January 2020 highs as subdivided on the chart. The pullback in wave (II) into the March 2020 lows was very fast in time. However it is deep enough it will suffice as all of the preferred view correction. Thus at this point the index is favored to remain above there during dips. This is in either the preferred view or the previously described alternative where the larger ((I)) would be ending near 46844.

In conclusion. Either way while price is above the March 2020 lows the index should trade higher.

Thanks for looking. Feel free to come visit our website. Please check out our services Free for 14 days to see if we can be of help. Kind regards & good luck trading. Lewis Jones of the ElliottWave-Forecast.com Team
 

Elliottwave-Forecast

Master Trader
Feb 17, 2017
2,453
9
84
www.elliottwave-forecast.com
One of the best performing assets this year is Silver. After bottoming on March 18 at $11.6 in the Covid-19 selloff, the metal has rallied to $30. Silver miners should benefit from the higher price of silver. As long as the price of Silver can stabilize at this upper twenty range or extend higher, we could see silver miners stocks to continue the out performance.

One of the convenient ways to invest in the Silver mining companies is through Global X Silver Miners ETF (SIL). This ETF can provide investors efficient access and effective diversification to a basket of silver mining companies. The mining companies provide a leveraged exposure to the underlying physical metal. So if silver is up, the miners tend to be up more.

SIL however also carries a lot more volatility that the underlying silver. In several weeks in March, SIL plummeted more than 40% as Silver crashed due to the Covid-19. The ETF collapsed 27% in the final trading days alone. Silver then made a V-shape bounce since then and rallied 158% while SIL more than tripled from $16 to $52.9 for 230% rally. The leverage is still quite weak at only 1.45x.

Q2 has proved to be very challenging for many primary mining companies due to the coronavirus-driven shutdown. Mexico, the largest silver producing country, suspend mining activities for 60 days in the second quarter. However, mines have now operated again after the government deems the mining industry as essential and critical.

As long as the operational challenge is solved and silver price can maintain the new higher base or go even higher, Silver Miners have a chance to extend higher.

SIL Monthly Elliott Wave Chart
Silver Miners ($SIL) Monthly Elliott Wave Chart

Silver Miners ETF (SIL) Monthly Chart above shows that the rally to $94.03 on April 2011 ended wave ((I)). The correction in wave ((II)) ended at $14.94 on January 2016. From there, SIL is forming a base for the next move higher. Wave ((III)) is now in progress which should continue in the next few years. Up from wave ((II)), wave I ended at 54.34 and wave II pullback ended at $16 during the Covid-19 selloff. Dips from this point should continue to be supported in the sequence of 3, 7, or 11 swing for more upside.
 

Elliottwave-Forecast

Master Trader
Feb 17, 2017
2,453
9
84
www.elliottwave-forecast.com
In this blog, we are going to take a look at the Elliott Wave chart of GBPJPY. The pair is showing a bullish sequence from March 18 low. Therefore, the dips in 3,7, or 11 swings are expected to continue to be supported for more upside. The 1 hour chart update from August 21 shows that the pair has ended the cycle from June 21 low as wave A at 140.20 high. The sub-waves of the rally unfolded as 5 waves impulsive structure. Elliott Wave theory dictates that 3 waves pullback should happen afterwards before the rally continues.

Pair then did a pullback in wave B, which unfolded as a double three correction. Down from wave A high, wave ((w)) ended at 138.57 low. The bounce in wave ((x)) ended at 139.95 high. The pair then declined lower in wave ((y)). The pullback reached the 100-161.8% extension of wave ((w))-((x)) at 137.31-138.32. That area is highlighted with a blue box. As long as 161.8% extension stays intact, expect pair to see 3 waves bounce at least or resume the rally higher from blue box.

GBPJPY 8.21.2020 1 Hour NY Elliott Wave Chart
GBPJPY 8.21.2020 NY

The 1 hour chart update from August 26 shows that pair ended wave ((y)) at 138.22 low, which is within the blue box area. This also ended wave B in higher degree. From there, the pair has extended higher. The rally from blue box ended as wave ((i)) at 140.03 high. Wave ((ii)) pullback could unfold before pair resumed higher again. As long as the pullback stays above 138.22 low, the dip in 3,7, or 11 swings should find support.

GBPJPY 8.26.2020 1 Hour London Elliott Wave Chart
GBPJPY 8.26.20 London

1 hour London chart update from September 2 shows adjusted count for GBPJPY. Now, wave ((i)) is proposed ended at 141.61 high and wave ((ii)) pullback ended at 139.99 low. From there, pair has resumed higher in wave (i) of ((iii)), which ended at 142.71 high. Wave (ii) dip ended at 141.30 low. The rally higher has broken the previous wave A high, confirming that the next leg higher is already in progress. As long as the low at 139.99 stays intact, expect dips in 3,7, or 11 swings to continue to find support for more upside.

GBPJPY 9.2.2020 1 Hour London Elliott Wave Chart
GBPJPY 9.2.20 London
 

Elliottwave-Forecast

Master Trader
Feb 17, 2017
2,453
9
84
www.elliottwave-forecast.com
Archer-Daniels-Midland company, commonly known as ADM, is a multinational food processing and commodities trading corporation. Founded 1902, headquartered in Chicago and traded under the ticker $ADM at NYSE, it is a component of the S&P500 index. First of all, ADM is engaged in corn and oilseeds processing. In general, the products are oils and meals from soybeans, wheat flour, cocoa, sunflower seeds, canola, flaxseeds, peanuts and many others. As a matter of fact, it operates more than 270 plants and 420 crop procurement facilities worldwide. Currently, we can see that the wheat prices are turning up. Also, other grains and soft commodities may be turning higher after years of a heavy devaluation. Therefore, an investment in shares of an agriguctural company can provide an exposure to the rising prices in this segment. Hereby, ADM as a market leader should become an excellent investment candidate.

ADM Monthly Elliott Wave Analysis 09.03.2020
The monthly chart below shows the ADM shares $ADM traded at New York Stock Exchange. From the all-time lows, the stock price has developed a cycle higher in wave (I). Hereby, ADM has printed the all-time highs in December 2014 at 53.91. Within the impulsive advance in wave (I), all the internals I, III and V are impulsive waves, too. While the wave II is a straightdown correction, the wave IV can be seen as a contracting triangle pattern. From the 2014 highs, a correction lower in wave (II) has unfolded as a double three correction being a 3-3-3 structure. It has found its bottom in March 2020 at 28.92.

From the March lows, a new cycle in wave (III) may have started to the new highs. Break of 53.91 would confirm that. As right now, the price is turning higher in a black wave ((1)). Once finished, pullback in wave ((2)) should find support in 3, 7, 11 swings above 28.92 lows for another extension higher in wave ((3)).

ADM Elliott Wave Monthly

ADM Daily Elliott Wave Analysis 09.03.2020
The Daily chart below shows the $ADM shares price action in more detail. From the March lows at 28.92, the stock price has advanced in blue waves (1) and (2) of the black wave ((1)). Currently, from the May lows at 33.02, the wave (3) of ((1)) is unfolding higher. Right now, the ADM stock is pushing to new highs in red wave 3 of blue wave (3). Expect the prices to see more upside. Later on, two new highs in red wave 5 of (3) and blue wave (5) should happen. Once the march cycle in wave ((1)) has finished, expect a pullback in wave ((2)) to find support in 3, 7 or 11 swings above 28.92 lows for a possible acceleration in wave ((3)).

As an outlook, the new cycle in blue wave (III) should bring the prices towards 53.91 highs and above. The target for wave (III) will be 82.77-116.08. At current price levels, investors in agriculture related markets have a good opportunity to enter the market with a great potential to the upside.

ADM Elliott Wave Daily
 

Elliottwave-Forecast

Master Trader
Feb 17, 2017
2,453
9
84
www.elliottwave-forecast.com
Hello fellow traders. DAX is one of the instruments that has been giving us a lot of good trades recently. In this technical blog we’re going to take a quick look at the Elliott Wave charts of DAX, published in members area of the website. As our members know, we’ve been calling rally in DAX within the cycle from the March low. In the further text we are going to explain the Elliott Wave Forecast and trading setups.

DAX 1 Hour Elliott Wave Analysis 08.27.2020
DAX is bullish against the 12633.7 low. Current view suggests DAX still can be doing double in wave ((ii)) pull back against the 12633.7 low. As far as the price holds below current short term highs, we expect to see another leg down toward 13006.8-12878.1 area ( blue box- buyers zone) . We don't recommend selling it and favor the long side from the blue box. As our members know, Blue Boxes are no enemy areas , giving us 85% chance to get a bounce. Consequently, we expect to see at least 3 waves bounce from the blue box. As soon as the price reaches 50 fibs against the (x) high, we should make long positions risk free. ( put SL at BE).


DAX 1 Hour Elliott Wave Analysis 09.01.2020
We got double toward blue box - buying zone as expected. DAX found buyers there and gave us nice bounce. Rally from blue box was strong enough and broke above 50 fibs against the previous short term high, so we made our long positions risk free. Eventually DAX made strong decline and closed our long positions. As we put Stop Loss at the entry levels, trades are closed without any loss. Current structure is showing 7 swings from the peak, when next set of equal legs is reached at 12876.2-12706.7 ( buying zone). Consequently we like to be buyers there for proposed extension up or 3 waves bounce at least. Strategy is the same, as soon as the price reaches 50 fibs against the middle pivot, we will make long position risk free.

DAX

DAX 1 Hour Elliott Wave Analysis 09.04.2020
DAX found buyers at the blue box area 12876.2-12706.7 and as a result we got nice profits there. Current view suggests DAX is correcting the cycle from the 12633.3 low, and still can find buyers against that low for further extension up.

Keep in mind market is dynamic and presented view could have changed in the mean time. You can check most recent charts in the membership area of the site. Best instruments to trade are those having incomplete bullish or bearish swings sequences.We put them in Sequence Report and best among them are shown in the Live Trading Room.

DAX

Elliott Wave Forecast
 

Elliottwave-Forecast

Master Trader
Feb 17, 2017
2,453
9
84
www.elliottwave-forecast.com
Technology is the strongest sector in the current bullish trend in World Indices. Nasdaq (NQ) which has a lot of technology stocks naturally is one of the best performing Indices. We had some pullback in the Indices last week. As always, with every pullback, many traders and analysts start to speculate if major top is in place.

We will look at the chart of Nasdaq to answer this question. We start with the idea that Nasdaq is in an impulsive structure from all-time low. That should be very clear as the Index makes new all-time high and continues to make higher high. For an impulsive structure to end, we need to be able to count a clear 5 waves. In addition, we should see the fifth wave losing momentum and thus we need to be able to observe a momentum divergence.

Let's now look at the Daily Chart of Nasdaq below and focus especially on the rally from March 2020 low.

Nasdaq Daily Elliott Wave Chart: Path 1
Nasdaq (NQ) daily Elliott Wave chart path 1

In the daily chart above, we can see the all-time high in Nasdaq came without any momentum divergence. The RSI (Relative Strength Index) shows the strongest momentum peak at the same time when the Index makes all-time high. Thus, we can conclude that the previous all-time high is unlikely to be a wave V from March 23 low. One possibility then is to label the previous all-time high to be wave III. In this scenario, the Index should be in wave IV in 3, 7, or 11 swing before it resumes higher again.

Assuming the placement of wave I and II is correct, potential target for wave IV is 23.6 - 38.2 Fibonacci retracement of wave III which is 10508 - 11249. This is a guideline for where wave IV usually ends, but not a rule. Also as a guideline, it's better for wave IV not to retrace more than 50% of wave III or else it becomes too big and no longer be a wave IV. A 50% retracement of wave III is 9910. Nasdaq last week has already hit 23.6 retracement at 11249. Thus in fact, the Index can start to make new high again from here. However, it can still do a double correction and perhaps reach around 38.2 retracement at 10508 area before ending wave IV and resumes higher again.

Nasdaq Daily Elliott Wave Chart: Path 2


Let's assume for a moment that Nasdaq is doing larger decline. If it drops more than the proposed 50% of wave III at 9910 like the first chart above suggests, it will increase the chance it's no longer a wave IV. In this scenario, Nasdaq perhaps has ended cycle from March 23 low as a corrective structure ABC. The reason is because there's no momentum divergence at the peak and thus the structure of the rally is likely not a 5 waves.

However, since Nasdaq is at all-time high and thus the entire rally from all-time low has to be impulsive, the Index can't possibly end the entire impulsive structure with 3 waves structure. Thus, in case of a bigger pullback, another path can be that Nasdaq rally from 3.23.2020 low is in an ending diagonal structure. In this case, the rally from 3.23 low ended wave (I). We can then see a larger pullback in wave (II) to correct cycle from March low before Index resumes higher again.
 

Elliottwave-Forecast

Master Trader
Feb 17, 2017
2,453
9
84
www.elliottwave-forecast.com
In this blog, we are going to take a look at the Elliott Wave chart of Wheat Futures (ZW_F). The 4 hour chart update from August 13 shows that wheat has ended the cycle from June 27 low as wave (A) at 551.6 high. The sub-waves of the rally unfolded as 5 waves impulsive structure. Up from June 27 low, wave 1 ended at 499.6 high and wave 2 dip ended at 487.6 low. The commodity then resumed higher in wave 3, which ended at 539 high. Wave 4 pullback unfolded as a triangle and ended at 528.2 low. The push higher in wave 5 ended at 551.6 high and also ended wave (A) in the higher degree.

Elliott Wave theory dictates that 3 waves pullback should happen afterwards before the rally continues. Wheat then did a pullback in wave B, which unfolded as a zigzag correction. Down from wave (A) high, wave A ended at 517 low. The bounce in wave B ended at 544 high. The commodity then declined lower in wave C, which ended at 487.6 low. This also ended wave (B) in higher degree. The pullback reached the 100-161.8% extension of wave A-B. That area is highlighted with a blue box. As long as 161.8% extension stays intact, wheat is expected to see 3 waves bounce at least or resume the rally higher from blue box.

ZW_F 8.13.2020 4 Hour Elliott Wave Chart
Wheat 8.13.2020 4H

The 4 hour chart update from September 6 shows that wheat resumed the rally higher from the blue box area. The rally broke above previous wave (A) high, confirming that wave (B) is in place and the next leg higher in wave (C) is already in progress. The commodity can see another high within wave 5 to end the rally in wave (C), while staying above 487.6 low. However, wheat currently has already reached the minimum target to the upside, which is 100% extension of wave 1-2 at 562 level.

ZW_F 9.6.2020 4 Hour Elliott Wave Chart
Wheat 9.6.2020 4H
 

Elliottwave-Forecast

Master Trader
Feb 17, 2017
2,453
9
84
www.elliottwave-forecast.com
In this technical blog, we are going to take a look at the past performance of EURGBP 4-Hour Elliott wave Charts that we presented to our members. In which, the rally from April 2020 low showed an impulse structure with the bullish sequence tag called for more upside to take place. Therefore, our members knew that buying the dips into the direction of the bullish tag remained the preferred path. We will explain the Elliott wave structure & buying opportunity our members took below:

EURGBP 4 Hour Elliott Wave Chart
EURGBP Blue Box Provides Another Buying Opportunity

Above is the 4 Hour Elliott Wave Chart from 8/27/2020 update, in which the pullback to 86.71 low ended wave ((2)). Up from there, the rally higher in wave (1) of ((3)) took place as a 5 wave impulse sequence where wave 1 ended at 0.8814 high. Wave 2 ended at 0.8689 low, wave 3 ended at 0.9054 high, wave 4 ended at 0.8862 low, and wave 5 ended at 0.9175 high.

Down from there, the pair made a pullback in wave (2) to correct the cycle from 4/30/2020 low (0.8671). The internals of that pullback unfolded as a zigzag structure where wave A ended at 0.8936 low. Wave B ended at 0.9148 high and wave C was expected to reach 0.8910- 0.8763 100%-161.8% Fibonacci extension area of A-B. Then from there, the pair was expected to provide buying opportunity to our members into the direction of bullish tag looking for new highs or for minimum 3 wave reaction higher at least.

EURGBP Latest 4 Hour Elliott Wave Chart
EURGBP Blue Box Provides Another Buying Opportunity

Here's the latest 4 hour Elliott Wave Chart from 9/08/2020 update. In which pair managed to reach the blue box at 0.8910- 0.8763 area and rallying higher. Allowed our members to create a risk-free position shortly after taking the long position at the blue box area. However, a break above 0.9175 high still needed to confirm the next extension higher. It’s important to note that with further market data, we re-adjusted the count of the pullback as a double three structure.
 

Elliottwave-Forecast

Master Trader
Feb 17, 2017
2,453
9
84
www.elliottwave-forecast.com
Elliott Wave View of Dow Futures (YM) suggests the Index ended the cycle from June 15 low as wave ((3)) at 29180 high. Afterwards, Index did a pullback in wave ((4)) to correct against that cycle. The correction unfolded as a double three Elliott Wave Structure. Down from wave ((3)) high, wave A ended at 28052 low. The bounce in wave B ended at 28592 high. Index then resumed lower and ended wave C at 27707 low. This completed wave (W) in higher degree.

Afterwards, Index bounced higher in wave (X) to correct against the cycle from September 3 high. The subdivision of the bounce unfolded as zigzag correction, where wave A ended at 28331 high, wave B ended at 27886 low and wave C ended at 28404 high. After that, Index then resumed lower. Down from wave (X) high, wave A ended at 27473 low and wave B ended at 27821 high. Finally, wave C lower ended at 27179 low to end wave (Y) and also wave ((4)) in higher degree. While above 27179 low, dips in 3,7 or 11 swings is expected to continue to find support for more upside. However, Index still needs to break above September 3 high to confirm that next leg higher in wave ((5)) is already in progress.

Dow Futures 1 Hour Elliott Wave Chart
Dow Futures 9.10.2020 Asia
 

Elliottwave-Forecast

Master Trader
Feb 17, 2017
2,453
9
84
www.elliottwave-forecast.com
United Internet AG is a global internet services company. Founded 1988, headquartered in Montabaur, Germany, and traded under the ticker $UTDI at FSE, it is a component of the TecDax index. First of all, United Internet comprises two units, Access and Applications. In particular, it owns the leading internet service providers in Germany as well as major email providers such as GMX, mail.com and web.de. In total, it has 13 brands and numerous subsidiaries. Also, company operates its own internet backbone. This year, as a matter of fact, we saw technology stocks leading the rally in US. Hereby, United Internet as a heavyweight in TecDAX should become an excellent opportunity for technology oriented investors.

United Internet Monthly Elliott Wave Analysis 09.10.2020
The monthly chart below shows the United Internet shares $UTDI traded at Frankfurt Stock Exchange. From the all-time lows, the stock price has developed a cycle higher in wave (I) towards 17.47 highs on November 2007. After the primary impulse higher, a correction lower in wave (II) has ended on November 2008 at 3.98.

From the November 2008 lows, a new cycle has started breaking the 17.47 highs. The red wave I has ended in December 2015 at 51.96. Hereby, within the impulsive advance, all the subwaves ((1)), ((3)) and ((5)) are impulsive waves, too. Wave ((3)) demonstrates a clear extension in price. From the December 2015 highs, a correction in wave II has unfolded as an expanded flat pattern. To recall, expanded flats are corrective structures which do, however, print a new high in price. As a matter of fact, we saw the all-time highs in wave ((B)) of II in January 2018 at 59.80. From there, the wave ((C)) has accomplished the pattern by printing the low in March 2020 at 20.69.

From the March lows, a new cycle in wave III of (III) may have started to the new highs. Break of 51.96-59.80 would confirm that. As of right now, the price is turning higher in a black wave ((1)). Once finished, pullback in wave ((2)) should find support in 3, 7, 11 swings above 20.69 lows for another extension higher in wave ((3)).

United Internet Elliott Wave Monthly

United Internet Daily Elliott Wave Analysis 09.10.2020
The Daily chart below shows the $UTDI shares price action in more detail. From the March lows at 20.69, the stock price has advanced in blue waves (1) - (3) of the black wave ((1)). Currently, the correction lower in wave (4) might have ended. Now, the UTDI stock may be extending to new highs in blue wave (5). Once the march cycle in wave ((1)) has finished, expect a pullback in wave ((2)) to find support in 3, 7 or 11 swings above 20.69 lows for a possible acceleration in wave ((3)) of III.

As an outlook, the new cycle in red wave III should bring the prices towards 51.96-59.80 and above. The target for wave III will be 68.70-98.36. Hereby, investors in technology stocks may be looking for an opportunity to buy UTDI in a pullback against 20.69 lows with an excellent risk-reward potential.

United Internet Elliott Wave Daily
 

Elliottwave-Forecast

Master Trader
Feb 17, 2017
2,453
9
84
www.elliottwave-forecast.com
Nike (NKE) has made another all-time high suggesting the bulls remain in firmly in control. Elliott Wave View of Nike suggests the stock is still within the cycle from March low as an impulse. Currently, the stock is within wave (5) from March low. The rally from March Covid-19 low to $117.42 ended wave (3). Pullback in wave (4) completed at $110.05 as a double three correction. Down from wave (3) at $117.42, wave W ended at $110.21, wave X ended at $113.84, and wave Y of (4) ended at $110.05.

Wave (5) rally is now in progress as an impulse Elliott Wave structure. Up from wave (4) low at $110.05, wave ((i)) ended at $113.26 and wave ((ii)) pullback ended at $112.66. The stock then resumed higher in wave ((iii)) towards $116.21, wave ((iv)) pullback ended at $114.34, and the final wave ((v)) ended at $118.23. This also ended wave 1 of (5) in higher degree. Pullback in wave 2 is proposed complete at $114 as a zigzag. Down from red 1 at $118.23, wave ((a)) ended at $115.43, wave ((b)) ended at $116.91, and wave ((c)) of 2 ended at $114. Near term, Nike still needs to break above wave 1 at $118.23 to avoid a double correction in wave 2. As far as pullback stays above $110.05, expect the stock to find support in 3, 7, or 11 swing for new all-time high.

Nike (NKE) 30 Minutes Elliott Wave Chart
Nike Elliott Wave chart
 

Elliottwave-Forecast

Master Trader
Feb 17, 2017
2,453
9
84
www.elliottwave-forecast.com
Hello fellow traders. In this technical blog we’re going to take a quick look at the Elliott Wave charts of EURJPY, published in members area of the website. As our members know, EURJPY is showing higher high sequences in the cycle from the May 6th low. Consequently we’ve been calling rally in EURJPY since the pair broke June 5th peak. The pair made pull back that has unfolded as Elliott Wave Zig Zag pattern In the further text we are going to explain the Elliott Wave Pattern and the Forecast.

Before we take a look at the real market example, let’s explain Elliott Wave Zigzag pattern.

Elliott Wave Zigzag is the most popular corrective pattern in Elliott Wave theory . It’s made of 3 swings which have 5-3-5 inner structure. Inner swings are labeled as A,B,C where A =5 waves, B=3 waves and C=5 waves. That means A and C can be either impulsive waves or diagonals. (Leading Diagonal in case of wave A or Ending in case of wave C) . Waves A and C must meet all conditions of being 5 wave structure, such as: having RSI divergency between wave subdivisions, ideal Fibonacci extensions and ideal retracement.

eurjpy

EURJPY 1h Hour Elliott Wave Analysis 9.8.2020
The pair is trading within the cycle from the 06/22 low. Currently we are getting Wave 2 red pull back that has for of Elliott Wave Zig Zag pattern. So far we got 5 waves down from the 127.086 peak, that is labeled as wave ((a)). Then we got 3 waves bounce in ((b)) short term recovery and breaks toward new lows. Correction still looks incomplete at the moment, suggesting we can get more short term weakness before rally takes place toward new highs.We expect to see at least another marginal push lower to have 5 waves in ((c)) leg as well.

EURJPY

EURJPY 1h Hour Elliott Wave Analysis 9.9.2020
The pair is still doing wave 2 red pull back that is unfolding as Elliott Wave Zig Zag pattern. Although current decline from the 125.98 peak can be counted as 5 waves, we believe another leg down would be ideal as equal legs ((a))-((b)) has not been reached yet. So current bounce can be unfolding as (iv). As far as 125.98 pivot holds we can get another leg down down toward 124.151-123.72 area. At that zone we would like to be buyers for proposed rally toward new highs or 3 waves bounce at least. We don’t recommend selling the pair at this stage.

You can learn more about Zig Zag Elliott Wave Patterns at our Free Elliott Wave Educational Web Page.

EURJPY

EURJPY 1h Hour Elliott Wave Analysis 9.10.2020
In the mean time we got stronger bounce than expected. Buyers were strong enough to break 125.98 pivot. At this stage we call Elliott Wave Zig Zag completed at the 124.38 low. Unfortunately this equal legs hasn't been reached, and we didn't get chance to enter the trade. Pull back ended as truncation. Now as far as the price holds above 124.38 low, we can get further extension up. The pair needs to see break above 09/07 peak in order to confirm next leg up is in progress. Then we will look for new potential buying opportunity. Anyway we don’t recommend selling the pair in any proposed pull back and expect further strength due to incomplete sequences from the May low.

Keep in mind market is dynamic and presented view could have changed in the mean time. You can check most recent charts in the membership area of the site. Best instruments to trade are those having incomplete bullish or bearish swings sequences.We put them in Sequence Report and best among them are shown in the Live Trading Room

EURJPY

Elliott Wave Forecast
 

Elliottwave-Forecast

Master Trader
Feb 17, 2017
2,453
9
84
www.elliottwave-forecast.com
NZDUSD Technical Analysis September 9/2020

NZDUSD remains bullish as long as the August 20/2020 0.6488 low remains untouched. In this analysis of the NZDUSD pair, market patterns will be used to determine possible trade entries. In the chart below, there is a possible bullish pattern that can trigger BUYS for another push higher. Possible blue bullish pattern triggers BUYS on the break above the entry line. Traders still need to be patient and wait to see if point E holds. If point E holds and price reverses higher then watch for the entry breakout level. Rule for this pattern is price needs to trigger buy signals above the 50MA and 200MA and if sell signals below the 2 moving averages. A bullish divergence pattern (purple) has already formed which adds more sentiment that the pair can break higher. Traders will need to wait and watch if point E holds or moves lower. As long as point E terminates above point C the bullish pattern remains valid. Only a move below the point C invalidates the possible bullish pattern. If looking to trade NZDUSD stops should be placed at the point E low looking for targets at the BC 1.618 Fib. level area. Only time will tell what NZDUSD will do but at least now you know how to trade the pair if it rallies higher.

NZDUSD 4 Hour Chart September 12/2020

NZDUSD, forex, trading, elliottwave, technical analysis, @AidanFX, Market patterns, AidanFX
 

Elliottwave-Forecast

Master Trader
Feb 17, 2017
2,453
9
84
www.elliottwave-forecast.com
On September 3 2020 I posted on social media Stocktwits/Twitter @AidanFX "LONGSIDE EURGBP". The chart below was also posted September 3 2020 showing that bullish market patterns were visible on the 4 hour chart calling for a move higher. Bullish Pattern (green) triggered BUYS at the XA 1.27 Fib. retracement level and the bullish AB=CD pattern (blue) triggered BUYS at the AB=CD level. I called for traders to add 3rd LONGS/BUYS at 0.8888 with stop loss for all BUY positions at 0.8808.

EURGBP 4 Hour Chart September 3 2020

EURGBP, forex, trading, elliottwave, market patterns, @AidanFX, AidanFX

EURGBP 4 Hour Chart September 11 2020

EURGBP, forex, trading, elliottwave, market patterns, @AidanFX, AidanFX

The pair rallied higher and hit the 1:5 RR 3rd BUY target at 0.9288 from 0.8888 for +400 pips. A trader should always use multiple time frame charts to look for possible trade entries. The EURGBP Daily chart below also displayed added bullish patterns signalling that the pair could move higher. On the Daily chart, the 4 hour bullish green pattern and blue AB=CD pattern triggered BUYS near the support/resistance level (black) and the Dynamic Support 200MA (blue) also converged in the same BUY area. What was clearly visible, on the Daily chart, was that price was respecting the 200MA Dynamic Support and repeatedly bounced higher from it adding more reasons to add the 3rd BUY entry. If you followed me on Twitter/Stocktwits @AidanFX you too could have caught the EURGBP move higher.

EURGBP, forex, trading, elliottwave, market patterns, @AidanFX, AidanFX
 

Elliottwave-Forecast

Master Trader
Feb 17, 2017
2,453
9
84
www.elliottwave-forecast.com
$USO United States Oil Fund Longer Term Cycles & Elliott Wave

Firstly the USO instrument inception date was 4/10/2006. CL_F Crude Oil put in an all time high at 147.27 in July 2008. USO put in an all time high at 953.36 in July 2008 noted on the monthly chart. The decline from there into the February 2009 lows was in three swings. An a-b-c in red although it was a very steep pullback.

Further, the bounce from the 2009 lows is a complex double three combination with a triangle “y”. This is w-x-y in red to end the blue wave (x). In either a bullish or bearish market this particular structure always makes a high or low in the initial wave “w”. After a wave "x" correction, structures like this will be followed by a contracting or running triangle. In this case the structure ended in June 2014. The decline from those highs were very sharp again. As can be seen, this was in three swings again a-b-c in red to end the blue wave (y). This completed a three swing correction (w)-(x)-(y) in blue from the July 2008 highs.

The analysis continues below the USO Monthly chart.


Secondly CL_F Crude Oil and the USO instrument as previously mentioned made an all time high back in July 2008. Each of the cycles appears to have declined in three big swings into the February 2016 lows. In the case of USO the price was 61.36. The bounce into the October 2018 highs was three swings again. The analysis continues below the USO Weekly chart.


In conclusion: The USO mirrors CL_F Crude Oil. The bounce from the February 2016 lows into the October 2018 highs appeared to have been a zig zag. Further this is a second (x)(x). As can be seen the decline from the October 2018 highs to the December 2108 lows was five waves and labeled “a”. There was a bounce that failed in April 2019 labeled “b”. Wave “c” made new lows in April 2020. While pullbacks remain above there expect it turning higher again.
 

Elliottwave-Forecast

Master Trader
Feb 17, 2017
2,453
9
84
www.elliottwave-forecast.com
$CPER Copper Index Tracker Long Term Corrective Cycles

Firstly the CPER Copper Index Tracking instrument has an inception date of 11/15/2011. There is data in the HG_F copper futures before this going back many years. That shows copper made an all time high on February 15th, 2011 at 4.649. Translated into this instrument, it is mentioned on the monthly chart. The decline from there into the January 2016 lows appeared to have been a double three in the commodity HG_F. Thus I will work with that idea in this CPER instrument.

The analysis continues below the CPER monthly chart.


Secondly the CPER Copper Index Tracking instrument from the all time highs made what is favored to be a double three correction lower. This ended at the 12.97 lows in January 2016. From the January 2016 lows up into the December 2017 highs appeared to be another double three structure. The bounce was strong enough on momentum indicators to suggest it had ended the cycle lower from the all time highs.

Thirdly, the CPER Copper Index Tracking instrument decline from the December 2017 highs is very ambiguous. This means it is open to more than one interpretation as is most any chart by an Elliott wave analyst. The key points here are as follows. From the 12.87 low from March 20th 2020 created a bearish sequence by taking out the lows from January 2016. This means it is in a 5th swing lower from the all time highs. The 5th swing target area is highlighted at 11.83-9.60 on the monthly chart above. Sometimes this area is not reached as this one did in view 2. The bounce from there in our trend system looks strong and impulsive as well as suggests it ended the cycle lower from the all time highs.

In conclusion: Copper did not make that new low and did remain above the January 2016 lows. For that reason I will prefer view 1 that this instrument will hold above the March 2020 lows when it corrects the cycle up from there. If it gets below the March 2020 lows then look for new low in the 5.98 area to be the end of a corrective cycle.
 

Elliottwave-Forecast

Master Trader
Feb 17, 2017
2,453
9
84
www.elliottwave-forecast.com
Elliott Wave View of FTSE suggests the Index ended the cycle from August 12 high as wave ((a)) at 5778.40 low. The subdivision of the decline unfolded as 5 waves impulse Elliott Wave Structure. Down from wave X high, wave (i) ended at 6036.13 low. Wave (ii) bounce unfolded as a flat correction and ended at 6173.48 high. Index then resumed lower in wave (iii), which ended at 5824.04 low. Afterwards, the bounce in wave (iv) ended at 5996.24 high. Finally, the push lower in wave (v) ended at 5778.40. This also ended wave ((a)) in higher degree.

Currently, Index is doing a bounce in wave ((b)) to correct the cycle from August 12 high. The bounce is unfolding as zigzag correction. Wave (a) ended at 5985.26 high and wave (b) pullback ended at 5868.87 low. Wave (c) is currently is progress and can do another marginal high before ending wave ((b)) in higher degree. The bounce has reached blue box area, which is 100-161.8% extension of wave (a)-(b) at 6075-6203. This area should see sellers appear for more downside or 3 waves pullback at least. While below 6298 high, bounce in 3,7 or 11 swings is expected to fail for more downside. The target to the downside for FTSE is the 100-161.8% extension area from June 8 high against August 12 high at 5483-5638.

FTSE 1 Hour Elliott Wave Chart
FTSE 9.15.20 Asia
 

Elliottwave-Forecast

Master Trader
Feb 17, 2017
2,453
9
84
www.elliottwave-forecast.com
In this technical blog we’re going to take a quick look at the Elliott Wave charts of NZDJPY, published in members area of the website. As our members know, NZDJPY has recently given us 3 waves pull back against the 68.73 low. That pull back has unfolded as Elliott Wave Zig Zag pattern ((a))((b))((c)). After it completed we got nice bounce higher as expected. In the further text we are going to explain the Elliott Wave Pattern and the Forecast.

Before we take a look at the real market example, let’s explain Elliott Wave Zigzag pattern.

Elliott Wave Zigzag is the most popular corrective pattern in Elliott Wave theory . It’s made of 3 swings which have 5-3-5 inner structure. Inner swings are labeled as A,B,C where A =5 waves, B=3 waves and C=5 waves. That means A and C can be either impulsive waves or diagonals. (Leading Diagonal in case of wave A or Ending in case of wave C) . Waves A and C must meet all conditions of being 5 wave structure, such as: having RSI divergency between wave subdivisions, ideal Fibonacci extensions and ideal retracements.

NZDJPY

NZDJPY 1 Hour Elliott Wave Analysis 9.8.2020
Currently we are getting Wave 2 red pull back back against the June 68.73 low. Correction still looks incomplete at the moment . We can see the price is showing lower low sequences from the peak,suggesting we can get more short term weakness before turn happens. First leg ((a)) black unfolded as 5 waves down from the peak. Then we got 3 wave bounces in wave ((b)) and finally, we’re doing last leg down ((c)) black. We expect to see 5 waves down n ((c)) leg as well. Pull back should ideally complete at 70.43- 69.76 area , which is equal legs ((a))-((b)). We don’t recommend selling the pair and favor the long side against the 68.73 low.

NZDJPY

NZDJPY 1 Hour Elliott Wave Analysis 9.10.2020
We got 5 waves down in wave ((c)) as expected. Pull back reached ((a))-((b)) equal legs 70.43- 69.76 and started bouncing . The pair needs to see break above 09/02 ( 1 red) peak in order to confirm next leg up is in progress. We expect short term rally to complete soon as 5 waves - wave ((i)) black, before ((ii)) takes place. Anyway we don’t recommend selling the pair in any proposed pull back


NZDJPY

NZDJPY 1 Hour Elliott Wave Analysis 9.15.2020
Eventually we got ((ii)) pull back that ended at 70.426 low. After short term consolidation we got new short term high which now makes pair supported against the 70.426 low.As far as the mentioned low holds next technical zone to the upside comes at 71.75-72.06. Alternatively if 70.42 pivot gives up, we can still be in ((ii)) which might be unfolding as irregular flat.

Keep in mind market is dynamic and presented view could have changed in the mean time. You can check most recent charts in the membership area of the site. Best instruments to trade are those having incomplete bullish or bearish swings sequences.We put them in Sequence Report and best among them are shown in the Live Trading Room

NZDJPY

Elliott Wave Forecast
 

Elliottwave-Forecast

Master Trader
Feb 17, 2017
2,453
9
84
www.elliottwave-forecast.com
Many World Indices, Stocks and ETFs have been rallying since the March 2020 lows. As we always say at EWF: "Nothing lasts forever nor runs in a straight line - when it comes to the market". In fact, we believe in the idea that the market trades between defined areas. These areas need to be reached. Also, the market is frequently waiting for an event before making a move.

US Elections and Indices Market
Right now, we are in about 50 days from US General Elections. Most of the time in the past, these have created a lot of volatility across the market. Back in 2016, we were able to catch the reaction higher during the Election night. And we hope to do the same this year. The following article is explaining how we were able to buy the Indices that night into a huge rally. Back in 2016, the Market was primed for a rally. Indices were trading within a bullish sequence. Therefore, the rally towards the new all-time highs was expected. The following chart below shows our expectations as of November 2016:

Market Elliott Wave SPX

The chart is a representation of the bullish sequence in the $SPX500. Those days, the higher targets have still not been achieved. Therefore, the right side was clearly up and we expected an extension higher. In fact, we were looking for more upside, no matter who would be elected as a president.

Yen Pairs and Indices Market
This time around, however, it is different, a lot different. On the one hand, the Market is not that open to the upside and on the other hand, it is within a fight between the YEN and the Indices. Many YEN pairs are still calling lower. Among them is $SEKJPY which is favored to see more downside. We explain our view here on the example of $SEKJPY. Nevertheless, it does apply to all YEN pairs. As a matter of fact, falling YEN pairs means strong YEN. And as a consequence, a strong YEN translates into Indices moving sideways to lower. Therefore, we do not see that much more upside in the Indices.

Gold prices and Indices Market
Another, very important instrument entering this year's US Elections is Gold, which has been trading higher and has broken the 2011 highs. The fact of that break has created a higher high from the all-time lows, i.e., a bullish sequence. Expectation of Gold extending higher is in agreement with the $SEKJPY falling lower. The following chart:

Market Elliott Wave Gold

is a representation of the bullish sequence in Gold and the overall path in the next future. We conducted a FREE seminar to explain the overall view of both precious metals: Gold and Silver. The described path is clearly pointing higher.

Last but not least, we will look at the Indices and how they may be ending a cycle from the March 2020 lows. Minimum will be contraction within the Group until the Market is ready to rally. Most of the Indices are within an important crossroad. Either they are ending the Grand Supercycle from the all-time lows. Or the rally from the March 2020 lows is just the beginning of a new Cycle degree within a super nest which will be trading higher for years to come. We explain our view here.

Conclusion
Many traders across the Market are still applying fundamentals to forecast the market. They, in fact, are making the case that the market move will depend on the result of the Elections, i.e., the winning party. We at EWF, however, do not believe in that causality. Back in 2016, expectation was that the victory of Donald Trump would cause a crash. Today we know that the opposite has happened.

Here and now, we are not trying to forecast the Elections or anything in that regard. The point we are making is that the Market at current stage is not ready for an important rally. As of right now, it may spike higher and then correct lower or it may correct lower from current levels. To facilitate a rally in indices we do need a YEN weakness and/or the Gold pulling lower. In both weekly and daily views, neither scenario is possible. So let's not trade the fundamentals which is the Election results, but trade the technical nature of the market. This means, in particular, to wait for a clear setup to go LONG Indices.
 

Elliottwave-Forecast

Master Trader
Feb 17, 2017
2,453
9
84
www.elliottwave-forecast.com
In this blog, we are going to take a look at the Elliott Wave chart of Palladium (PA_F). The 1 hour NY Midday chart update from September 3 shows that wheat has ended the cycle from August 12 low as wave (3) at 2415 high. Elliott Wave theory dictates that 3 waves pullback should happen afterwards before the rally continues. Therefore, Palladium is expected to do a pullback in wave (4), which could unfold as a zigzag correction or double three correction.

PA_F 9.3.2020 1 Hour NY Midday Elliott Wave Chart
Palladium 9.3.2020 NY Midday

The 1 hour NY chart update from September 9 shows that Palladium has ended wave (4) pullback as a zigzag correction. Down from wave (3) high, wave A ended at 2303 low. Wave (B) bounce unfolded as a flat and ended at 2341.40 high. The metal then resumed lower and ended wave C at 2255.30 low. This final push lower also ended wave (4) in higher degree. As long as that low stays intact, then the metal can continue to resume higher. However, the metal still needs to break above wave (3) high to confirm that the next leg higher has started. Otherwise, wave (4) could still unfold as a double three correction before upside resume again.

PA_F 9.9.2020 1 Hour NY Elliott Wave Chart
Palladium 9.9.2020 NY

The 1 hour Asia chart update from September 16 shows that Palladium continued to extend higher from wave (4) low. The rally has broken above previous wave (3) high, confirming that the next leg higher has already started and wave (4) low is in place. While above 2255.29 low, dips in 3,7, or 11 swings are expected to find support for more upside.

PA_F 9.16.2020 1 Hour Asia Elliott Wave Chart
Palladium 9.16.20 Asia