Elliottwave-Forecast

Master Trader
Feb 17, 2017
2,452
9
84
www.elliottwave-forecast.com
The Euro Dollar has continued to slide since topping out on July 2008 at 1.6038. However, sentiment on the euro has recently improved after European Union leaders agreed to massive stimulus plan to counter the corona virus. The deal will see the EU issue 750 billion euro ($882 billion) of joint debt to help member states.

Elsewhere, the Dollar Index, which measures the greenback against a basket of leading currencies, posted more than 4% decline in July. This is the biggest monthly drop since September 2010. Further easing of the US monetary policy and falling bond yields all contribute to this factor. As Euro Dollar is the single biggest component in the Dollar Index at 57.6%. the Euro Dollar has rallied tremendously in July.

Market consensus has shifted towards the Euro as the zone has been able to manage the pandemic better than the U.S. Thus, the economic damage will be less severe in the area. A long term trend line analysis in Euro Dollar below also might indicate a potential reversal in the single currency

Euro Dollar ($EURUSD) Weekly Chart
Euro Dollar broke above 2008 bearish channel

Weekly chart of EURUSD above shows a 5 swing sequence from the all-time low. The rally from all-time low to July 2008 high can either be counted as a diagonal (which is bullish and expecting another leg higher) or it can also be a 5th swing of a 7 swing WXY sequence. Either way, it implies more upside should be seen.

As we can see, the rally last month technically broke above the descending trend line since 2008 high. Not only that, we can see the pair also continues to hold within a well defined upward parallel channel. This development may suggest a potential change in the coming months for the pair. At the minimum it's now possible to expect pair to at least do an extension from December 2016 low, which suggests Euro strength in coming weeks / months.

Note however that other USD pairs such as USDCHF still shows 5 swing sequence from 2016 low, thus there's still a possibility that EURUSD can see one more low after ending the extension from December 2016 low. Nonetheless, in the medium term measured in weeks at least, we can continue to see EURUSD extending higher. A 100% extension from December 2016 low can take us to 1.289 - 1.342 area.

$EURUSD Daily Elliott Wave Chart


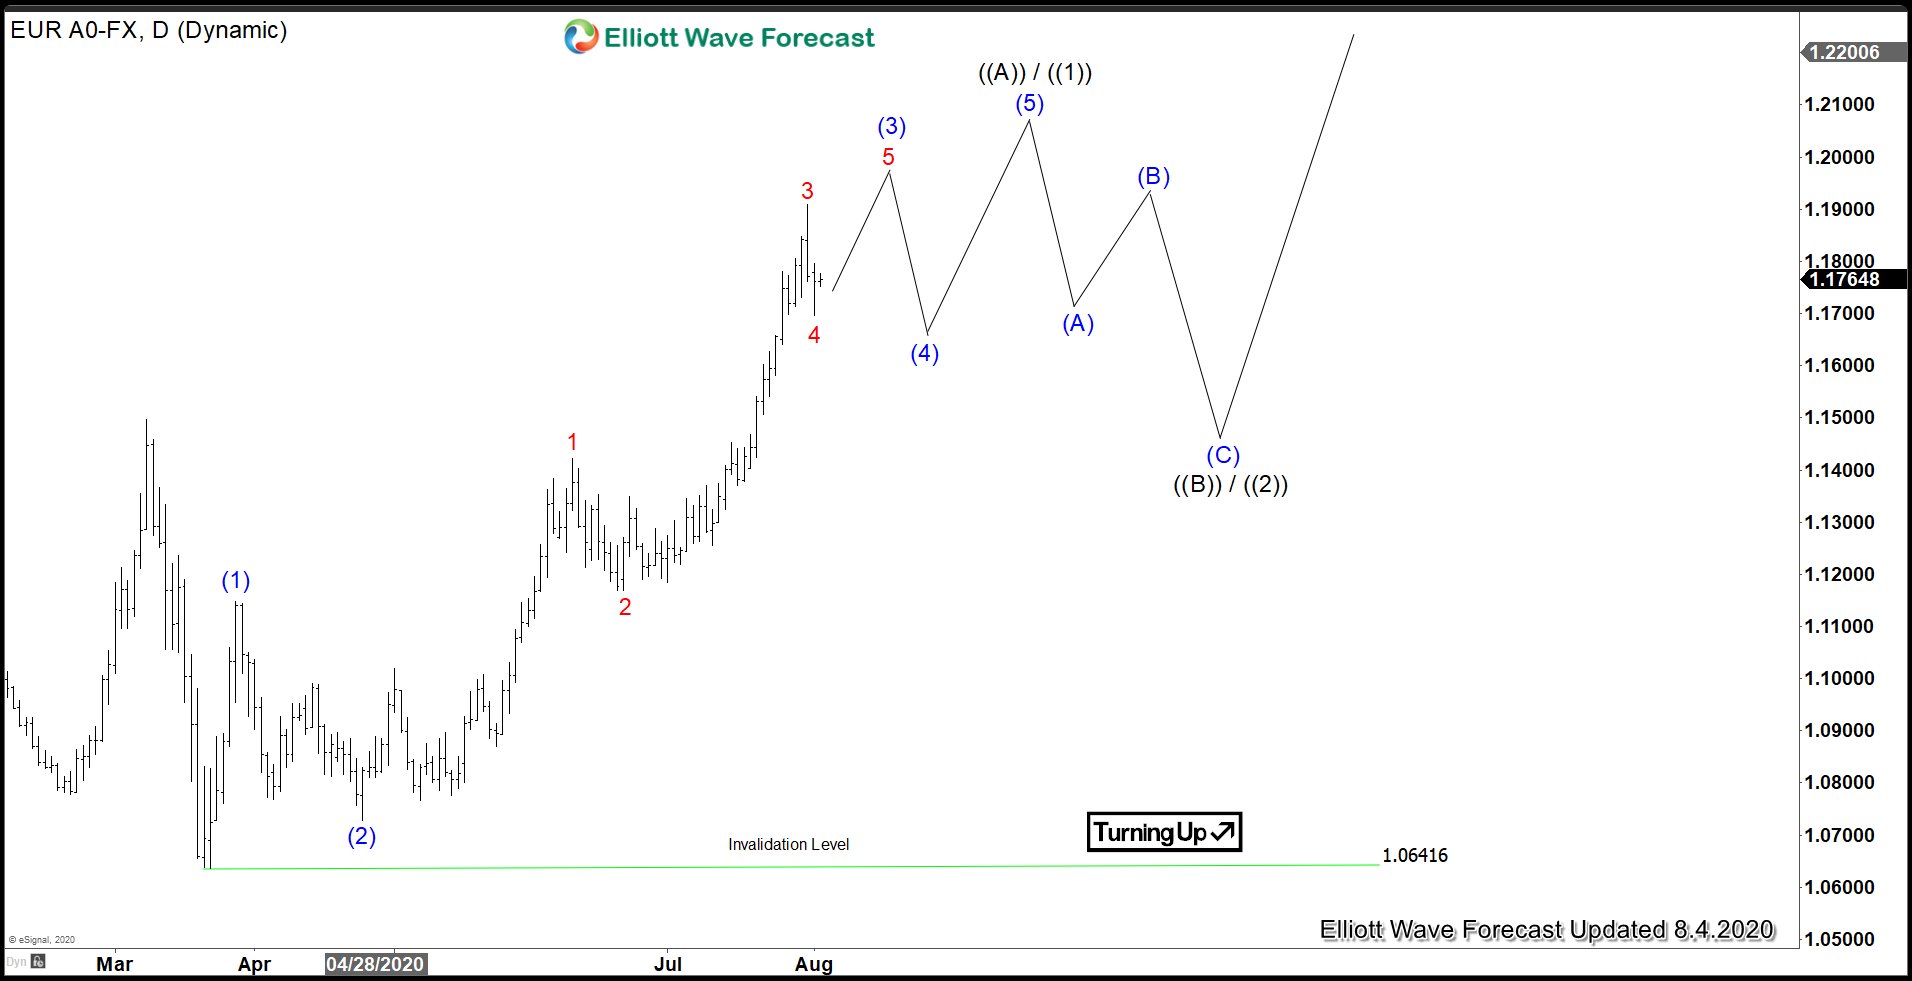
Daily Elliott Wave Chart above shows the rally from March 2020 low (1.064) looks impulsive. The rally remains in progress and once the 5 waves impulse rally is complete, it should pullback to correct that rally in 3, 7, or 11 swing before the next leg higher. The 5 waves rally can either end wave ((A)) or wave ((1)) in higher degree. Either way, as far as the pullback stays above March 2020 low, pair has scope to extend higher again in coming weeks / months.
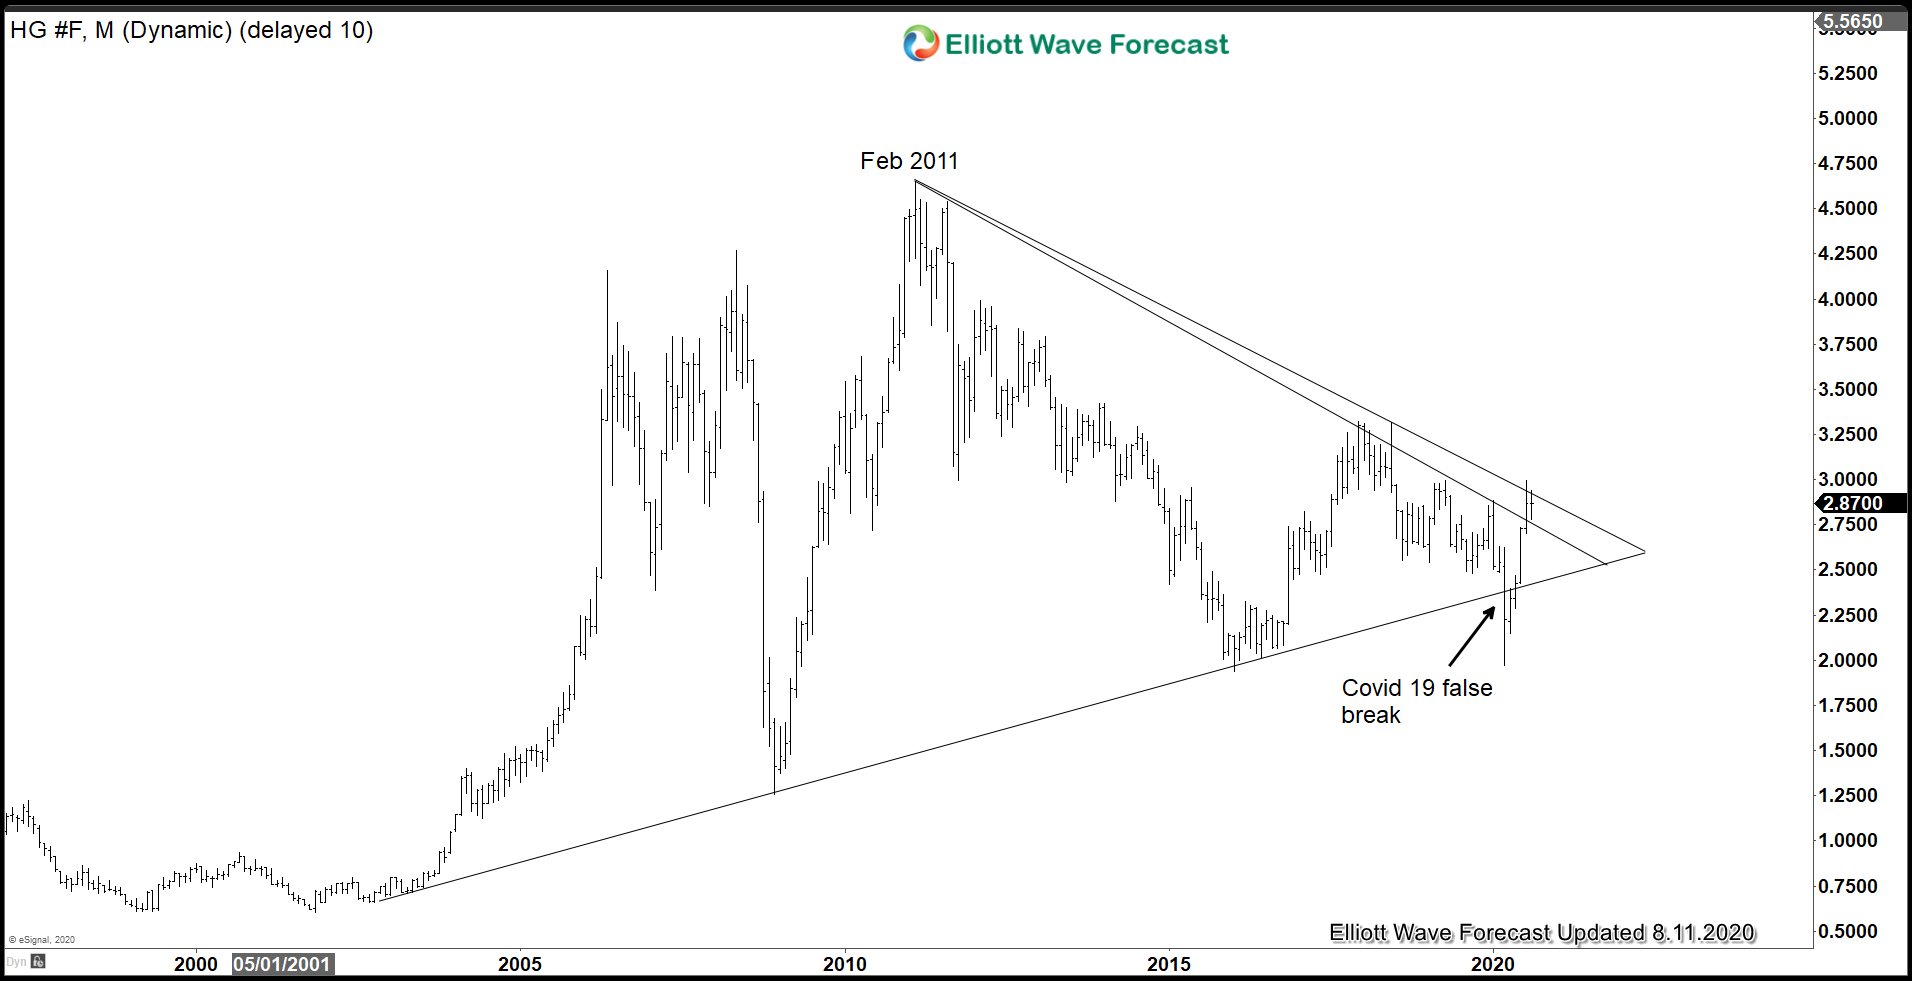
 

Elliottwave-Forecast

Master Trader
Feb 17, 2017
2,452
9
84
www.elliottwave-forecast.com
$NEM The Longer Term Bullish Cycles of Newmont Corporation

Firstly from the beginning of price data from back in the 1970’s not shown on the chart, the price trend was obviously up. It ended that bullish cycle in September 1987 and pulled back really hard during the October 1987 crash. Price stabilized from there several years into the 1996 highs before another cycle lower into the October 2000 lows. That swing lower finished a correction of the cycle up from the all time lows. Those lows are still intact. The bounce that developed from the October 2000 lows into the January 2006 highs appears to have been an Elliott Wave impulse of five waves.

Secondly the three large swings from the January 2006 highs down to November 2008 lows appears to be the beginning of a large flat 3-3-5 structure. From the November 2008 lows back up to the November 2011 highs was likely a zig-zag structure by itself. The decline from the November 2011 highs down to the August 2015 lows appeared to be five waves. This completed a 3-3-5 flat structure. Of note, the lows from October 2000 remained intact again suggesting the August 2015 lows finished correcting that cycle up from there.

The analysis continues below the chart.


Thirdly in conclusion the aforementioned lows from August 2015 & now as well as the October 2018 lows should remain intact during future pullbacks for a long time to come. The bounce from those lows definitely ended the cycle lower. The bounce to the August 2016 high appeared to be five waves up. This was similar to the October 2000 to January 2006 bounce although of smaller degree. The pullback lower from the August 2016 high to the October 2018 low was obviously three swings. Price has bounced real hard from there suggesting it is within a larger degree wave three. Pullbacks should remain relatively shallow such as ..236 to .382 of the October 2018 cycle. While doing that, the possibility remains that current cycle will take out the old highs from September 1987 in the not too distant future.
 

Elliottwave-Forecast

Master Trader
Feb 17, 2017
2,452
9
84
www.elliottwave-forecast.com
Company Profile. NIO Inc. is a pioneer in China's premium electric vehicle market. We design, jointly manufacture, and sell smart and connected premium electric vehicles, driving innovations in next generation technologies in connectivity, autonomous driving and artificial intelligence. Nio held its U.S. IPO back in September of 2018, selling IPO shares at $6.26 and raising $1 billion.

For years, Tesla also reported large losses and was forced to raise outside capital. However, Nio’s sales slumped in 2019, taking the wind out of the growth stock story.

Latest News: NIO saw a huge surge in demand for its SUVs during July. Total vehicle volume came to 3,533, which was more than quadruple what NIO delivered in July 2019. The delivery numbers included 2,610 of NIO's ES6 electric SUVs and 923 of its larger ES8 models.

Technical Picture: After the IPO price of $6.26, it quickly rose to $13.80 and then saw a steady decline to $1.19 in September 2019. It started getting bid again and now the rally from September 2019 low appears impulsive, we will look at the Weekly chart to see the long-term view and also look at the near-term view on a 240 minute chart.

NIO Weekly Elliott Wave Analysis
Decline from September 2018 peak to September 2019 low was in 3 waves and since then we can see a rally which is so far in 3 waves but wave ((3)) reached 323.6% of wave ((1)) which supports the idea of an impulse in the making because when 3rd leg passes 161.8% of the 1st leg, it's indicative of an impulse wave in progress. Another high is expected to complete an impulsive advance from September 2019 low and after that we can see a pull back to correct the rally September 2019 low before the stock can see acceleration higher.

NIO Weekly Elliott Wave Analysis

NIO: 4 Hour Elliott wave Analysis
NIO decline from wave ((3)) high was in 7 swings and appears to have completed wave ((4)) at $10.46. As dips hold above $10.91 and more importantly above $10.46, we are expecting wave ((5)) to continue higher toward $17.92 - $20.31 area to complete wave ((5)) before profit taking takes place and some sellers enter the market to create a downward reaction.

NIO 4 Hour Elliott Wave Analysis

NIO Alternate View: Triangle in wave ((4))
Alternatively, wave ((4)) can take the form of a triangle before we get a break higher in wave ((5)).

NIO wave ((4)) triangle
 

Elliottwave-Forecast

Master Trader
Feb 17, 2017
2,452
9
84
www.elliottwave-forecast.com
EURJPY 45 Minutes chart below shows that the pair has ended the cycle from July 22 high in wave ((iv)) at 122.81 low. Up from wave ((iv)) low, the pair extended higher in wave (i), which ended at 123.87 high. The pullback in wave (ii) then ended at 122.98 low. The correction unfolded as a Flat Elliott Wave Structure. Afterwards, the pair resumed higher in wave (iii), which ended at 125.20 high. The subdivision of wave (iii) unfolded as a 5 waves impulsive Elliott Wave Structure. Wave (iv) pullback then ended at 123.96 low. Currently, wave (v) is in progress. It needs to break above wave (iii) high to confirm the next leg higher has already started. While above 122.81 low, the pair can still see a few more highs before ending a larger degree wave 1. Afterwards, it should pullback in wave 2 to correct cycle from June 22 low before the rally resumes again.

The recent rally in EURJPY has broken above June 5 high. The pair is now showing a bullish sequence against May 6 low. The 100-123.6% extension where the rally can potentially end is between 129.24-131.61 area. As long as June 22 low at 119.12 stays intact, expect the dips in 3,7 or 11 swings to find support for more upside in the near term targeting the equal leg area.

EURJPY 45 Minutes Elliott Wave Chart
EURJPY 8.5.2020 Asia
 

Elliottwave-Forecast

Master Trader
Feb 17, 2017
2,452
9
84
www.elliottwave-forecast.com
Hello fellow traders. Another instrument that we have been trading lately is SILVER ( $XAGUSD ) . In this technical blog we’re going to take a quick look at the Elliott Wave charts of SILVER, published in members area of the website. As our members know, SILVER is showing Impulsive sequences in the cycle from the March low, calling for further rally. Consequently, we advised members to avoid selling SILVER and keep on buying the dips in the sequences of 3,7,or 11 swings whenever get chance. In further text we’re going to explain Elliott Wave Forecast.

SILVER 1 Hour Elliott Wave Analysis 7.28.2020
Current view suggests SILVER is trading within March cycle that is unfolding as impulsive structure. The price made clear 3 waves pull back that reached blue box area at 22.74-21.43 ( buying zone). We got nice reaction shortly after. As the bounce has already reached 50 fibs against the middle pivot (b) blue, all long positions should be risk free per our Official Trading Strategy. Now we expect to see further separation from the low ideally.

SILVER

SILVER 1 Hour Elliott Wave Analysis 7.31.2020
We got nice reaction so far. The price is still trading sideways in short term. As far as the price stays above 22.218 low, we see (4) blue pull back completed there and looking for further extension up. We would like to see break above (3) blue peak 07/28 which will confirm next leg up is in progress. Alternatively if the price breaks below 22.21 low, we would buy SILVER again at the next set of equal legs (blue box area).

Silver

SILVER 1 Hour Elliott Wave Analysis 08.05.2020
Eventually we got rally as expected. The price has made new high , confirming further extension up ideally. The commodity is now bullish against the 22.27 low and should ideally keep finding buyers in 3,7,11 swings as far as that pivot holds.

Keep in mind that market is dynamic and presented view could have changed in the mean time. Best instruments to trade are those having incomplete bullish or bearish swings sequences. We put them in Sequence Report and best among them are shown in the Live Trading Room. You can check most recent charts in the membership area of the site.

SILVER

Elliott Wave Forecast
 

Elliottwave-Forecast

Master Trader
Feb 17, 2017
2,452
9
84
www.elliottwave-forecast.com
In this technical blog, we will look at the past performance of 1 hour Elliott Wave Charts of NASDAQ index, which we presented to members at elliottwave-forecast. In which, the rally from March 22 March 2020 low unfolded as an impulse structure with a higher high sequence favored more upside extension to take place. Therefore, we advised members not to sell the index & buy the dips in 3, 7, or 11 swings at the blue box areas. We will explain the structure & forecast below:

NASDAQ 1 Hour Elliott Wave Chart
NASDAQ Forecasting The Elliott Wave Flat Correction

NASDAQ 1 Hour Elliott Wave Chart from 7/24/2020 Midday update. In which, the cycle from 29 June 2020 low ended wave ((1)) as 5 waves impulse structure at $11058.50 high. Down from there, the index made a pullback in wave ((2)). The internals of that pullback unfolded as Elliott Wave Flat Structure. Whereas, wave (A) ended in 3 swings at $10358.75 low. Wave (B) bounce also ended in 3 swings at $11058 high. Down from there, wave (C) unfolded in 5 waves structure. And managed to reach the $10363.85- $10200.06 100%-123.6% Fibonacci extension area of (A)-(B). From there, buyers were expected to appear for more upside or for 3 wave bounce at least.

NASDAQ 1 Hour Elliott Wave Chart
NASDAQ Forecasting The Elliott Wave Flat Correction

Here's 1 Hour Elliott Wave Chart from 8/04/2020 Asia update. The index is showing a reaction higher taking place from the blue box area after ending the Flat correction at $10306.39 low. And breaking to new highs as expected. Allowed members to create a risk-free position shortly after taking the long positions.
 

Elliottwave-Forecast

Master Trader
Feb 17, 2017
2,452
9
84
www.elliottwave-forecast.com
Fresnillo plc is the world largest silver producer which has its headquarters in Mexico City. Founded 2008, incorporated in UK and traded under tickers $FRES at LSE and $FNLPF in US in form of ADRs, it is a component of the FTSE100 index. Besides its dominating role in silver, Fresnillo plc is also the second largest gold miner of Mexico. Currently, silver is turning up from the march 2020 lows. Therefore, an investment in shares of a silver producing company can provide an exposure to the prices of that precious metal. Hereby, Fresnillo plc as a market leader should become an excellent investment candidate.

Fresnillo Monthly Elliott Wave Analysis 08.06.2020
The monthly chart below shows the Fresnillo stock $FRES at LSE. From the November 2008 lows at 93, the stock price has developed a cycle higher in wave (I) of a super cycle degree. Fresnillo has printed a top on September 2011 at 2213. The cycle up is an impulse; it shows 5 subwaves of a cycle degree and a separation within the wave III.

From the 2011 highs at 2213, a correction lower has unfolded as a zigzag correction being a 5-3-5 structure. Red waves a and c are showing a regular umpulse, the connector in wave b is an expanded flat structure. The wave c has reached an equality with the wave a at the equal legs extension area towards 494.98-134.93. As a consequence, price shows a reaction higher from that zone. The strong advance confirms the end of the wave c of the blue wave (II). Also, the larger correction in wave (II) as a whole has highly probably ended. Therefore, while above 454.71, the price can extend higher within wave (III) towards 2213 and higher or should do a 3 waves bounce at least.

Fresnillo Elliott Wave Monthly

Fresnillo Monthly Elliott Wave Analysis 08.06.2020
The weekly chart below shows in more detail the last leg lower in wave c of blue wave (II) and the sharp advance out of the equal legs extension area being 494.98-134.93. The push up from the March 2020 lows can be seen so far as a 3 waves move. However, wave (3) has already surpassed the 1.618 multiple extension of the wave (1). Therefore, after a pullback in wave (4), expect another leg higher in wave (5) to end the black wave ((1)).

Investors and traders can obtain a good opportunity to enter the rally in $FRES at a pullback. Medium-term, a correction lower in wave ((2)) should find support above the March lows at 454.71 in 3, 7 or 11 swings. Then, an extension higher in wave ((3)) to new highs should follow or $FRES should produce another leg higher at least. As an outlook, montly target for the wave (III) is 2572-3885. Break of the 2213 level would confirm that the wave (III) is underway.

Fresnillo Elliott Wave Weekly
 

Elliottwave-Forecast

Master Trader
Feb 17, 2017
2,452
9
84
www.elliottwave-forecast.com
NZDUSD Technical Analysis August 8/2020

NZDUSD remains bullish as long as the June 22/2020 0.6378 low remains untouched. In this analysis of the NZDUSD pair, market patterns will be used to determine where price can possibly reverse and bounce higher from. In the chart below, there are several possible bullish patterns that can trigger BUYS near the same area. The blue bullish reciprocal AB=CD pattern triggers BUYS at the BC 0.50% Fib. retracement level, purple bullish pattern triggers BUYS at the XA 0.786% Fib. retracement level and the black bullish AB=CD pattern also triggers buys at the same levels of the purple and blue bullish patterns. Traders still need to be patient and wait to see if price dips lower to the buy trigger levels. Also for more added confirmation watch for price to respect the the dynamic support (grey 200 moving average) and the static support/resistance level (brown). Price respecting the dynamic support and the static support level will add more bulls to enter the market and give more momentum for a possible bounce higher. Traders will need to wait and watch how price reacts in the blue box reversal zone and watch to see if the market shows a movement higher off any of the bullish pattern trigger levels. If looking to trade NZDUSD stops should be placed at the point B low of the blue bullish pattern, or for tighter stops at the point X low of the purple bullish pattern, looking for a rally higher to extend above the July 31/2020 highs. Only time will tell what NZDUSD will do but at least now you are aware of the possible area where the pair can bounce higher from.

NZDUSD 4 Hour Chart August 7/2020

NZDUSD, forex, trading, elliottwave, technical analysis, bullish patterns, @AidanFX, AidanFX

Of course, like any strategy/technique, there will be times when the strategy/technique fails so proper money/risk management should always be used on every trade. Hope you enjoyed this article and follow me on Twitter for updates and questions> @AidanFX or chat me on Skype > EWF Aidan Chan

*** Always use proper risk/money management according to your account size ***

At Elliottwave-Forecast we cover 78 instruments (Forex, Commodities, Indices, Stocks and ETFs) in 4 different timeframes and we offer 5 Live Session Webinars everyday. We do Daily Technical Videos, Elliott Wave Trade Setup Videos and we have a 24 Chat Room. Our clients are always in the loop for the next market move.
 

Elliottwave-Forecast

Master Trader
Feb 17, 2017
2,452
9
84
www.elliottwave-forecast.com
In this blog, we are going to take a look at the Elliott Wave chart of Facebook (FB). The 30 minutes pre-market chart from August 4, 2020 shows that the stock has rallied higher from wave (2) low at 226.92. That pullback in wave (2) reached the blue box area, which is an area where we expect buyers to appear. The stock resumed higher from there and broke above July 13 high. The stock is now showing a bullish sequence against June 29 low.

Facebook 8.4.2020 30 Minutes Pre-Market Elliott Wave Chart
Facebook 8.4.2020 Pre Market

Up from wave (2) low, the stock ended wave ((i)) at 235.05 high. The pullback in wave ((ii)) ended at 229 low. Afterwards, the stock extended higher in wave ((iii)), which ended at 256 high. The stock is then expected to do a pullback in wave ((iv)). The dip unfolded as a zig-zag Elliott Wave structure. The 100-161.8% extension of (a)-(b) where (c) is expected to end is between 243.83-248.22 area. This area is highlighted with another blue box, where the stock can see 3 waves bounce at least if reached.

Facebook 8.6.2020 30 Minutes Post-Market Elliott Wave Chart
Facebook 8.6.2020 Post Market

The 30 minutes chart from August 6 shows that there is a small adjustment to the count. The rally higher is now called complete as wave 1 and the pullback is proposed to be in wave 2. Nonetheless, the stock reached the proposed blue box area and ended wave 2 at 247.35, which is within the blue box area. That area saw buyers appear and pushed the stock higher, breaking the previous wave 1 high. This confirms that wave 2 is already in place and the next leg higher is wave 3 is already in progress.

Facebook 8.9.2020 30 Minutes Weekend Elliott Wave Chart
Facebook 8.9.2020 Weekend

The weekend chart from August 9 shows that the stock has ended the rally higher in wave ((iii)) at 278.89 high. The pullback in wave ((iv)) then followed and ended at 265.77 low. While above 247.42 low, the stock can see more upside. However, Facebook needs to break above previous wave ((iii)) high to confirm that the next leg higher has started. Otherwise, the stock can still do 7 swing correction in wave ((iv)) before resuming higher again.
 

Elliottwave-Forecast

Master Trader
Feb 17, 2017
2,452
9
84
www.elliottwave-forecast.com
Hello fellow traders. In this technical blog we’re going to take a quick look at the Elliott Wave charts of OIL , published in members area of the website. As our members know, commodities have been giving us nice profits recently. OIL is another commodity that has given us rally from the Blue Box area. The price structure has been showing higher high sequences. Consequently, we advised members to avoid selling OIL and keep on buying the dips in the sequences of 3,7,or 11 swings whenever get chance. In further text we’re going to explain Elliott Wave Forecast.

OIL 1 Hour Elliott Wave Analysis 7.29.2020
OIL remains bullish against the 37.27 pivot. The commodity is doing pull back 2 red that still looks incomplete at the moment. As far as the price stays below ((b)) black high. We expect to see another leg down toward 39.9-38.64 area( buyers zone). At the mentioned zone buyers should ideally appear for further rally toward new highs. As our members know, Blue Boxes are no enemy areas , giving us 85% chance to get a bounce. We don’t recommend selling OIL against the main trend. We favor the long side from the marked blue box area. As the main trend is bullish, we expect to see 3 waves bounce at least from the mentioned zone.

OIL

OIL 1 Hour Elliott Wave Analysis 8.3.2020
After sideways consolidation, we got proposed extension down toward blue box. The commodity found buyers at 39.9-38.64 area. The bounce is still shallow at the moment, however as far as the price stays above 38.75 low, pull back can be done there. We would like to see further separation from the 38.75 low and ideally break above 07/21 peak (42.53) to confirm next leg up is in progress.


OIL

OIL 1 Hour Elliott Wave Analysis 8.10.2020
38.75 low held well during the short term pull back and we got rally. Eventually the price broke above 07/21 peak (42.53). Now the commodity should ideally remain supported as far as 38.74 pivot holds. Current view suggests that pull back B red can be still in progress as shown on the chart. We got 5 waves down from the peak which can be only the first leg ((a)) of B.

Keep in mind market is dynamic and presented view could have changed in the mean time. You can check most recent charts in the membership area of the site. Best instruments to trade are those having incomplete bullish or bearish swings sequences.We put them in Sequence Report and best among them are shown in the Live Trading Room

OIL

Elliott Wave Forecast
 

Elliottwave-Forecast

Master Trader
Feb 17, 2017
2,452
9
84
www.elliottwave-forecast.com
Since bottoming in January 2016 low at Copper $1.93, Copper has traded in a narrow range between $1.9 - $3.3. Earlier this year, the red metal collapsed to the lowest in more than 4 years at $1.9725. This happened due to the Covid-19 breakout around the world which dampens global growth. However, despite the extremely challenging environment in global economy, the metal has climbed back 50% in the past few months.

Several factors contribute to this rally: China's economic recovery, massive stimulus by global central banks, and lower US Dollar. As China's economy begin to recover in the second quarter of 2020, Copper started to climb its way up. Robust growth in China's industrial and service sectors have supported the price of the metal, while other nations continue to combat the pandemic. Despite the resurgence of the virus, China's factory activities continue to improve for fifth consecutive month in July 2020. China's official manufacturing PMI rose to 51.1 in July 2020, beating the market expectation of 50.7.

The massive stimulus package by major central banks around the world to counter the economic fallout also set the floor and continue to support the price of the metal. Solid growth demand in China together with eventual revival in the manufacturing sectors of major economies can see Copper price to trade higher in the coming months.

Copper Monthly Chart


Monthly chart of Copper above shows the metal has traded in a narrowing range since 2002 low. The metal broke below the ascending trend line from 2002 low in March 2020 this year. However, the breakout was brief and the metal has since recovered. Currently, it's pushing against the bearish trend line from Feb 2011 high. A break above the descending trend line can start a new bullish market for the metal.

Copper Weekly Elliott Wave Chart
Copper looking to start a new bullish market

Weekly Elliott Wave Chart of Copper above shows the rally from January 2016 low (1.932) as 5 waves impulse, which ended either wave I or wave A. Then the pullback to $1.972 in March 2020 earlier this year ended wave II or B. The metal has since rallied higher within wave III. The rally from March 2020 low also looks impulsive and soon should end wave ((1)). Afterwards, it should pullback in wave ((2)) to correct the rally from March low in 3, 7, or 11 swing before the rally resumes.
 

Elliottwave-Forecast

Master Trader
Feb 17, 2017
2,452
9
84
www.elliottwave-forecast.com
Workhorse has had a great 2020 off the March low. With the stock price running from 1.31 to a high of 22.90, the momentum has been strong. They are a zero emissions vehicle manufacturer, using hydrogen cell technology. Lets take a look at the company profile below:

“Workhorse Group Incorporated is an American manufacturing company based in Cincinnati, Ohio, currently focused on manufacturing electrically powered delivery and utility vehicles.

The company was founded in 1998 by investors who took over the production of General Motors' P30/P32 series stepvan and motorhome chassis. By 2005, they were taken over by Navistar International, which had been selling them diesel engines. Navistar then shuttered the plant in 2012 to cut costs after having suffered heavy losses.

In March 2015, AMP Electric Vehicles took over Workhorse Custom Chassis. Changing the company name to Workhorse Group Incorporated, and began offering a range of electrically powered delivery vans.”


The chart is acting fairly clean, lets take a look at the Daily View below.

Workhorse Daily Elliottwave View:
Workhorse

Looking at a Medium term term view from the March lows where Wave ((2)) bottomed at 1.31. After that low took place, the chart shows an incomplete bullish sequence. Wave ((1)) and ((2)) are set, with ((3)) recently peaked in July and ((4)) looking to move lower, before heading higher.

From the March low where ((2)) is set, a very impulsive rally took place. Blue (1) topped on May 5/20 @ 3.43, blue (2) bottomed on May 14/20 @ 2.27. After that, price exploded to the upside with Blue (3) topping at 20.00 on June 30/20, and (4) bottoming at 13.65 July 1/20. From there, wave (5) of ((3)) was set on July 2/20 at 22.90 all time high. After that, wave ((4)) is currently underway taking shape as a double correction structure.

An equal leg extreme blue box at 10.05 is an area where buyers may enter for a bounce in 3 waves at least. This is where ((4)) is currently forecast to complete.

In conclusion, Workhorse is favoured to advance higher in a ((5)) of Red I before a larger degree correction can take place. Considering the incomplete bullish sequence, one more high at least, is favoured to take place to complete the bullish structure.
 

Elliottwave-Forecast

Master Trader
Feb 17, 2017
2,452
9
84
www.elliottwave-forecast.com
Rio Tinto Group is the world's second largest metals and mining corporation which has its headquarters in London and Melbourne. Founded in 1873 and traded under tickers $RIO at LSE, ASE and also in US in form of ADRs, it is a component of both the FTSE100 and ASX200 indices. In terms of operations, Rio Tinto is producing iron ore, copper, diamonds, gold and uranium. Besides its primary role as a minerals' extractor, the company is active significantly in refining of bauxite and iron ore. Currently, commodities are turning up. Therefore, mining companies in general become a good choice within the spectrum of investment opportunities. Hereby, Rio Tinto Group as a well established corporation and a market leader should be included without any doubt in every investor's portfolio.

Rio Tinto Monthly Elliott Wave Analysis 08.13.2020
The monthly chart below shows the Rio Tinto stock $RIO at ASE. From the all-time lows, the stock price has developed a cycle higher in wave (I) of a super cycle degree. Hereby, Rio Tinto has printed the all-time highs on May 2008 at 124.19. The cycle up is an impulsive move; it shows 5 subwaves of a cycle degree and an extension within the wave III. From the 2008 highs, a correction lower has unfolded as a straightdown decline in the blue wave (II). It has ended correcting the previous grand super cycle by printing an important bottom in December 2008 at 23.57.

From the 2008 lows at 23.57, a new cycle in wave (III) has most probably started. Breaking above 124.19 would confirm another extension higher. In shorter cycles, the advance towards February 2011 highs at 89.04 can be seen as a leading diagonal in a red wave I. Thereafter, decline lower towards February 2016 lows at 36.15 is a double three in a red wave II of a cycle degree.

Rio Elliott Wave Monthly

Rio Tinto Weekly Elliott Wave Analysis 08.13.2020
The weekly chart below shows the $RIO shares price action in more detail. From the February 2016 lows at 36.15, the stock price has advanced and broken 89.04 highs confirming that the wave III is in progress. In particular, Rio Tinto has developed a cycle higher in wave ((1)) towards May 2019 highs at 107.94. From the highs, a correction lower has unfolded as an expanded flat structure in wave ((2)) towards March 2020 lows at 72.69.

From the lows, wave ((3)) of III may be already in progress. Ideally, the price should break 107.94 to confirm that. Otherwise, one can not outrule a double correction lower in wave ((2)).

Rio Elliott Wave Weekly

Rio Tinto Daily Elliott Wave Analysis 08.13.2020
The daily view demonstrates the advance from the March lows in wave (1) of ((3)). Obviously, it is showing 5 waves up. There is a separation within wave ((iii)) of 3 which qualifies the wave (1) as an impulse. It also supports the bullish view. Currently, the stock price has broken the RSI trendline lower. Therefore, the cycle higher in wave (1) might be finished and a correction lower in wave (2) should find support in 3, 7 or 11 swings above March lows at 72.69.

Then, an extension higher in wave (3) of ((3)) to new highs should follow or $RIO should produce another leg higher at least. Based on the length of the wave (1), the price target to the upside will be 144.40-188.70. Consequently, the wave (3) can extend towards that area and even beyond.

Rio Elliott Wave Daily
 

Elliottwave-Forecast

Master Trader
Feb 17, 2017
2,452
9
84
www.elliottwave-forecast.com
The chart below of the USDCAD pair was posted on social media StockTwits/Twitter @AidanFX July 21 2020 showing that a bearish market pattern (light blue descending triangle) formed and triggered SELLS when price broke below the triangle. A bearish Head and Shoulders (purple) pattern also signalled sellers to enter on the breakout below the neckline which was also the same bottom trend line of the triangle pattern. Bearish divergence pattern (pink) formed in June 2020 and was clearly visible which signalled traders to look for possible selling opportunities.

I called for traders to SELL USDCAD and only a move above the triangle pattern and above the top of the right shoulder of the H&S pattern would invalidate the SELL trade setup. Stop loss was set above the right shoulder of the H&S pattern targeting the green 1:1 RR and 1:2 RR targets.

USDCAD 4 Hour Chart July 21.2020

USDCAD, forex, trading, market patterns, elliottwave, @AidanFX, AidanFX

USDCAD 4 Hour Chart August 13.2020

USDCAD, forex, trading, market patterns, elliottwave, @AidanFX, AidanFX

USDCAD continues lower and on August 13 2020 price reaches the 1:2 RR target at 1.3193 from 1.3493 1st entry for +300 pips. The 2nd SELL entry (dark blue) was tweeted August 6.2020 and also hit the 1:2 RR target at 1.3195 from 1.3345 entry for +150 pips. If you followed me on Twitter/Stocktwits @AidanFX you too could have caught the USDCAD move lower.

USDCAD, forex, trading, market patterns, elliottwave, @AidanFX, AidanFX

Of course, like any strategy/technique, there will be times when the strategy/technique fails so proper money/risk management should always be used on every trade. Hope you enjoyed this article and follow me on Twitter for updates and questions> @AidanFX or chat me on Skype > EWF Aidan Chan

At Elliottwave-Forecast we cover 78 instruments (Forex, Commodities, Indices, Stocks and ETFs) in 4 different time frames and we offer 3 Live Session Webinars everyday. We do Daily Technical Videos, Elliott Wave Trade Setup Videos and we have a 24 Chat Room. Our clients are always in the loop for the next market move.
 

Elliottwave-Forecast

Master Trader
Feb 17, 2017
2,452
9
84
www.elliottwave-forecast.com
Hello fellow traders. In this technical blog we’re going to take a quick look at the Elliott Wave charts of DAX, published in members area of the website. As our members know, we’ve been calling rally in DAX within the cycle from the March low. Recently DAX made pull back that has unfolded as Elliott Wave Zig Zag pattern . In the further text we are going to explain the Elliott Wave Pattern and the Forecast.

Before we take a look at the real market example, let’s explain Elliott Wave Zigzag.

Elliott Wave Zigzag is the most popular corrective pattern in Elliott Wave theory . It’s made of 3 swings which have 5-3-5 inner structure. Inner swings are labeled as A,B,C where A =5 waves, B=3 waves and C=5 waves. That means A and C can be either impulsive waves or diagonals. (Leading Diagonal in case of wave A or Ending in case of wave C) . Waves A and C must meet all conditions of being 5 wave structure, such as: having RSI divergency between wave subdivisions, ideal Fibonacci extensions and ideal retracements.

DAX

DAX 1 Hour Elliott Wave Analysis 7.29.2020
The index is currently giving us pull back that can be unfolding as Elliott Wave Zig Zag. We got 5 waves down from the 13311.2 peak, which is labeled as first leg A red. Then we got 3 waves bounce in shallow B red recovery and break toward new lows again. Now we should be ideally doing C red leg. Correction still looks incomplete at the moment, suggesting we can get more short term weakness before rally takes place again.

DAX

DAX 1 Hour Elliott Wave Analysis 7.30.2020
Pull back looks incomplete at the moment. As far as the price holds B red pivot 1297.4 ,we expect to see 5 waves down n ((c)) leg , ideally toward 12427.6-12113.9 ( buyers area) . At that area we expect buyers to appear for proposed rally or 3 waves bounce at least. As our members know, Blue Boxes are no enemy areas , giving us 85% chance to get a bounce.

You can learn more about Zig Zag Elliott Wave Patterns at our Free Elliott Wave Educational Web Page.

DAX

DAX 1 Hour Elliott Wave Analysis 8.4.2020
DAX found buyers right at the 12427.6-12113.9 ( Blue Box area). Pull back ended at the 12245.06 low. As far as that pivot holds, we would like to see further separation higher. We don't recommend selling and favor the long side from the blue box. As the bounce has already reached 50 fibs against the middle pivot - (B) blue, members who took long positions should be risk free.

Keep in mind market is dynamic and presented view could have changed in the mean time. You can check most recent charts in the membership area of the site. Best instruments to trade are those having incomplete bullish or bearish swings sequences.We put them in Sequence Report and best among them are shown in the Live Trading Room.

DAX

Elliott Wave Forecast
 

Elliottwave-Forecast

Master Trader
Feb 17, 2017
2,452
9
84
www.elliottwave-forecast.com
Since the corona virus hit in March earlier this year, price of Sugar future (SB) has remained depressed as demands projected to plummet. Prices fell sharply lower at 42% to 9.2 cents per pound in April. Over the past few weeks however, prices have made impressive returns due to drought in Thailand and weaker U.S dollar.

Since last month, the U.S Dollar continues to weaken against major currencies. In fact, in the month of July, the U.S. Dollar had the biggest decline in a decade. Weak US Dollar supports Sugar prices as Sugar future trades on the Intercontinental Exchange in US Dollar. As Brazil is the leading producer of this commodity and the local production costs are in Brazilian real, the currency exchange rate between the Real and US Dollar tends to impact the prices of the commodity.

From the supply side, the latest drought in Thailand is projected to limit the supply of sugar raws. Furthermore, Brazil has become the second-leading country with the highest number of coronavirus and fatalities. Thus, the pandemic may significantly affect the production and logistics of the commodity in the coming months. Market is in the process of finding a new equilibrium with lower demand and supply at the same time.

The central bank stimulus can also potentially spark the rally in commodity asset classes. During the 2008 global financial crisis, quantitative easings have been a boon to the commodities sectors. In 2020, far higher stimulus levels from central banks and government may do the same thing.

Sugar Daily Elliott Wave Chart


A possible Elliott Wave scenario above suggests the rally from April 28 low is unfolding as a double zigzag Elliott Wave structure. In this scenario, Sugar prices has a target higher towards 14.4 - 15.1 area to complete the sequence from April 28 low. This view is valid as long as wave (X) low pivot at 11.27 remains intact. A more bullish scenario however is possible where the rally from April 28 low is unfolding as an impulse. A more bullish scenario can be considered if Sugar breaks and closes above 2011 bearish trend line shown below

Sugar Weekly Chart
Sugar daily Elliott Wave chart

Weekly chart above shows that Sugar has traded in what looks to be a wedge from February 2011 high. If Sugar future can close above the descending trend line from Feb 2011 high, a more bullish scenario can be considered where Sugar has started to do bigger move to the upside. The rally from April 29 Covid-19 low in this case can unfold as an impulse.
 

Elliottwave-Forecast

Master Trader
Feb 17, 2017
2,452
9
84
www.elliottwave-forecast.com
GDX 45 minutes chart below shows that the stock has ended the cycle from June 5 low as wave (3). The rally ended at 45.78 high. From there, the stock did a pullback in wave (4), which unfolded as a zigzag Elliott Wave Structure. Down from August 5 high, wave A ended at 42.25 low. The bounce in wave B ended at 44.18 high. Afterwards, the stock resumed lower in wave C, which ended at 38.82 low. This ended wave (4) in larger degree.

Afterwards, the stock has resumed higher from wave (4) low. Up from that low, the stock ended wave ((i)) at 40.69 high. Wave ((ii)) pullback ended at 39.05 low. Currently wave ((iii)) is in progress, where wave (i) of ((iii)) ended at 41.03 high and wave (ii) ended at 39.72 low. As long as pivot at 38.82 low stays intact, the dips in 3,7 or 11 swings is expected to find support for more upside. However, the stock still needs to break above wave (3) high at 45.78 to confirm that wave (4) is already in place and the next leg higher in wave (5) has started. Otherwise, the stock can still do a double correction in wave (4).

GDX 45 Minutes Elliott Wave Chart
GDX 8.18.2020 Post Market
 

Elliottwave-Forecast

Master Trader
Feb 17, 2017
2,452
9
84
www.elliottwave-forecast.com
In this blog, we are going to take a look at the Elliott Wave chart of ZS_F (Soybean Futures). The 4 hour chart update from August 9 shows that Soybean has ended the cycle from April 21 low as wave A at 910 high. The sub-waves of the rally unfolded as 5 waves impulsive structure. Elliott Wave theory dictates that 3 waves pullback should happen afterwards before the rally continues. Soybean then did a pullback in wave B, which unfolded as a zigzag correction. Down from wave A high, wave ((a)) ended at 884.2 low. The bounce in wave ((b)) ended at 896.2 high. The commodity then declined lower in wave ((c)). The pullback reached the 100-161.8% extension of wave ((a))-((b)). That area is highlighted with a blue box. As long as 161.8% extension stays intact, soybean is expected to see 3 waves bounce at least or resume the rally higher from blue box.

ZS_F 8.9.2020 4 Hour Elliott Wave Chart
ZS_F 8.9.2020 4H Update

The 4 hour chart update from August 17 shows that soybean ended wave ((c)) at 863.2 low. This also ended wave B in higher degree. From there, the commodity has extended higher. The rally from blue box has broken above previous wave A high, confirming that wave B is in place and the next leg higher in wave C is already in progress.

ZS_F 8.17.2020 4 Hour Elliott Wave Chart
ZS_F 8.17.2020 4 Hour

Since it has broken the previous wave A high, Soybean now is showing an incomplete sequence to the upside. The 100-123.6% extension of wave A-B where C can potentially end is between 963-999.4 area. As long as wave B low at 863.2 stays intact, expect dips in 3,7, or 11 swings to find support for more upside later targeting the blue box area.

ZS_F 8.18.2020 Daily Elliott Wave Chart
ZS_F 8.18.2020 Daily
 

Elliottwave-Forecast

Master Trader
Feb 17, 2017
2,452
9
84
www.elliottwave-forecast.com
The Bovespa Index Long Term Cycles and Bullish Trend

The Bovespa Index has been trending higher with other world indices. Since inception the cycles have shown a bullish trend. In early years not seen on this chart it rallied with other world indices trending higher into the May 2008 highs. It then corrected the whole bullish cycle from the beginning. That was while most other world indices were in a pullback lower. The index ended that larger degree correction in October 2008. At this point is where the index corrected the whole decades long bullish cycle. Thus the October 2008 lows is from where this bullish cycle and swing analysis will begin.

First from the October 2008 lows the index rose into the November 2010 highs in what appears as an impulse. From there the index endured an almost 6 year long correction of that cycle into the January 2016 lows. That pullback can be counted in Elliott Wave several different ways but is irrelevant because since has made new highs.

The analysis continues below the chart.


Secondly I want mention the blue box area that was reached in the cycle up into the January 2020 highs. This is Fibonacci extension measured from zero up to the May 2008 highs then back down to the October 2008 lows. This is a typical place for the next cycle higher in any degree to reach as it did in January 2020.

Thirdly and in conclusion. The pullback into the March 2020 lows was enough to suggest it was correcting the cycle from the 2008 lows. This was shared by other world indices and some have already made new yearly highs in their bullish cycles. This one should be no different and eventually will get back above the January 2020 highs. From the March 2020 lows the index appears to be an impulse when looked at in the lower time frames. The index should see another high in the 108000-109000 area at a minimum before it corrects the cycle up from the March 2020 lows. This is pretty much in line with other world indices. There should be a bullish outcome in the index while above the March 2020 lows.
 

Elliottwave-Forecast

Master Trader
Feb 17, 2017
2,452
9
84
www.elliottwave-forecast.com
The Corona Virus has provided some amazing opportunities for certain sectors. Cloud computing is one of those sectors that have vastly outperformed the marketplace since the March 2020 low. Fastly Inc is in the cloud computing business and has been on a tear since the all time lows that were printed in March 2020. Lets take a look at what the company does:

“Fastly, Inc. is an American cloud computing services provider. Fastly's edge cloud platform provides a content delivery network, Internet security services, load balancing, and video & streaming services. Fastly's headquarters are in San Francisco, California, with additional offices in Denver, New York, Portland, London, and Tokyo.

Fastly describes their network as an edge cloud platform, which is designed to help developers extend their core cloud infrastructure to the edge of the network, closer to users. The Fastly edge cloud platform includes their content delivery network, image optimization, video & streaming, cloud security, and load balancing services.

Fastly's cloud security services include distributed denial of service (DDoS) attack protection, bot mitigation, and a web application firewall. Fastly web application firewall uses the OWASP ModSecurity Core Rule Set (CRS) alongside its own ruleset.”


FSLY is counting clean off the March 2020 all time low low, lets take a look at the 4H chart below.

Fastly 4H Elliott Wave View:
Fastly

Fastly has not been public that long, and doesn't have much historical data. It set an all time low in March 2020, and has rallied impulsively off that low.

Medium term term view from 3/16/2020 lows of 10.54. Wave ((1)) is set at 46.35 on 5/22/2020 and wave ((2)) at 36.03 on 4/27/2020. After that, an extended Black ((3)) took place, which topped on 7/09/2020 at 102.95. After that, Black ((4)) at 73.87 on 7/14/2020. From there, Black ((5)) of Red I is favoured peaked on 8/05/2020 at 117.79.

In conclusion, wave ((A)) of Red II is favoured set at the low 72.55 on 8/11/2020. A bounce up in ((B)) is now underway. However, there is no extreme area to measure from a ((B)) high since it is still ongoing. An area that Red II can form a low is the 50% to 61.8% retrace area of 64.28 to 51.60. After ((B)) is set, a more accurate equal leg measurement can be taken for where Red II may bottom.