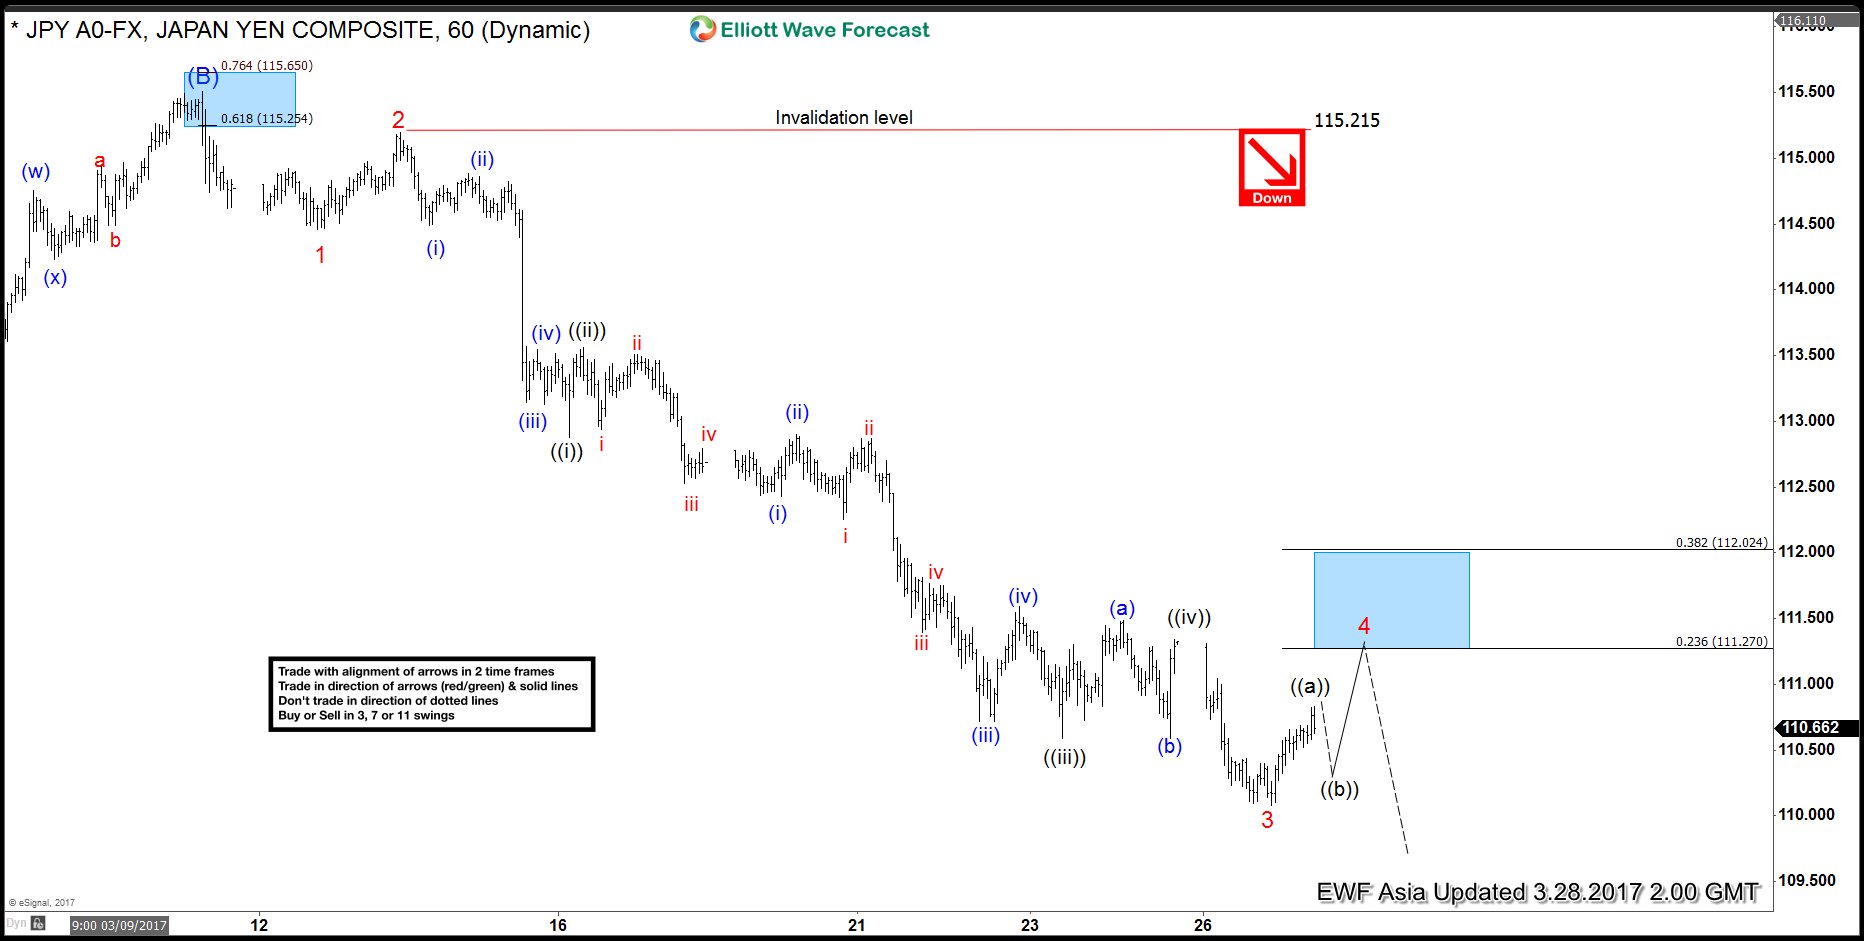
We are taking the more aggressive view in USDJPY and calling the rally to 115.48 on 3/10 as Intermediate wave (B). Decline from there is unfolding as a 5 waves impulse Elliott wave structure with an extension in wave 3. Down from 115.5, Minor wave 1 ended at 114.46 and Minor wave 2 ended at 115.2. Minor wave 3 is extended and further subdivided into 5 impulse waves where Minute wave ((i)) ended at 112.88, Minute wave ((ii)) ended at 113.56 and Minute wave ((iii)) ended at 110.59, Minute wave ((iv)) ended at 111.34, and Minute wave ((v)) of 3 is proposed complete at 110.077. Minor wave 4 bounce is currently in progress towards 111.27 – 112.02 area, which is 23.6 – 38.2 retracement of Minor wave 3, before further downside is seen to complete Minor wave 5 towards as low as 106.85 – 108.5 area. Bounce is expected to be limited and shallow.
If the current bounce gets too big, then as an alternate, the move lower in USDJPY from 115.5 high is unfolding as a zig zag Elliottwave structure where Minor wave A ended at 110.077 low with subdivision of 5 impulsive waves . In this alternative view, current bounce will then be bigger as it’s a Minor wave B bounce to correct decline from 3/10 high (115.52), but still as far as pivot at 115.2 stays intact, pair should resume lower again in Minor C. This alternate view is the less aggressive view but still calling for more downside in the pair as far as pair stays below 3/10 high. In both views (aggressive and less aggressive), we don’t like buying the pair.
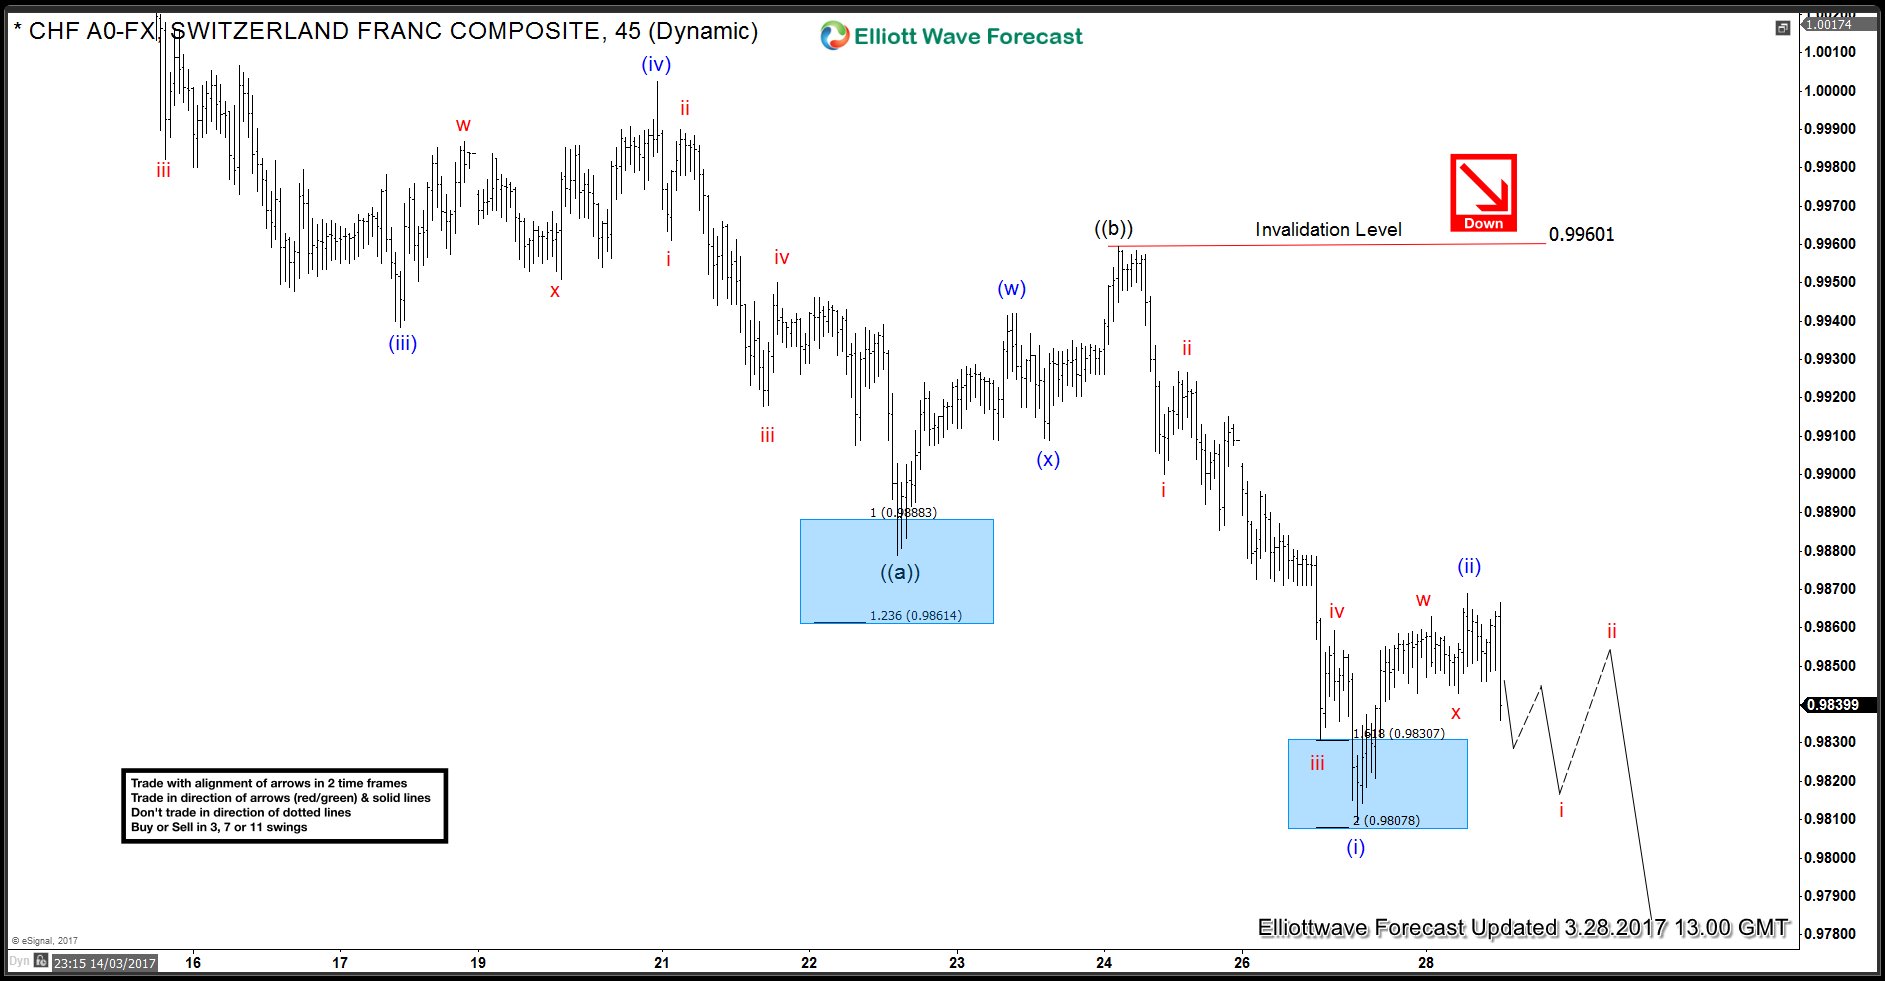
USDCHF decline from 3/7 (1.0170) high to 3/22 (0.9879) low could be viewed as a 5 swing move that we have labeled as Elliott wave ((a)). Bounce to 0.9960 was a three move and completed Elliott wave ((b)). Pair has since dropped to a new low below 0.9879 confirming the view that wave ((b)) ended at 0.9960. Decline from 0.9960 – 0.9809 was again in 5 swings and completed wave (i) of ((c)). Pair has already done 3 wave bounce to 0.9868 which could be all of wave (ii) and pair can now resume the decline in wave (iii). Pair doing small 5 waves from 0.9868 high will add conviction to this view but we would need to see a break below 0.9809 low to confirm wave (ii) ended at 0.9868 and wave (iii) of ((c)) lower is in progress. Until then, another push higher towards 0.9884 – 0.9901 area can’t be ruled out to complete wave (ii) as a double three w-x-y structure. In either case, as pair is showing an incomplete bearish sequence down from 3/7 (1.0170) high, we expect the bounces to fail below 0.9960 high for extension lower and in case of another push, expect the pair to find sellers in 0.9884 – 0.9901 area. This view remains valid as far as price stays below 0.9960 high. Ideal target for wave ((c)) lower to complete is in the region of 0.9684 – 0.9569 and we can see the pair turning higher from there in 3 waves at least.
USDCHF 1 Hour Elliott Wave chart – Wave (ii) completed
Pair showing small 5 waves from blue wave (ii) peak will add conviction to this view and a break below 0.9809 will confirm this idea.
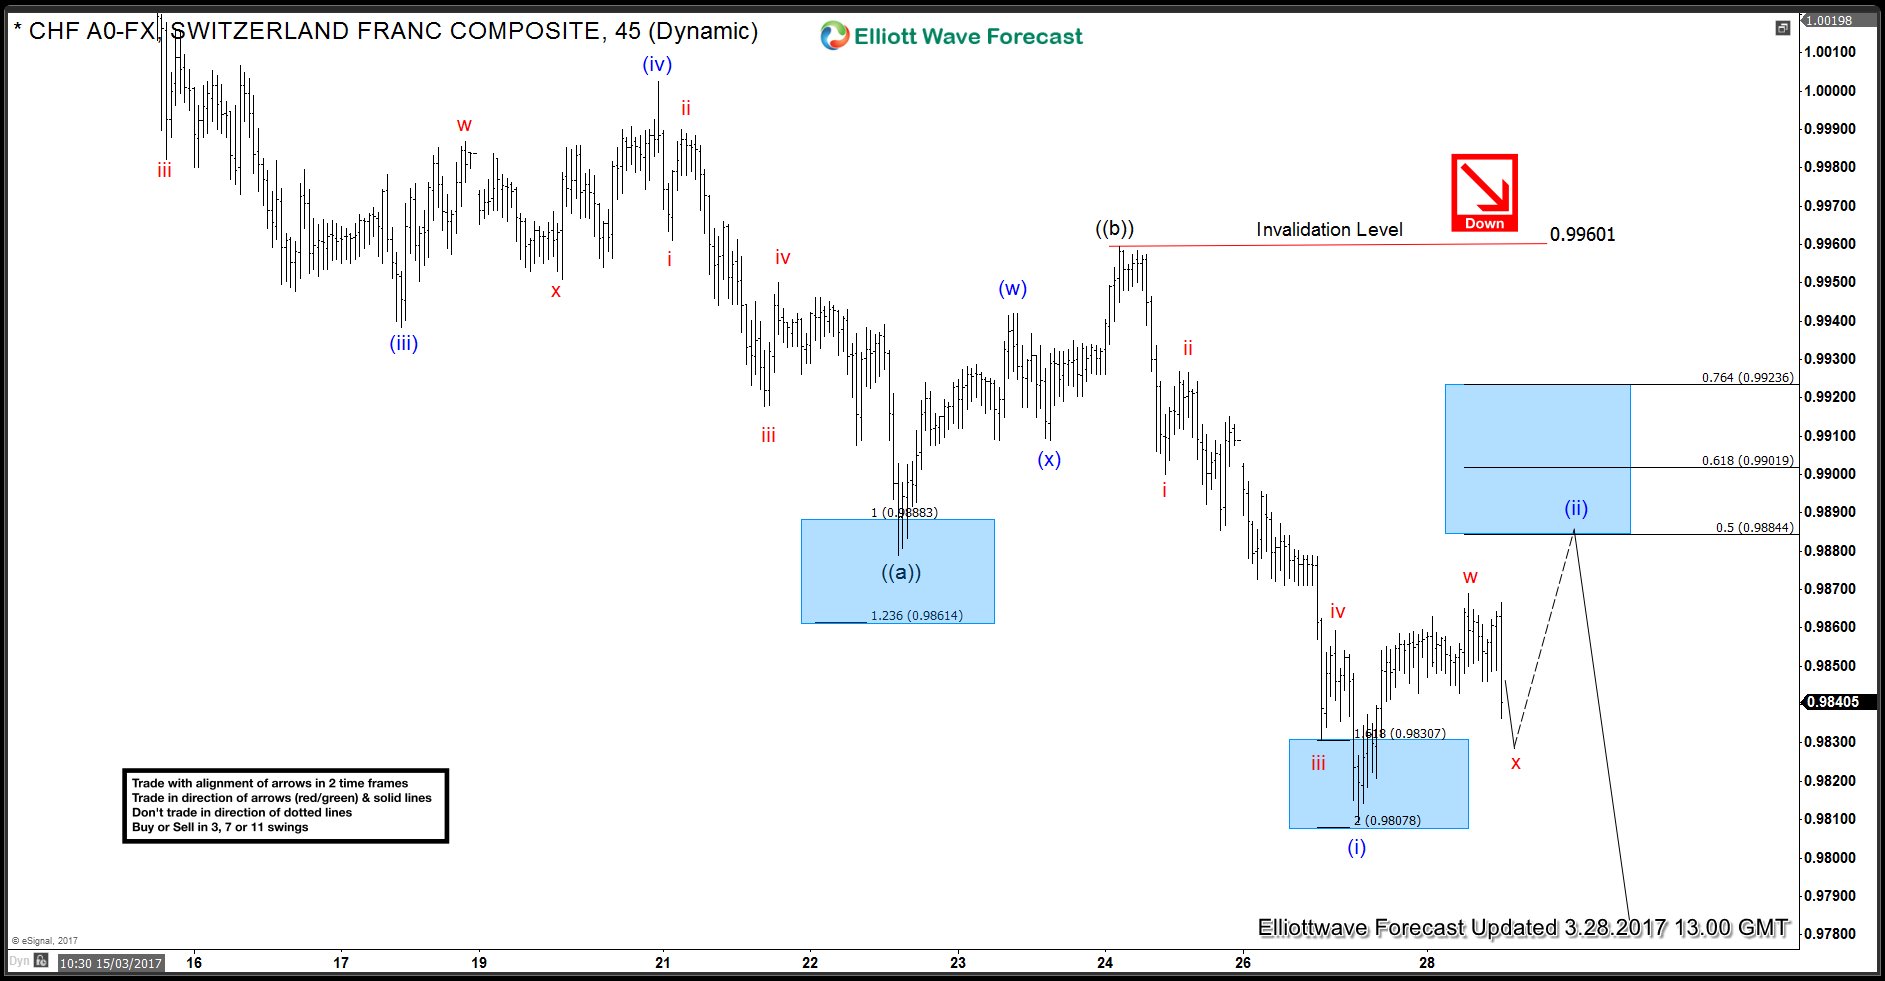
USDCHF 1 Hour Elliott Wave Chart – Wave (ii) in progress
Pair has already done 3 waves up from 0.9809 low and has minimum number of swings in place to call wave (ii) completed. However, while above 0.9809 low, another 3 swings higher and a test of 0.9884 – 0.9901 area can’t be ruled out to complete wave (ii) as a 7 swing structure before decline resumes. In either case, expect rallies to fail below 0.9960 high for extension lower in USDCHF.
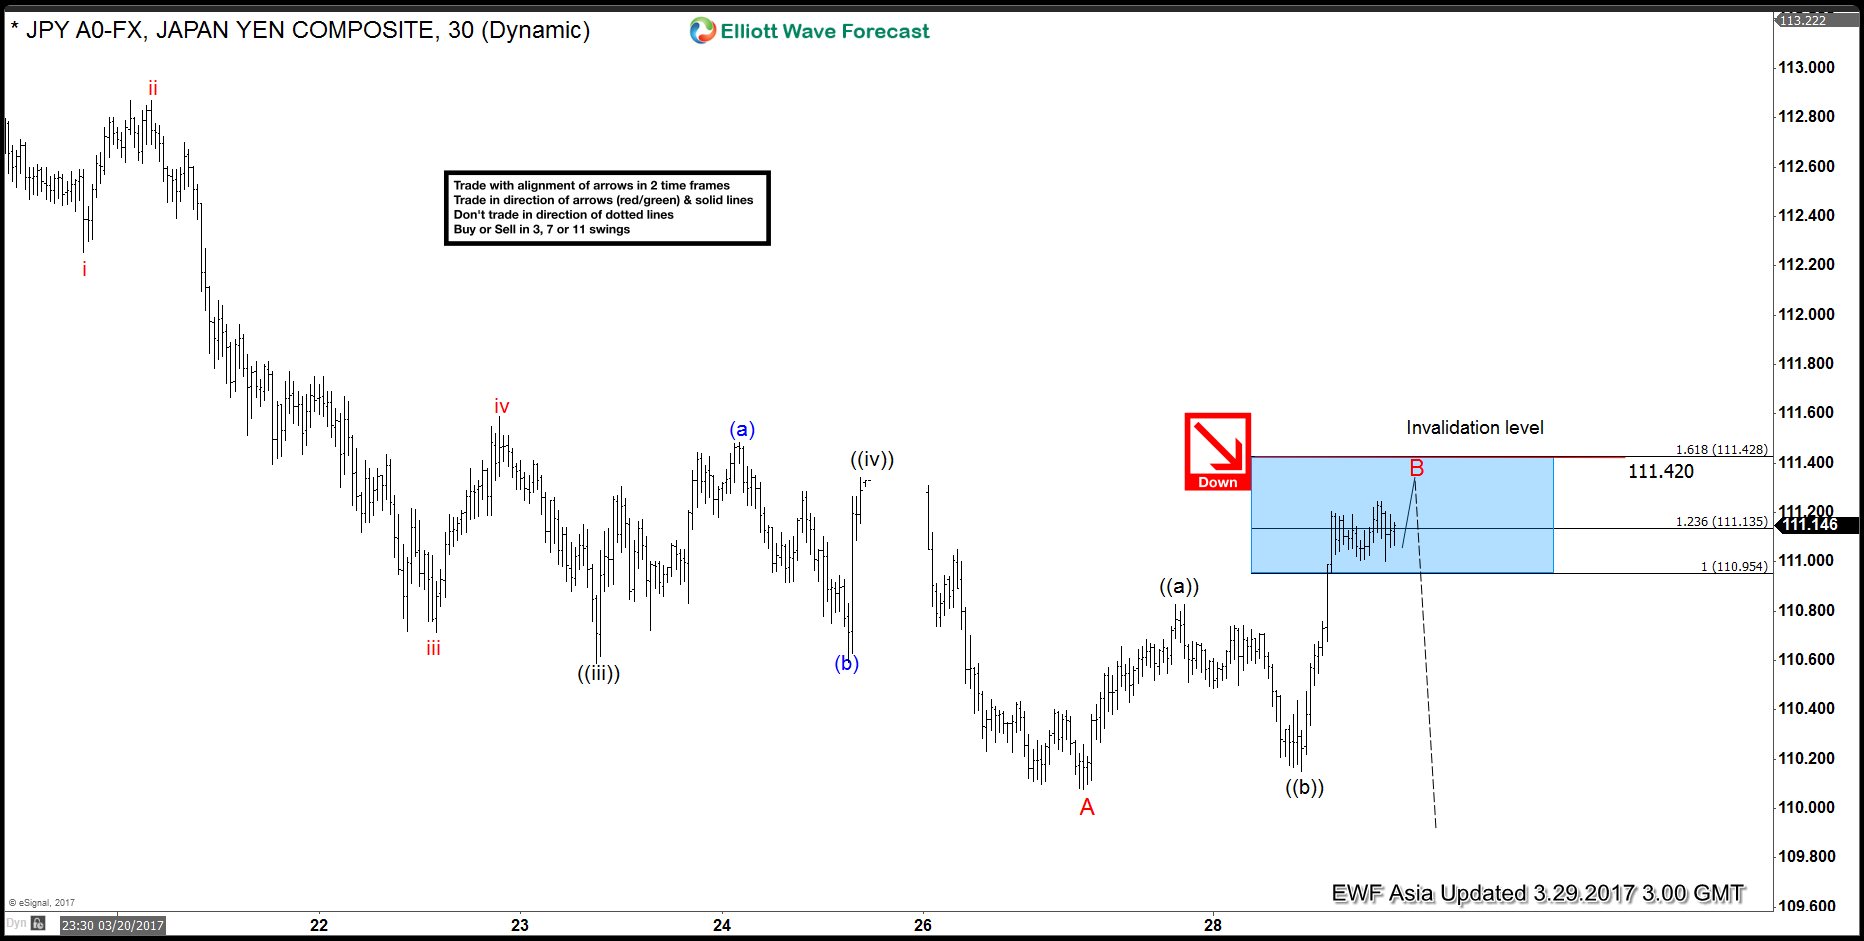
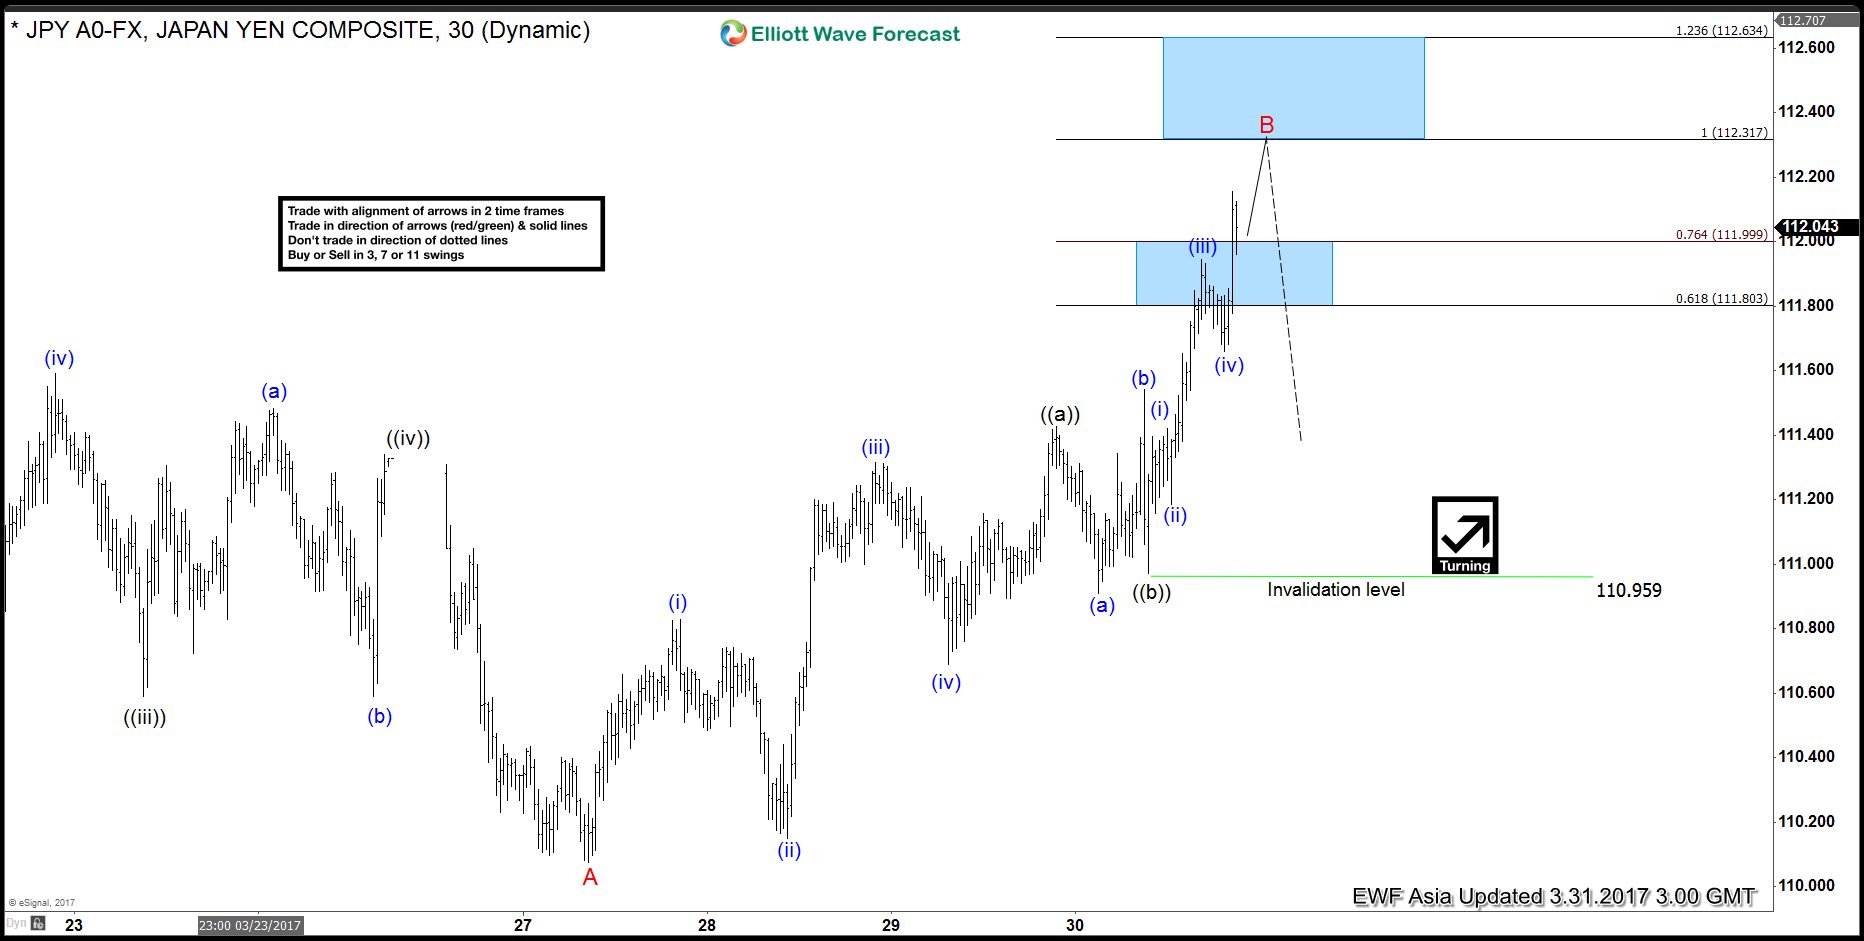
Short term Elliott Wave view in USDJPY suggests that cycle from 3/10 peak (115.53) has ended with Minor wave A at 110.07. Decline from 115.53 is unfolding as a 5 waves impulse Elliott wave structure with an extension where Minute wave ((i)) ended at 114.46, Minute wave ((ii)) ended at 115.19, Minute wave ((iii)) ended at 110.59, Minute wave ((iv)) ended at 111.34, and Minute wave ((v)) of A ended at 110.07. USDJPY ended cycle from 3/10 peak and correcting that cycle in wave B bounce in 3, 7, or 11 swing.
Wave B bounce is unfolding as an Expanded Flat Elliott wave structure where Minute wave ((a)) ended at 110.82 and Minute wave ((b)) ended at 110.15. Minute wave ((c)) of B ideally ends at 111.13 – 111.42 area or 1.236 – 1.618 extension of Minute ((a)) and ((b)) and from the area, pair should then either resume to a new low or at least pullback in 3 waves. However, due to the nature of an expanded Flat structure, wave C of a Flat can extend even beyond 1.618 extension. In other words, cycle from 3/27 low ideally ends at 111.13 – 111.42, but can also extend a bit higher and still considered to be part of the same Flat structure starting from 3/27 low. The more important invalidation level therefore is the pivot at 3/10 high (115.53) and wave B bounce should unfold in 3, 7, or 11 swing and the bounce is expected to stay below 115.53 for the next extension to the downside. We don’t like buying the pair.
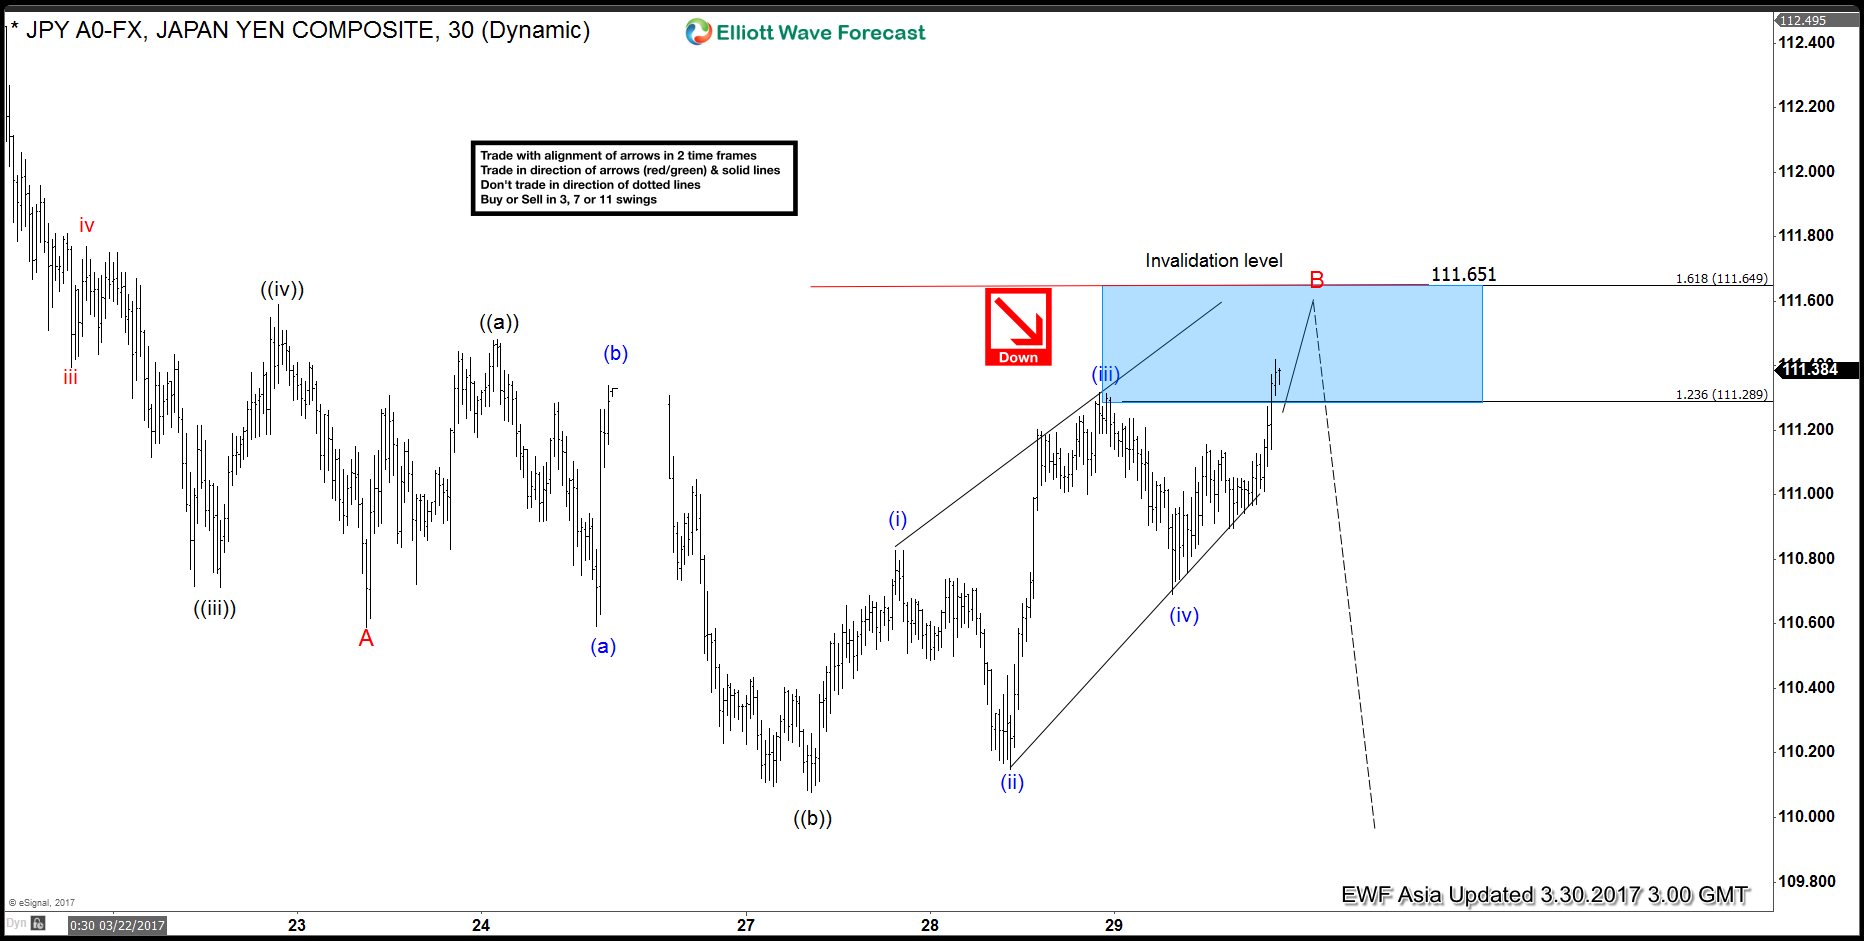
Short term Elliott Wave view in USDJPY suggests that cycle from 3/10 peak (115.53) has ended with Minor wave A at 110.589. Decline from 115.53 is unfolding as a 5 waves impulse Elliott wave structure with an extension where Minute wave ((i)) ended at 114.46, Minute wave ((ii)) ended at 115.19, Minute wave ((iii)) ended at 110.7, Minute wave ((iv)) ended at 111.59, and Minute wave ((v)) of A ended at 110.59. USDJPY ended cycle from 3/10 peak and correcting that cycle in wave B bounce in 3, 7, or 11 swing.
Wave B bounce is unfolding as an Expanded Flat Elliott wave structure where Minute wave ((a)) ended at 111.48 and Minute wave ((b)) ended at 110.077. Minute wave ((c)) of B ideally ends at 111.29 – 111.65 area or 1.236 – 1.618 extension of Minute ((a)) and ((b)) and from the area, pair should then either resume to a new low or at least pullback in 3 waves. However, due to the nature of an expanded Flat structure, wave C of a Flat can extend even beyond 1.618 extension. In other words, cycle from 3/27 low ideally ends at 111.29 – 111.65, but can also extend a bit higher and still considered to be part of the same Flat structure starting from 3/27 low. The more important invalidation level therefore is the pivot at 3/10 high (115.53) and wave B bounce should unfold in 3, 7, or 11 swing and the bounce is expected to stay below 115.53 for the next extension to the downside. We don’t like buying the pair.
Consol Energy (NYSE:CNX) is the largest producer of bituminous coal in the United States and the largest exporter of U.S. coal, It managed to survive through the major disruption in the financial markets because of its diversification strategy around natural gas and other services. Despite being one of the oldest company in the industry, originally created in 1860 as the Consolidation Coal Company , Consol Energy only went public in 1999 in order to pay down some of its debt and in 2010 it was named by Forbes magazine as one of the “100 Most Trustworthy Companies.”
In January last year, CNX price dropped to new all time lows before finding a bottom on 01/20/2016 then doing an amazing rally during the rest of the year to close for a total gain of +300% following the rise of Coal prices and outperforming the rest of commodities stocks. So let’s jump to the technical chart to analyse the current situation and see the potential path for company.
Consol Energy Elliott Wave Analysis
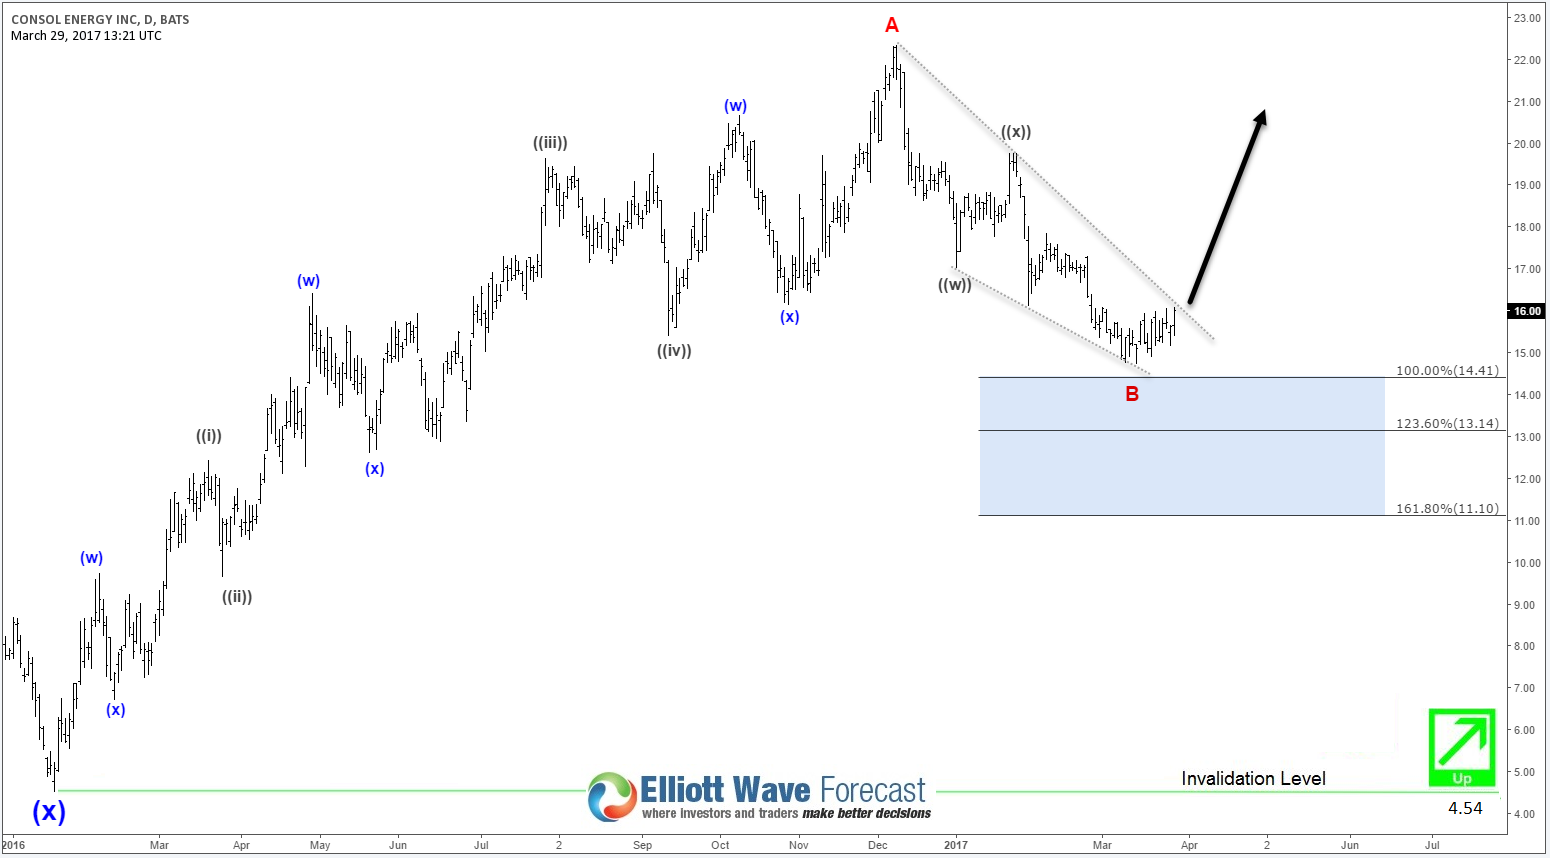
CNX has a bullish sequence from January 2016 low as it rallied in 5 waves forming a leading diagonal in wave A which ended on 12/08/2016. From there it started doing wave B pullback to correct that cycle in a double three Elliott wave structure which missed equal legs area $14.41 by few points.
The cycle from the peak is mature and have enough number of swings in place to call it completed , so with a break above the descending trend-line we can have a confirmation that wave B is already in place and the stock has resumed the move to the upside or there will be at least a 3 waves bounce.
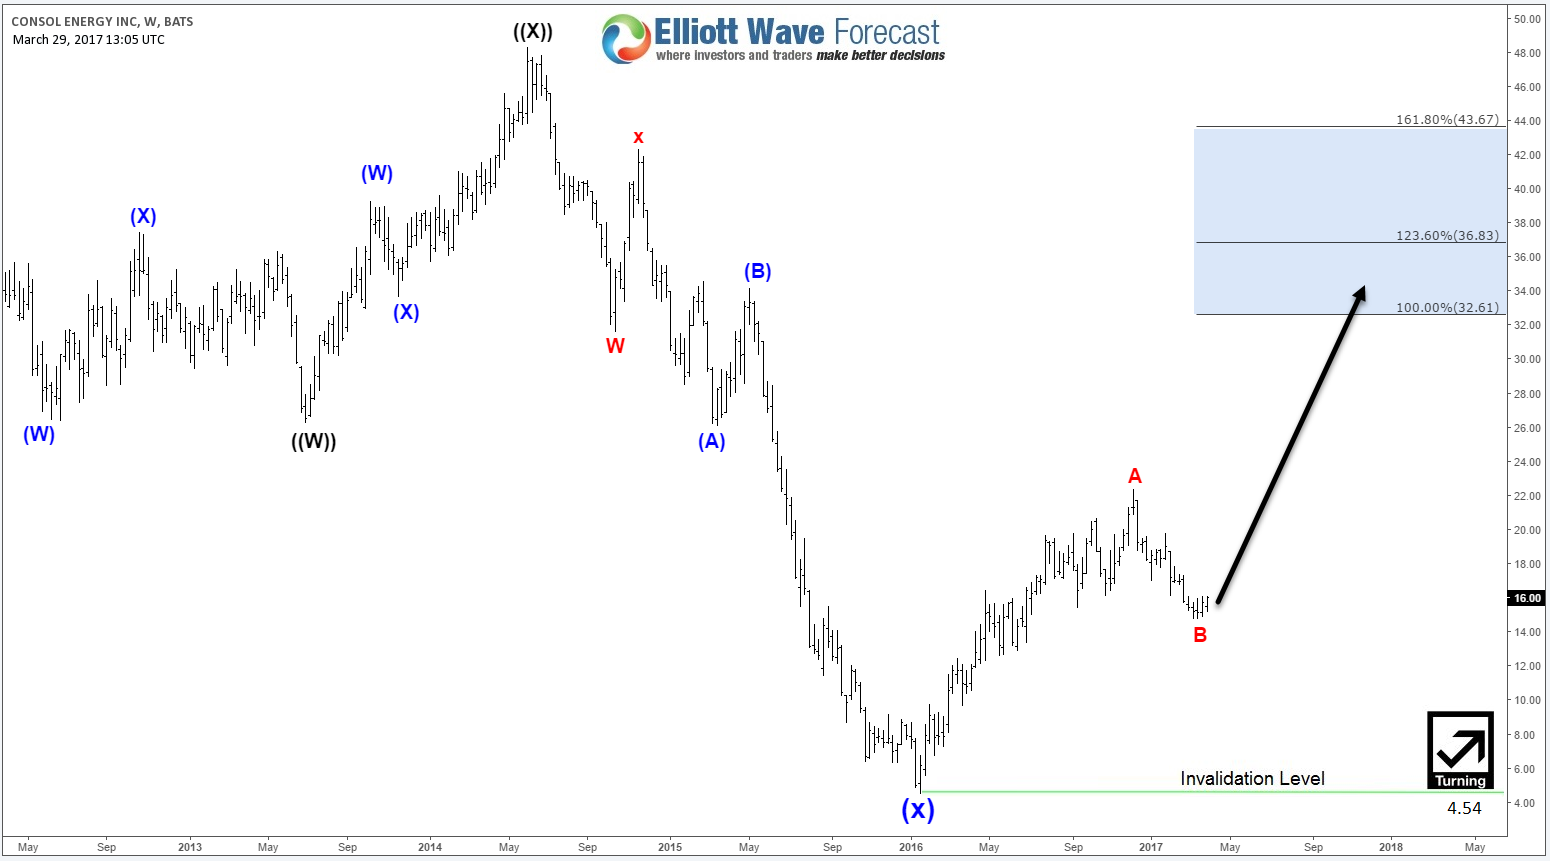
Zooming out to the weekly chart, Consol Energy is proposed to have ended a super cycle at $4.54 low and currently doing a larger 3 waves bounce which would ideally turn out to be the first leg of a new bullish cycle. The stock needs to break above December 2106 peak to resume the rally and open the extension higher toward equal legs $32.61 which will represent the first target area from the low.
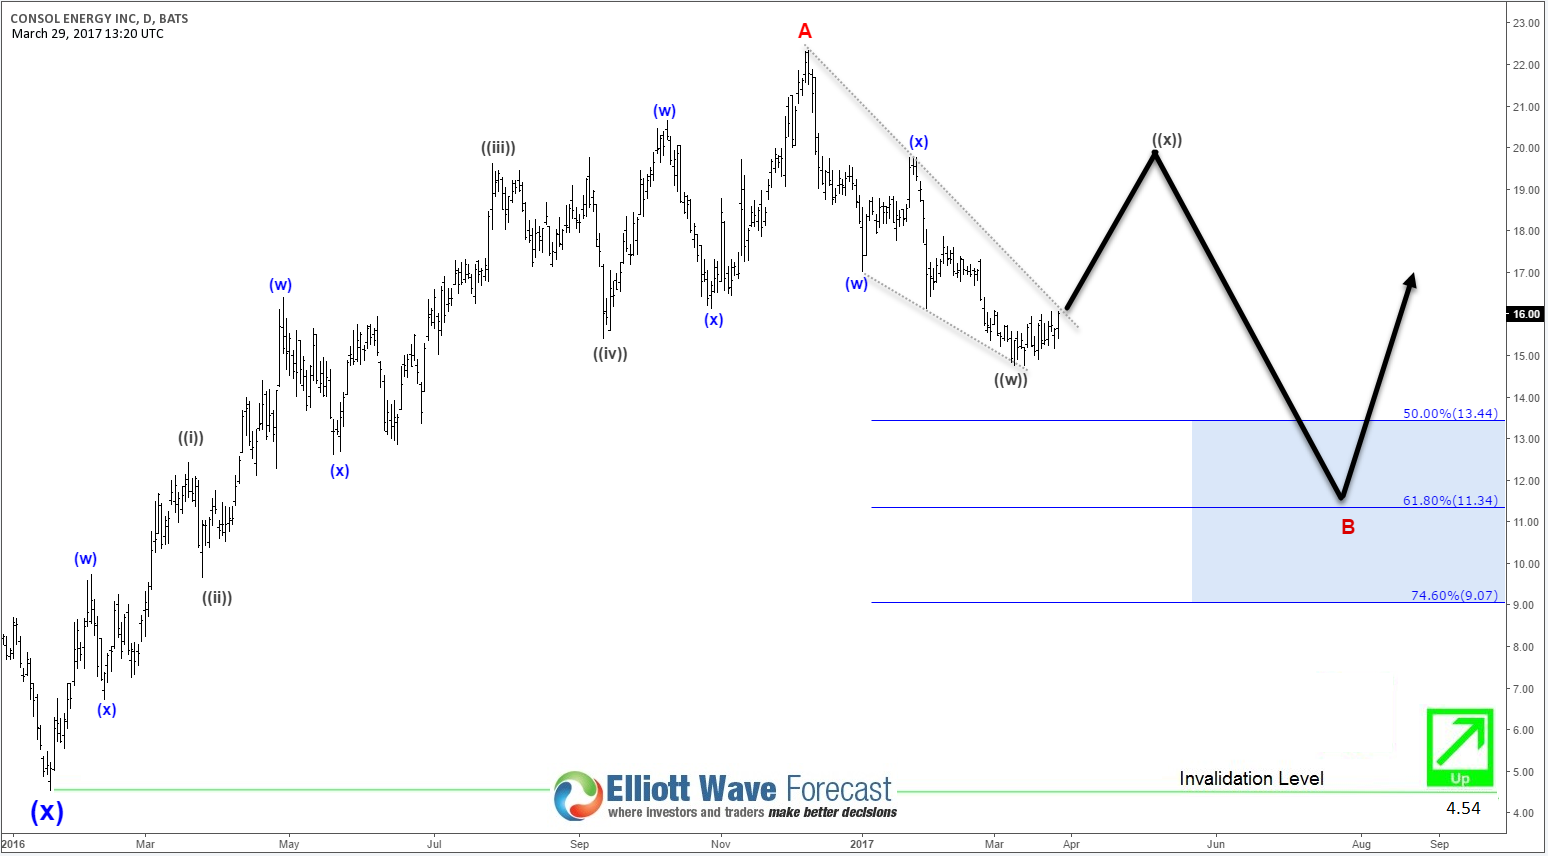
If CNX fails to break above $22.34 peak then it could be still correcting 2016 cycle and it will be looking to reach the 50%-61.8% Fibonacci retracement area at $13.44-$11.34 before the stock can resume the move higher as long as it keeps holding above $4.54 low.
Recap :
Consol Energy is one of the United States’s largest coal and natural gas companies that despite the falling of its stock price since the 2008 financial crises managed to pull it through. The company stock CNX have a technical bullish Elliott wave sequence calling for more upside if it manage to break above 2016 peak that’s why it would be a good idea to add it to the watch list for potential buying opportunities if not already long.
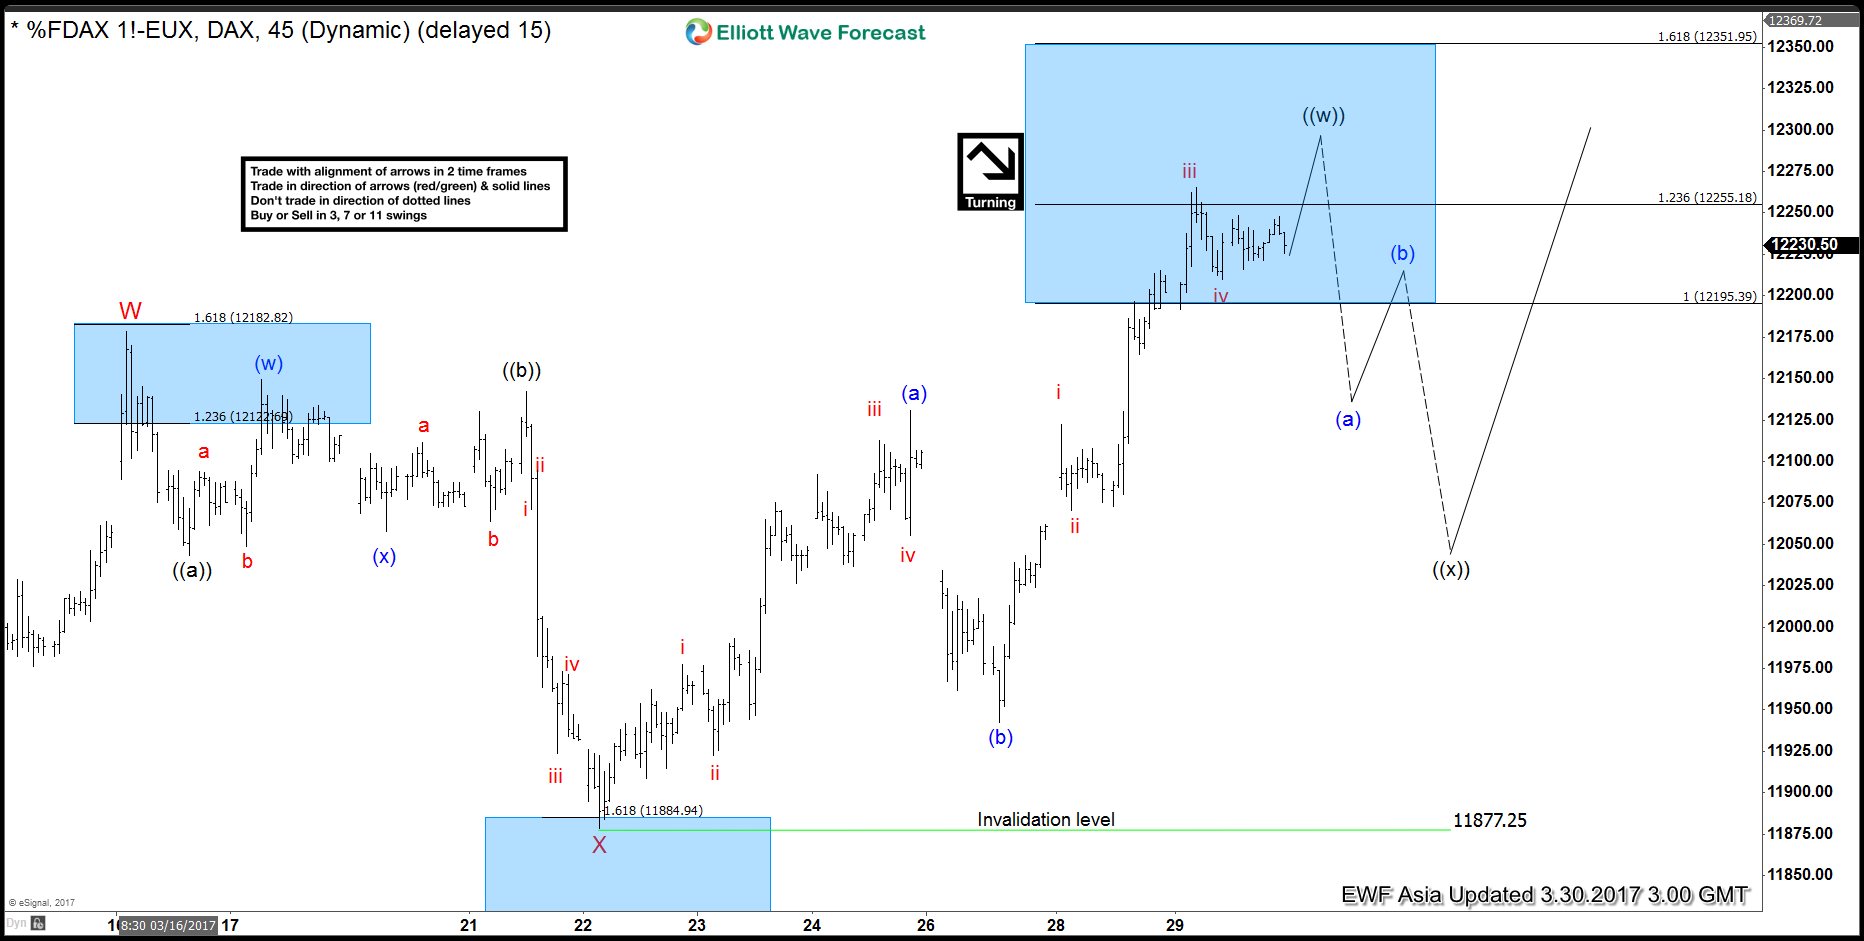
The move higher in DAX from 3/22 low is proposed to be unfolding as a zigzag Elliott Wave structure where the first leg Minutte wave (a) is subdivided in a 5 waves impulse Elliottwave structure and the third leg wave (c) is also subdivided into a 5 waves impulse Elliottwave structure. It’s not a good time to chase long in the Index at this stage as Index has reached short term inflection area where cycle from 3/22 low can end and a 3 waves pullback at minimum can be seen.
DAX Short term Elliott Wave Chart
Short term view of DAX suggests move from 3/22 low is unfolding as a zigzag Elliott Wave structure where Minutte wave (a) ended at 12130.5, Minutte wave (b) ended at 11942.5, and Minutte wave (c) of ((w)) is expected to complete at 12255 – 12351 area, which is the 1.236 – 1.618 extension area of Minutte wave (a) and (b). Expect the Index to pullback from this area in 3, 7, or 11 swing within Minute wave ((x)) pullback before the rally resumes to a new high. Chasing long in the Index is not a good idea at this stage as pair has reached the 100% area in 3 swing.
There are two other possible scenario with DAX. Another scenario is the move from 3/22 low is unfolding as an Impulse Elliott wave structure instead of a zigzag. This scenario can happen if the current move higher gets extended to 1.618 extension (12251). In this case, we can label the move to 12130.5 as Minutte wave (i), the pullback to 11942.5 can be labelled as Minutte wave (ii) and the move higher to 12251 (at least) can be counted as Minutte wave (iii). In an impulse scenario, the Index should pullback in Minutte wave (iv) then extend higher again one more leg before finishing Minutte wave (v) and ending cycle from 3/22 low.
The other scenario is the more bearish one which is an Expanded Flat Elliott wave structure starting from 3/16 high. In this scenario, the move lower to 11877.25 on 3/22 low is labelled as Minute ((a)) and the current move higher in 3 waves will end Minute ((b)). If Expanded Flat is in play, then once current rally ends in Minutte wave ((b)), we can see a strong selloff in wave ((c)) which should be subdivided into 5 waves internally and could go below 11877.25.
As the Index continues to make new high, there’s little reason for us to anticipate a Flat against a bullish background. The key takeaway is
We don’t like selling the Index as the move higher from 3/22 can get extended into an impulse structure rather than a zigzag
Chasing long here is risky because Index has reached the 100% area in which if the move higher from 3/22 is unfolding as a zigzag, a correction in 3 waves minimum can be seen soon
Traders who intend to buy DAX therefore needs to wait for a 3 waves pullback before looking for an opportunity to join the longside.
Although the Fed is in the rate hike cycle, USD rally started to lose momentum early this year when market started to realize that monetary policy divergence started to narrow. ECB has started to talk about rate hikes, while China started to tighten monetary policy by raising money market rates early last month. The Fed also sounded less hawkish in their last rate hike as they forecasted only three rate hikes this year and no Fed members agreed to hike rate four times.
US Dollar long bets continued to be paired down after the Republican withdrew the bill on the American Health Care Act (AHCA) last Friday when it became clear that they did not have the minimum 215 votes to make it pass. The AHCA was advocated by Trump and supposed to be the replacement for Obama’s Affordable Care Act (Obamacare). Trump’s opposition from his own party has cast doubt to his ability to deliver on other priorities and also his plan to reduce $350 billion in the coming 10 years.
In the past year, Trump’s campaign promise including tax reforms, infrastructure spending, and border-adjusted tax system has generated inflation and growth bets, dubbed as “Trump trade”, and these are supportive factors for the U.S Dollar. AHCA is the first litmus test on Trump’s ability to fulfill his promise and the failure of to pass this proposal could presage the next item on the agenda.
With the original supportive factors for US Dollar not realized in the short term and the Fed not hawkish enough, US Dollar may stay soft in the short term. These are the cited reasons for the recent U.S. Dollar weakness, but does technical trading, specifically Elliott Wave, help to anticipate it?
Daily Chart Overlay of USD (DXY), USDJPY, and USDCHF 3.29.2017
A technical look at US Dollar Index (DXY) and two major USD Pairs (USDJPY and USDCHF) above suggest they show a 5 swing sequence from 12.15.2015 peak, favoring more downside. Please note that this is not the same with 5 waves impulse or diagonal, but this is a swing count (sequence) that we use at Elliottwave Forecast. Any bounce in USD pair now ideally stays below March 9 peak for another leg lower. Thus technical outlook suggests that US Dollar may stay soft in the near term.
The fifth swing in the chart above however is formed after the Fed’s meeting and also after the Republican decision to withdraw the healthcare bill. How about before the events? Through Elliott Wave, intermarket analysis, sequence and distribution analysis, we’ve been able to identify US Dollar weakness prior to the Fed’s rate decision and communicated to our members. Below is 1 hour chart prior to the Fed’s meeting
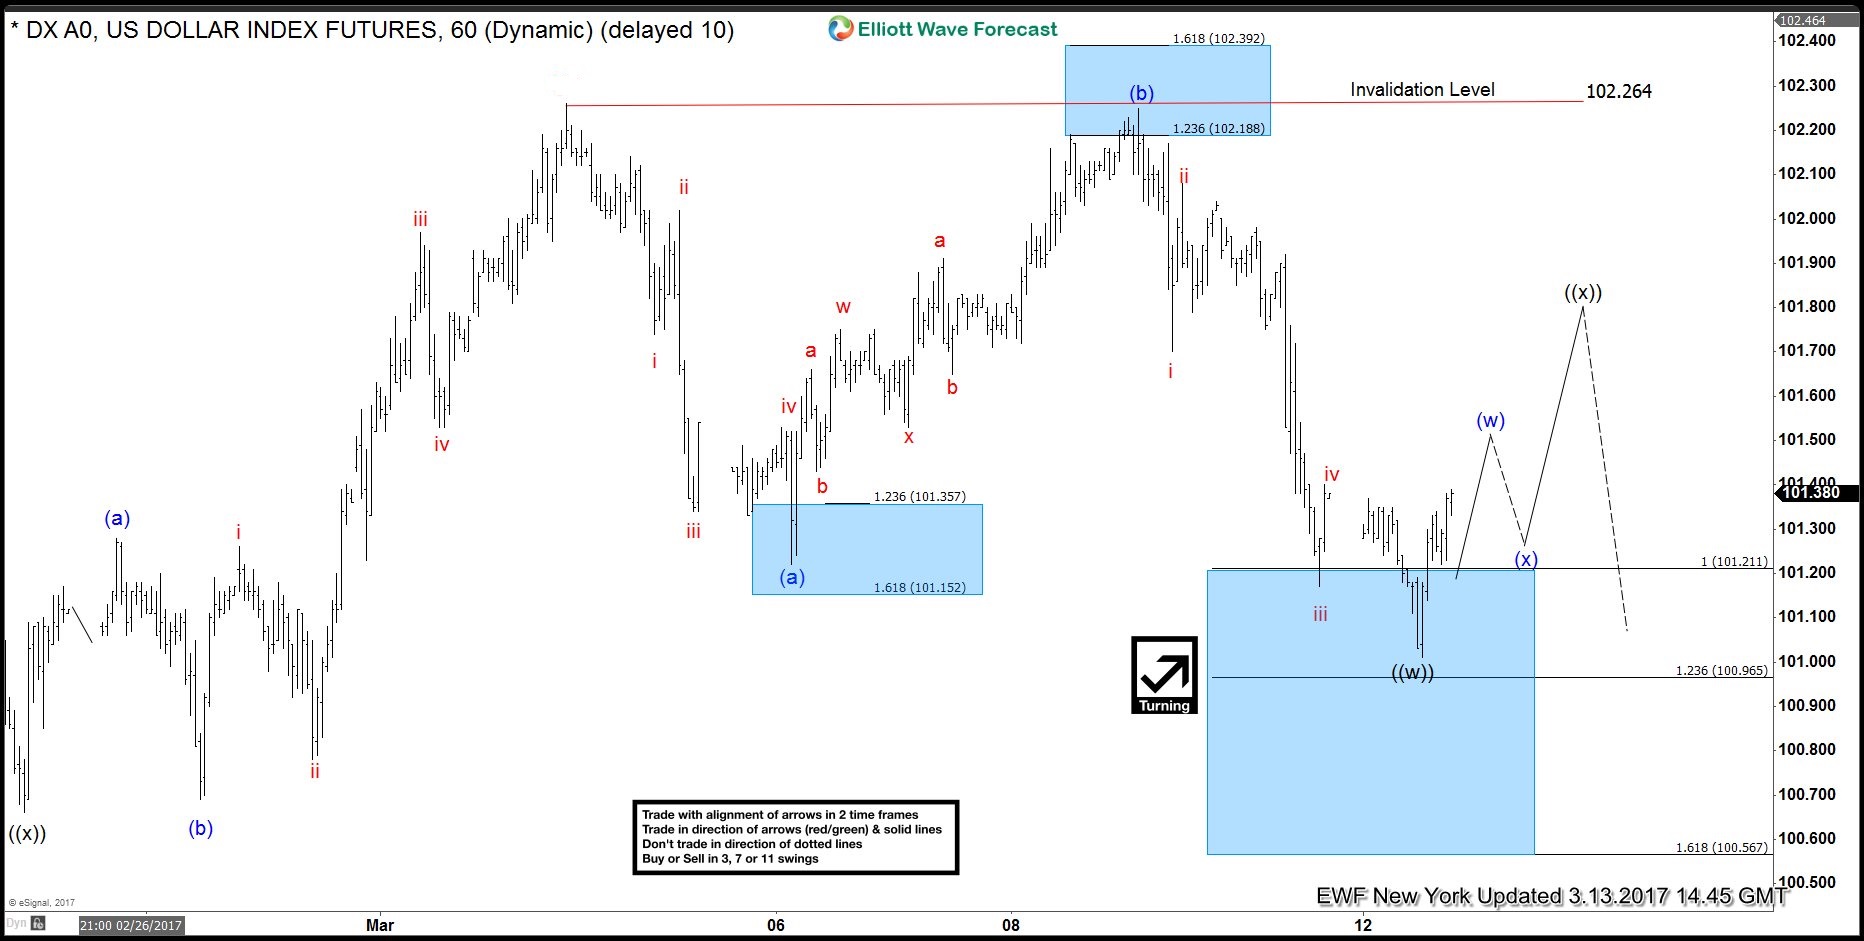
1 Hour DXY New York Chart 3.13.2017
This suggests that a good reading of technical charts can anticipate a move without depending on the outcome of important news events. In addition, technical trading also provides a risk management mechanism that could not be done otherwise.
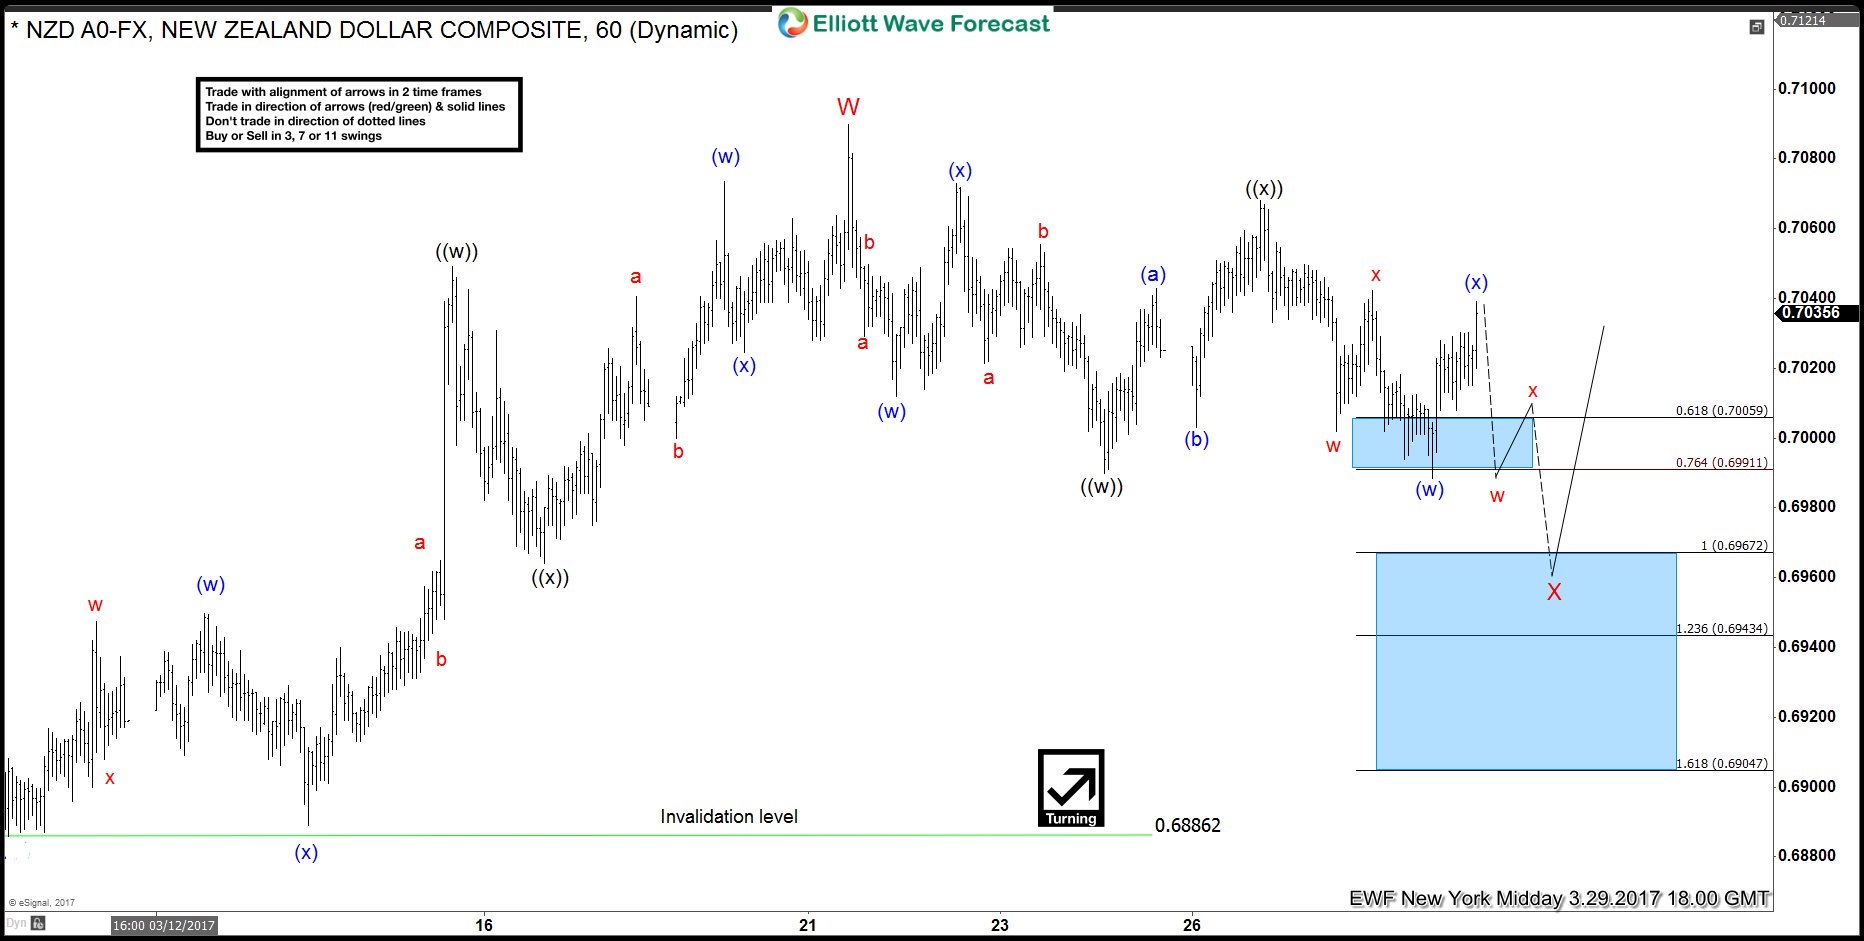
1 Hour Elliott Wave Analysis: NZDUSD is currently in a Elliott Wave double ((w))-((x))-((y)) correction lower on the 1 hour time frame and we expect red wave X to terminate in the 0.6967 – 0.6943 area where the pair should bounce higher. We do not recommend selling the pair to the proposed red wave X terminating area but rather recommend buying in that area for the next possible move higher. The bullish scenario is invalid if price moves below the 0.6886 level.
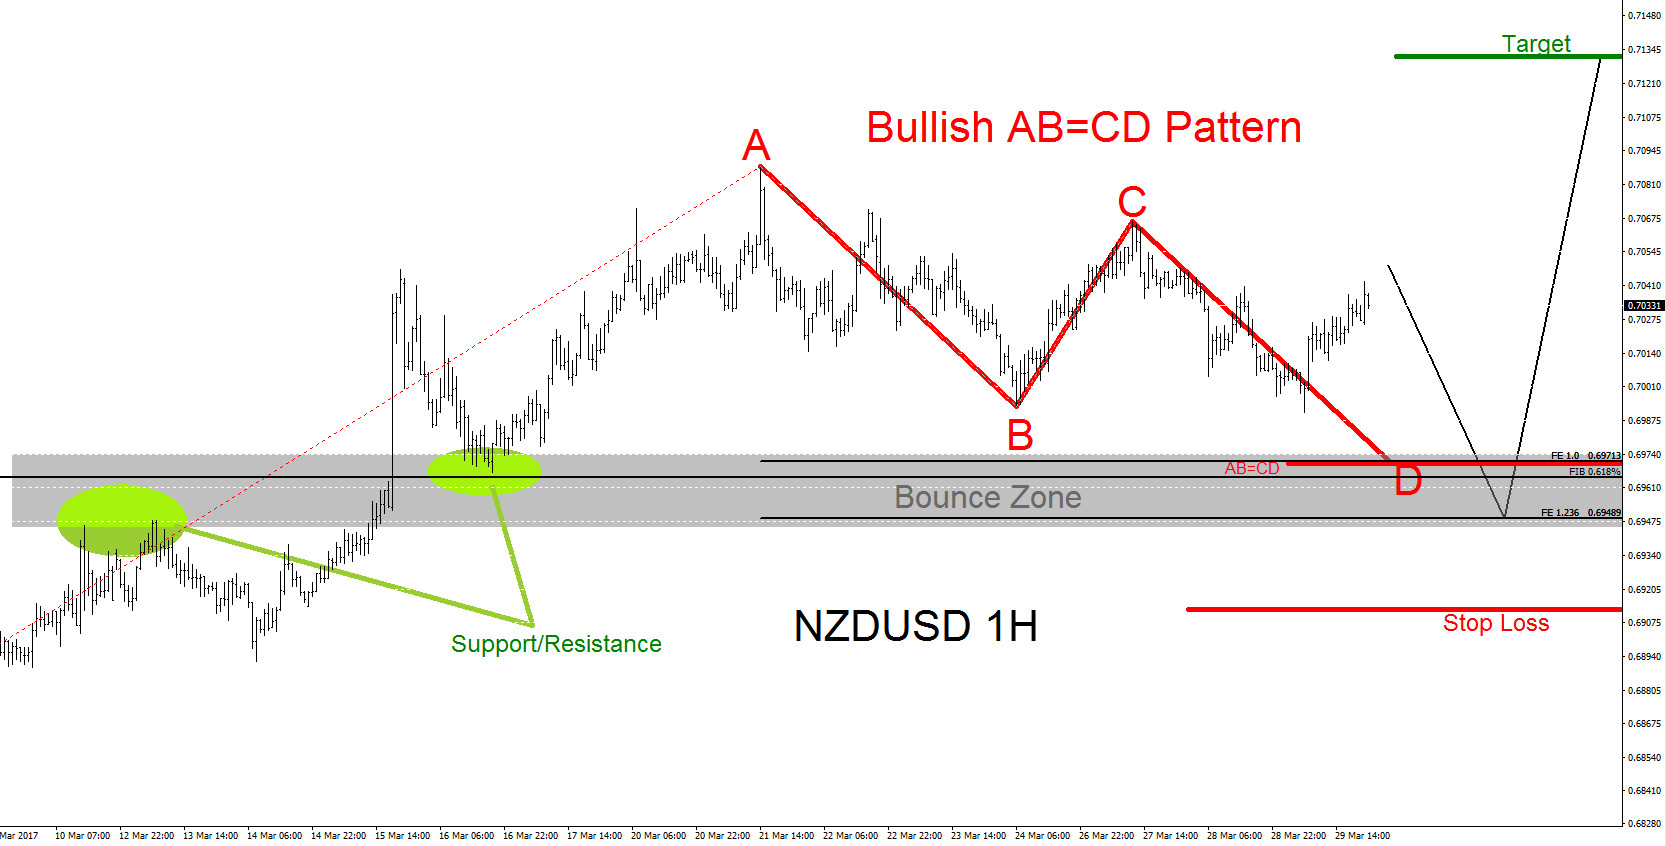
1 Hour Bullish Pattern: A possible Bullish Pattern (Red) is clear and visible on the 1 hour chart. The red bullish pattern Point D terminates near the 0.618% Fib. retracement and the 1.0 (Equal legs) Fib. extension levels. Also looking back at previous price action we can also see there is a support/resistance zone where price has bounced off. Putting all this together with the above Elliott Wave (chart above) we believe the Bounce Zone (Grey box) will provide good support and NZDUSD should bounce higher off this zone if price reaches this area.
If looking to buy NZDUSD traders should be patient and wait for the 1 hour red point D/wave red X pullback to the possible bounce zone (grey box). Waiting for the red point D/wave red X pullback/retrace to the possible bounce zone will offer a better risk/reward trade setup. Stop loss should be placed at 0.6910. Below 0.6910 will invalidate the red bullish pattern. Target is at 0.7130
Of course, like any strategy/technique, there will be times when the strategy/technique fails so proper money/risk management should always be used on every trade.
Short term Elliott Wave view in USDJPY suggests that cycle from 3/10 peak (115.53) has ended with Minor wave A at 110.077. Decline from 115.53 is unfolding as a 5 waves impulse Elliott wave structure with an extension where Minute wave ((i)) ended at 114.46, Minute wave ((ii)) ended at 115.19, Minute wave ((iii)) ended at 110.59, Minute wave ((iv)) ended at 111.34, and Minute wave ((v)) of A ended at 110.077. USDJPY ended cycle from 3/10 peak and correcting that cycle in Minor wave B bounce in 3, 7, or 11 swing.
Revised view suggests that Minor wave B bounce is unfolding as a zigzag Elliott wave structure where Minute wave ((a)) ended at 111.426 as 5 waves diagonal and Minute wave ((b)) ended at 110.96. Minute wave ((c)) of B is in progress as 5 waves and expected to complete at 112.31 – 112.63 area before pair resumes lower or at least pullback in 3 waves. As far as pivot at 3/10 high (115.53) stays intact, expect pair to extend lower or at least pullback in 3 waves once Minor wave B is complete.
US Dollar Index: Elliott Wave Forecasting the Decline
One of the most popular consensus in 2017 among the analysts is a stronger U.S. Dollar due to the Fed in rate hiking cycle and also Donald Trump promising infrastructure spending, tax reform, which are all supposedly US Dollar positive. At Elliottwave Forecast, we listen to the market through our technical analysis using Elliott Wave, cycle and distribution instead of going with the popular belief.
The US Dollar Index declined during the recent 2 weeks despite the fact that US Federal Reserve raised the interest rates by 0.25% On Wednesday 03/15/2017. Yesterday USDX managed to break below January low , so let’s take a look how we managed to forecast the move lower using the Elliott Wave Theory .
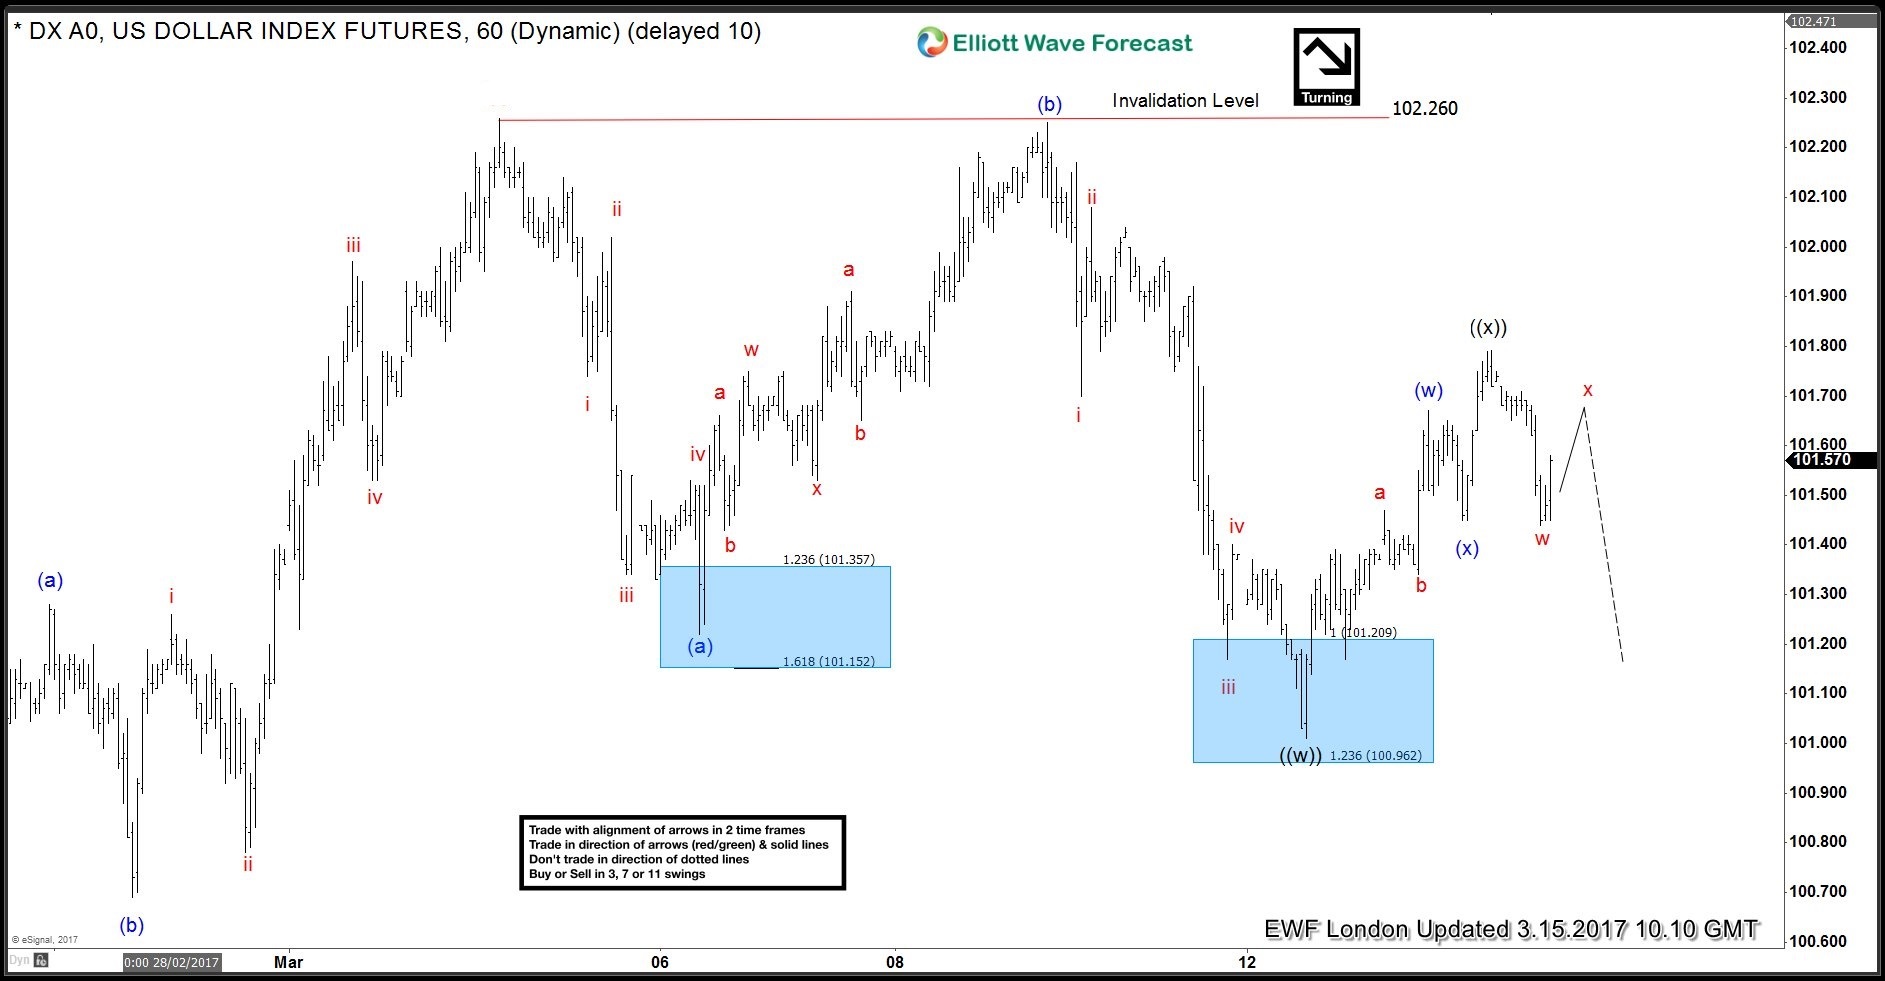
On the weekend before the FOMC meeting , we were looking for the US dollar to bounce early in the week before it can find sellers again and resume lower. So looking at 1H chart on 03/13 , USDX has already ended 3 waves move in wave ((w)) from 03/02 peak at equal legs area 101.21 – 100.96 and it was expected to bounce in 3 swings higher in wave ((x)).
US Dollar 1H New York Chart 03.13.2017
The bounce higher happened as expected and already ended in wave ((x)) in the night before the FED decision, so during the London update on 03/15 we were looking for the US Dollar to hold below 03/14 peak and trade to the downside no matter what was the result as we believe that the technical aspect of the market is more important and effective for trading which can give you an edge during these kind of event .
US Dollar 1H London Chart 03.15.2017
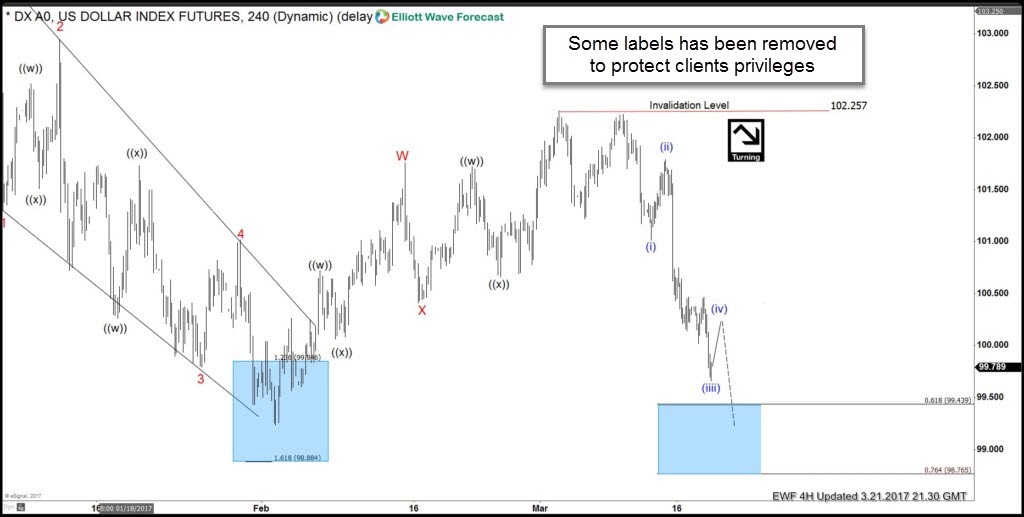
After the announcement , the US Dollar traded lower as expected and kept extending to the downside creating an impulsive bearish sequence that’s why we kept pushing to the downside as showing in the 4H chart on 03/21 . USDX was looking to reach the 61.8 – 76.4 Fibonacci extension of the 2 legs from January 2016 peak which will make it ideally break 02/02 low that’s why it wasn’t recommend to buy the dollar during that stage .
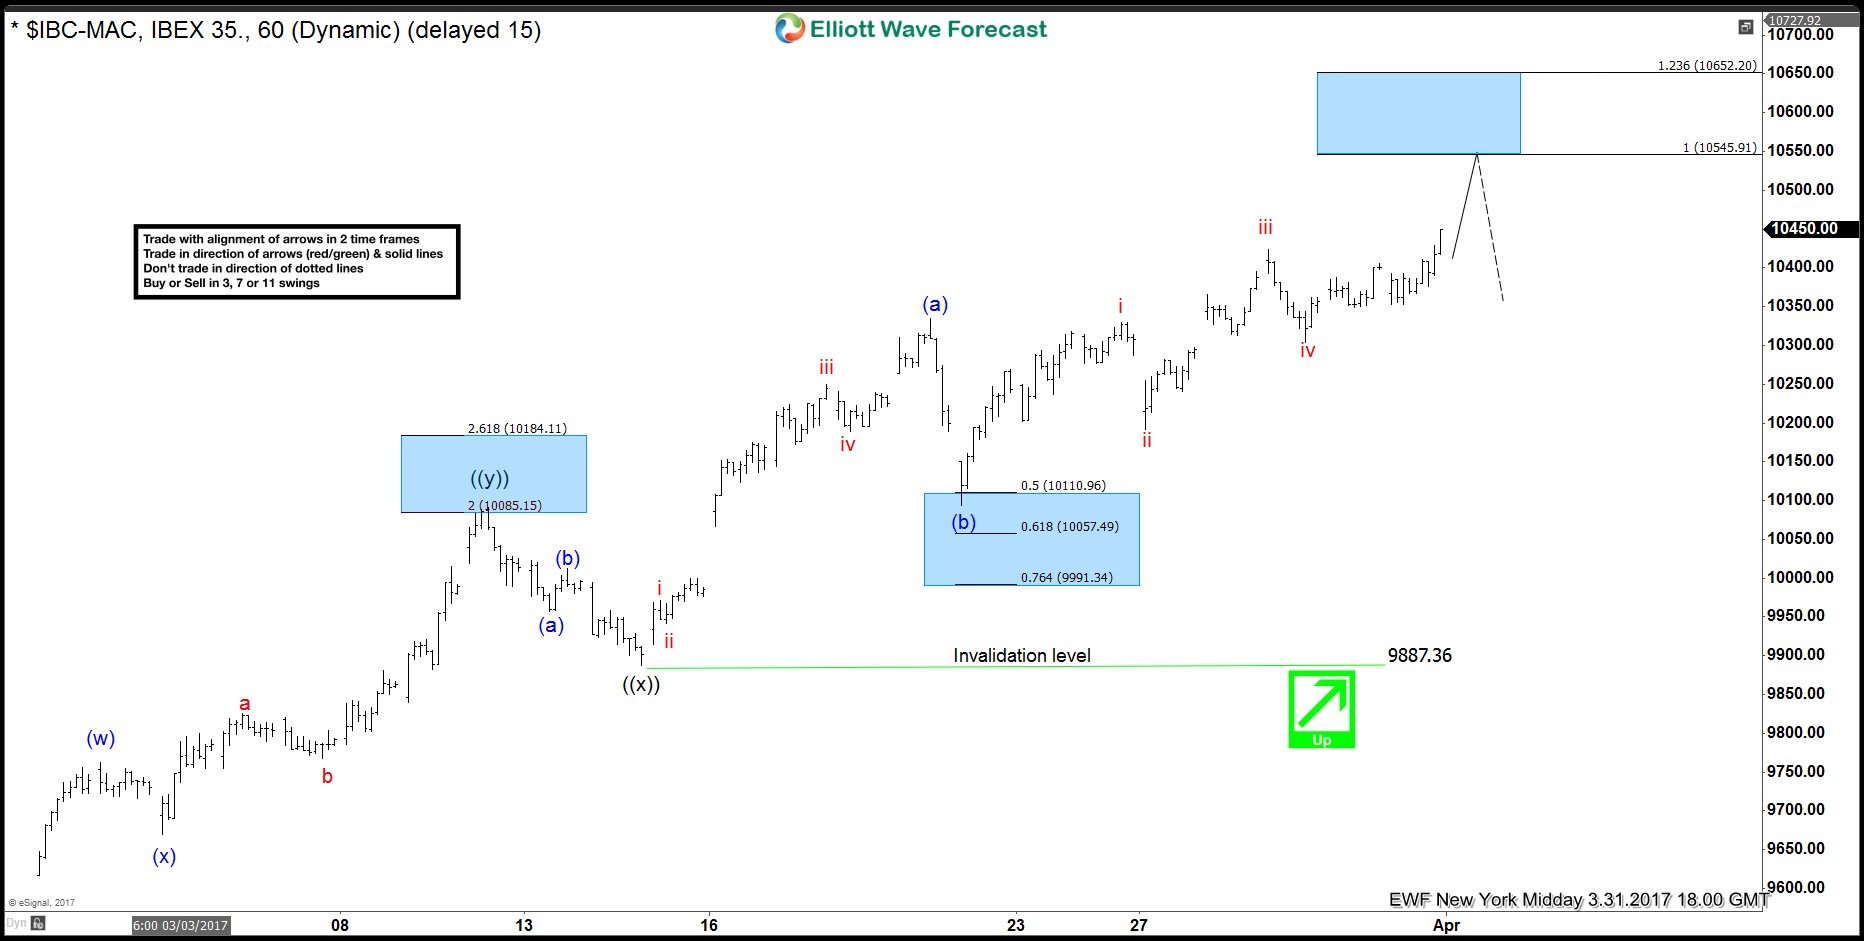
In this Technical blog we’re going to take a quick look at the past Elliott Wave chart of IBEX chart from March 22,2017 and we are going to explain the structure & see how the index continued the rally afterwards.
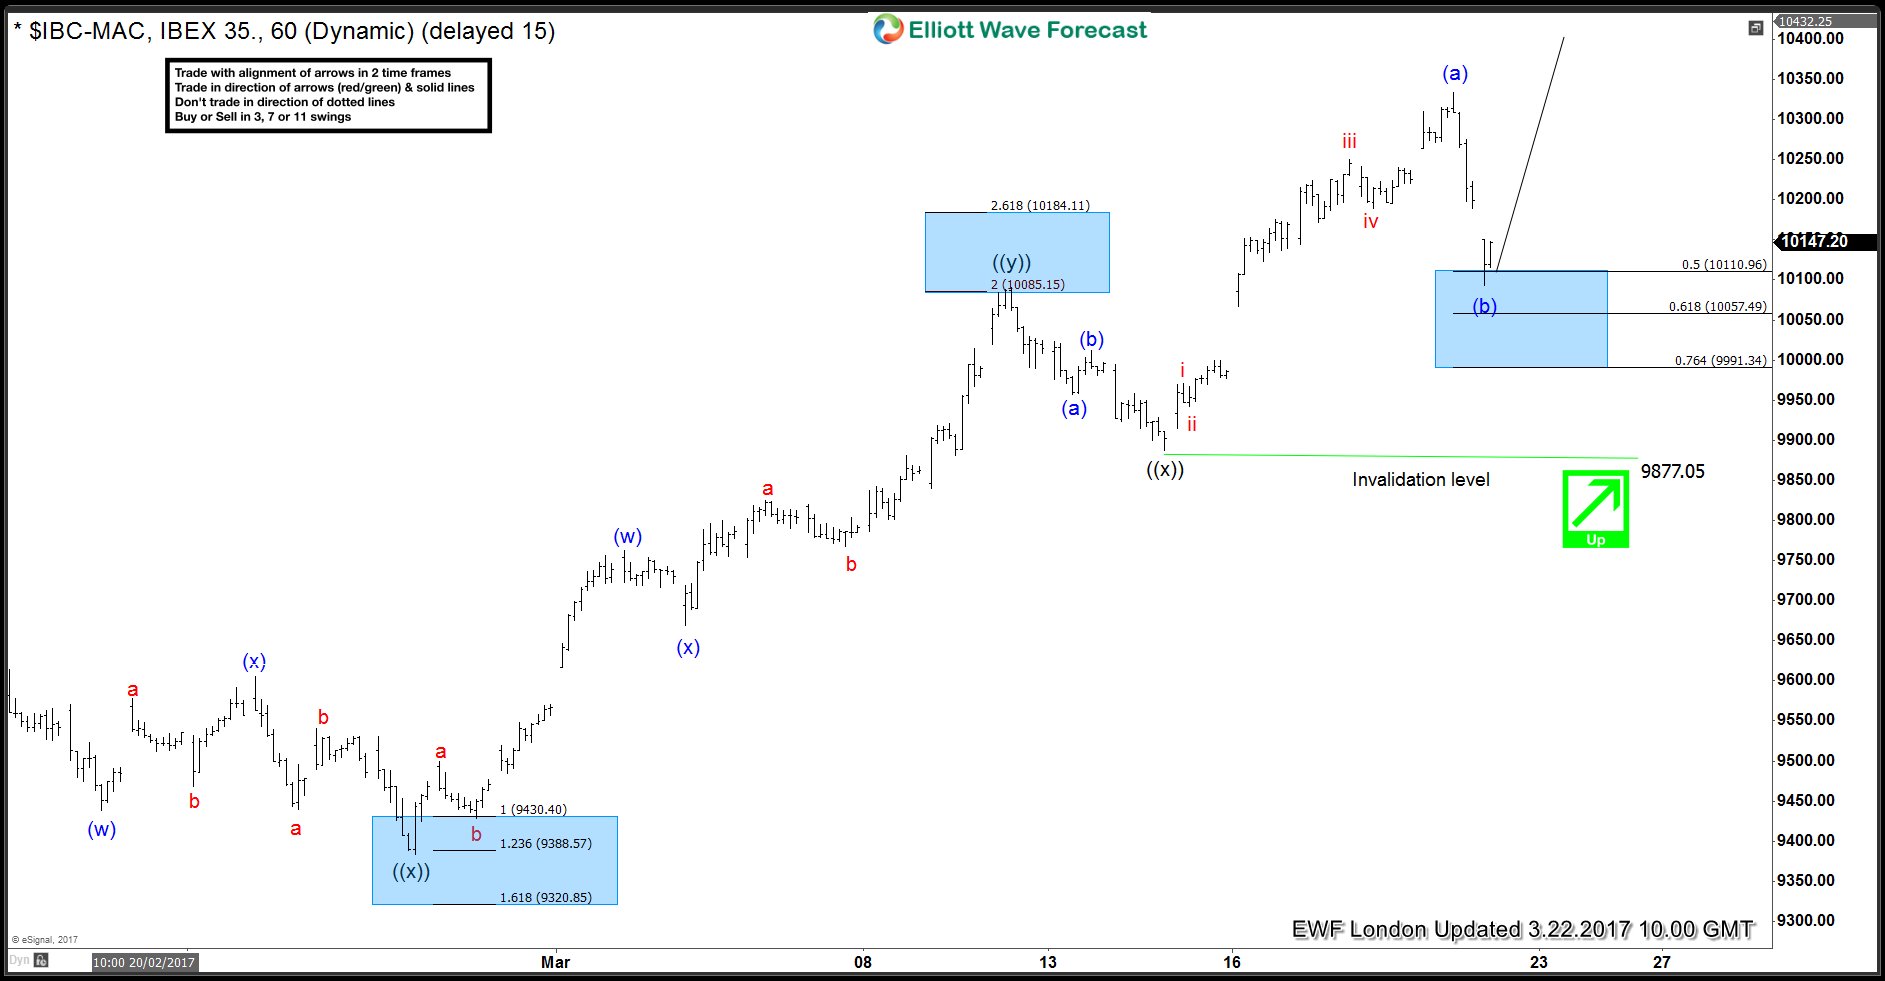
IBEX 1 Hour March 22 London updated chart
Above chart is showing Elliott wave Triple three sequence remains in progress within the cycle from 2/08 lows, in Minute degree and index was showing 9 swings bullish sequence from that cycle favoring more upside extension as far as dips remains above 9877 second wave ((x)) connector low (9877). Also the sequence from 9877 low looks to be impulsive rather then corrective, thus creating a possible Elliott wave zigzag structure was in progress. According to Elliott wave theory Zigzag is a 3 wave structure having internal subdivision of (5-3-5) swing sequence where internal subdivisions are labeled as A, B, C where A = 5 waves, B = 3 waves and C = 5 waves. This means that A and C can be impulsive or diagonal waves. Also the A and C waves must meet all the conditions of 5 wave structure, such as: having an RSI divergence between wave subdivisions, ideal Fibonacci extensions, ideal retracements etc. So our Strategy was to buy the Intraday Minutte wave (b) pullback from 50-764% fib ret area ( 10110-9991 ) blue box area for another extension higher in the index provided the pivot at 9877 low remains intact or for 3 wave bounce at least.
IBEX 1 Hour March 31 NY Midday updated chart
Index found the buyer’s from the blue box area as expected & ended wave (b) pullback at 10110 low. Up from there index started the another 5 waves as expected in wave (c) higher & now should be ideally looking for 10545 – 10652 area next week and make a 3 wave pull back at least from there. We don’t like the selling but 10545 is the area for longs from 10110 to book profits and RSI divergence at the peak should stay intact for the 5 waves in (c) idea to remains valid. Note if it gets erased during the next high, then it could end up being a (w) – (x) – (y) triple three structure from 9887 low.
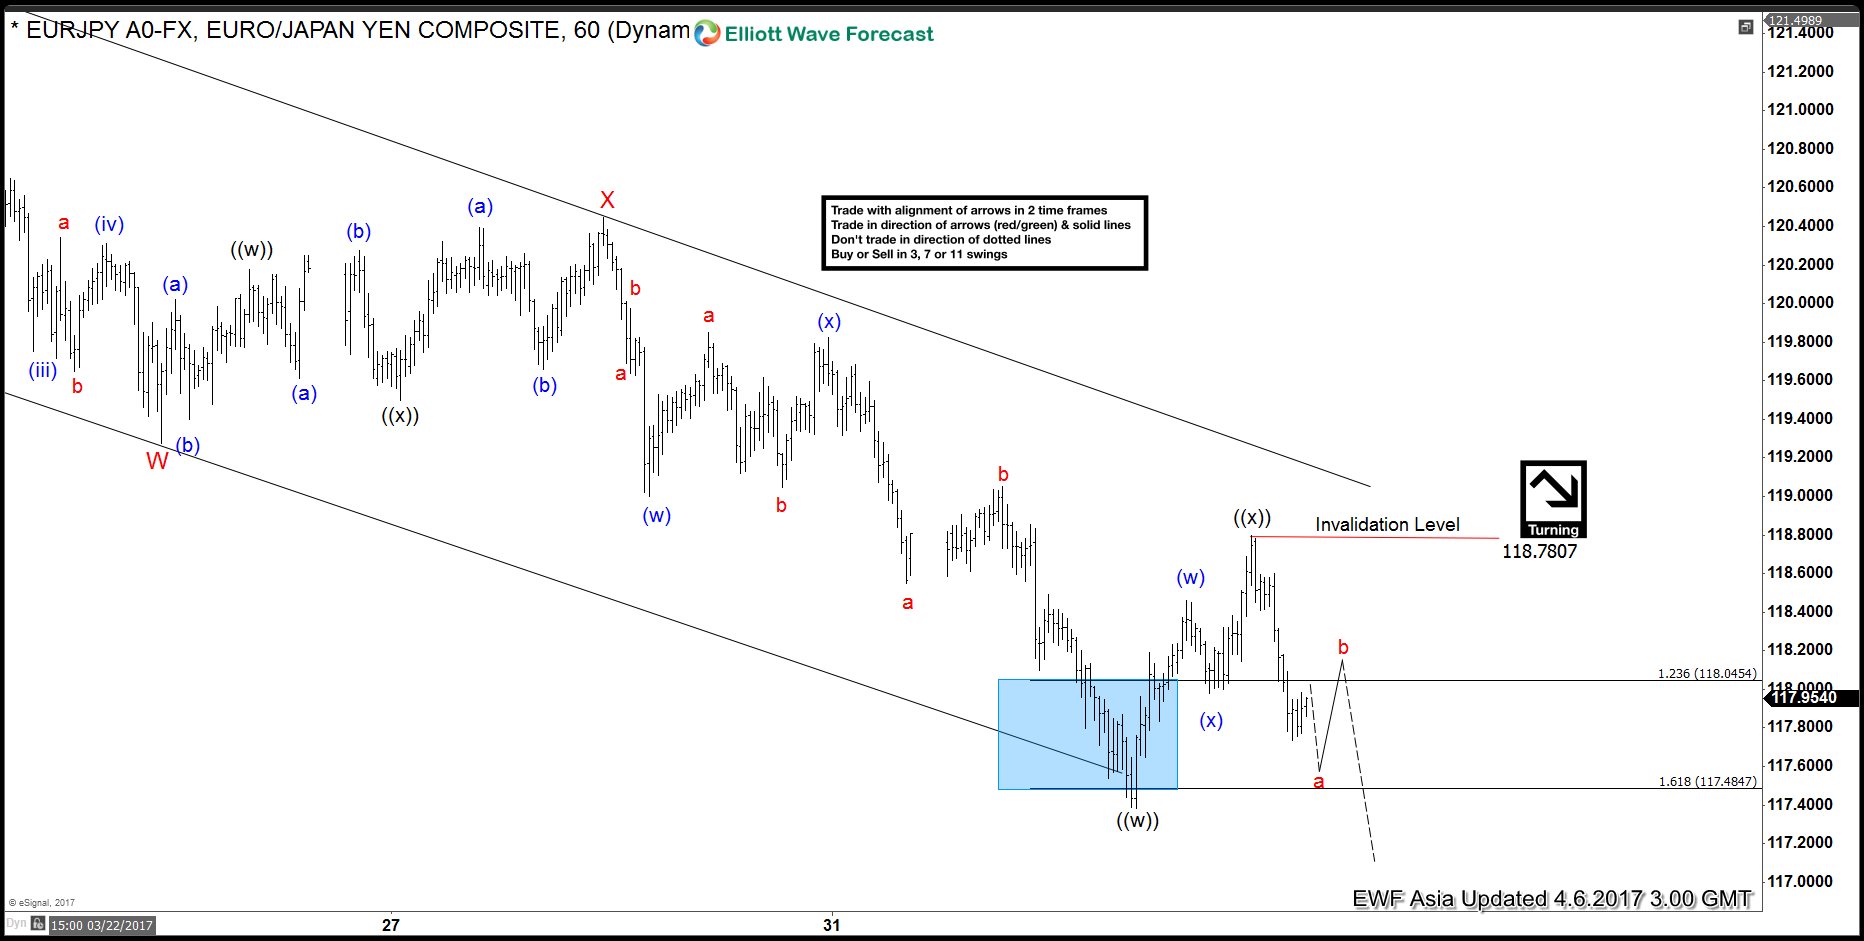
Short term Elliott Wave view in EURJPY suggests that cycle from 3/12 peak (122.89) is unfolding as a double three Elliott wave structure where Minor wave W ended at 119.28 and Minor wave X ended at 120.45. Minor wave Y is in progress and the internal is unfolding also as a double three Elliott wave structure where Minute wave ((w)) can be complete already at 117.8 and wave ((x)) bounce should correct cycle from 3/28 peak (120.445) before pair turns lower. As pair is showing a 5 swing bearish sequence from 3/12 peak as well as from 12/14/2016 peak, more downside is expected in the pair. We don’t like buying the proposed bounce and expect sellers to appear once wave ((x)) bounce is complete in 3, 7, or 11 swing provided that pivot at 3/28 high is intact in the first degree.
Crude Oil (CL_F) started rallying from 03/22 low in a bullish structure which still needs another leg higher to become 5 impulsive waves. The instrument ended the minute wave (( iv )) at the 23.6% Fibonacci retracement area 49.96 from which it managed to bounce higher to resume the move to the upside looking to reach the minimum target of minute wave (( v )) at the inverse 1.236 – 1.618 Fibonacci extension of minute wave (( iv )) that will be at 51.02 – 51.37 area. An other methods for calculating the 5th wave is by measuring (( v )) = (( i )) which gives us a target around the equal legs area at 51.27 – 51.61 and the last methods would be the 61.8 Fibonacci extension of waves (( i )) + (( iii )) that gives us a higher target around 52.19 area.
After ending 5 waves up, Crude Oil should make a 3 wave pull back and extend higher provided 5 waves up from 03/22 low is not part of an expanded FLAT. In either case, from one of the above mentioned area, we can see Crude Oil pulling back in 3 waves at least. We don’t like selling it even after wave ((v)) up has completed as we don’t pick tops or bottoms and instrument has a bullish 5 swings sequence in the daily chart also.
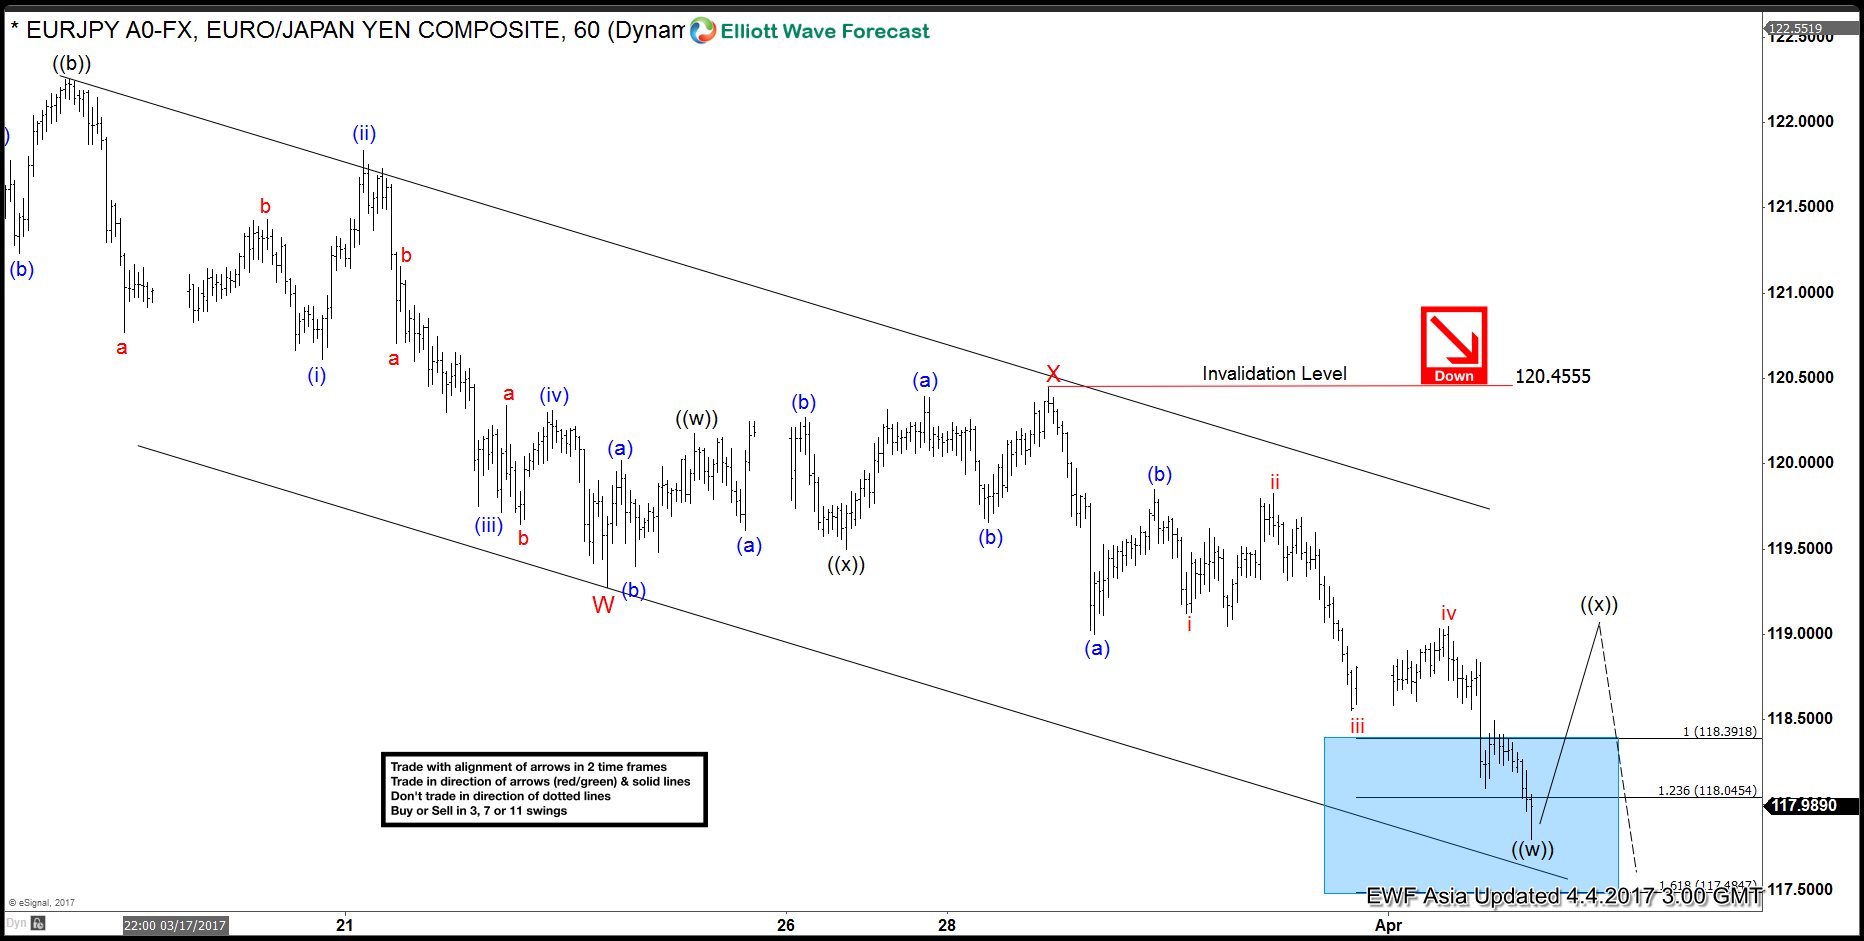
Short term Elliott Wave view in EURJPY suggests that cycle from 3/12 peak (122.89) is unfolding as a double three Elliott wave structure where Minor wave W ended at 119.28 and Minor wave X ended at 120.45. Minor wave Y is in progress and the internal is unfolding also as a double three Elliott wave structure where Minute wave ((w)) ended at 117.38 and wave ((x)) bounce is in progress to correct cycle from 3/28 peak (120.445) towards 118.9 – 119.72 area before pair turns lower. As pair is showing a 5 swing bearish sequence from 3/12 peak as well as from 12/14/2016 peak, more downside is expected in the pair. We don’t like buying the proposed bounce and expect sellers to appear at the above area once wave ((x)) bounce is complete in 3, 7, or 11 swing provided that pivot at 3/28 high stays intact in the first degree.
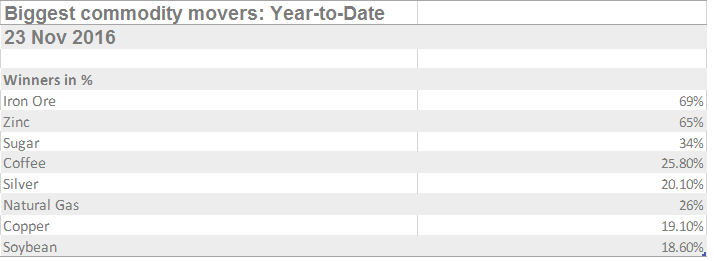
The sentiment for Raw Sugar (SB_F) has turned sour recently. After bottoming at 10.16 cents in 2015, Raw sugar futures have rallied strongly until it peaked at 24 cents last Fall. In fact, Raw Sugar was one of the best performing commodities in 2016, rising around 30% (see table below as of November last year) as there was shortage in production due to bad weather and sweetener experienced shortage for the second consecutive year.
Going into 2017 – 2018, analysts have been forecasting a more balanced market as supply from big suppliers such as Brazil and India start to stabilize. This forecast however rely on the a good weather in the two countries. This year has not been kind to Raw Sugar as prices have tumbled more than 30% from the peak at 24 cents to today’s price of 16 cents. Uncertainties over weather conditions and production is blamed for the poor performance. Due to uncertain price outlook, hedge funds and speculative investors have also been unwinding bullish bets on sugar. According to the Commodity Futures Trading Commission, the net long position in Sugar has dropped 58% from a record high of 290,000 contracts last Fall to 120,000 contracts as of March 7.
Last year, investors betting on “reflation trade” and Trump’s campaign promise has sent commodities, stocks, and bond yields higher in the hope that economic growth and inflation pick up. Recently, the crowded short trade in bond start to get short squeeze, further denting investors’ appetite. Although small projected surplus is expected this year due to improving production from Brazil and India, supplies will tighten up if there’s a bad weather in Brazil or bad monsoon in India. This unpredictable factor could swing the balance from projected small surplus to a deficit for a third year.
Traders have been betting that India, the world’s largest sugar consumer and second-largest producer, will need to import sugar this year due to a production shortfall. But India Sugar Mills association last month reduced the estimates for both production and consumption, which suggest that India may be able to go through the year without importing sugar. This has resulted in the price of raw sugar futures to decline to the lowest level since June.
How low will the price of Raw Sugar go? Is the reflation trade dead? Let’s take a look at the technical charts with Elliott Wave below:
Technical Outlook
Technical Analysis using Elliott Wave, cycle and distribution allow EWF to guide our members in the selloff of Raw Sugar
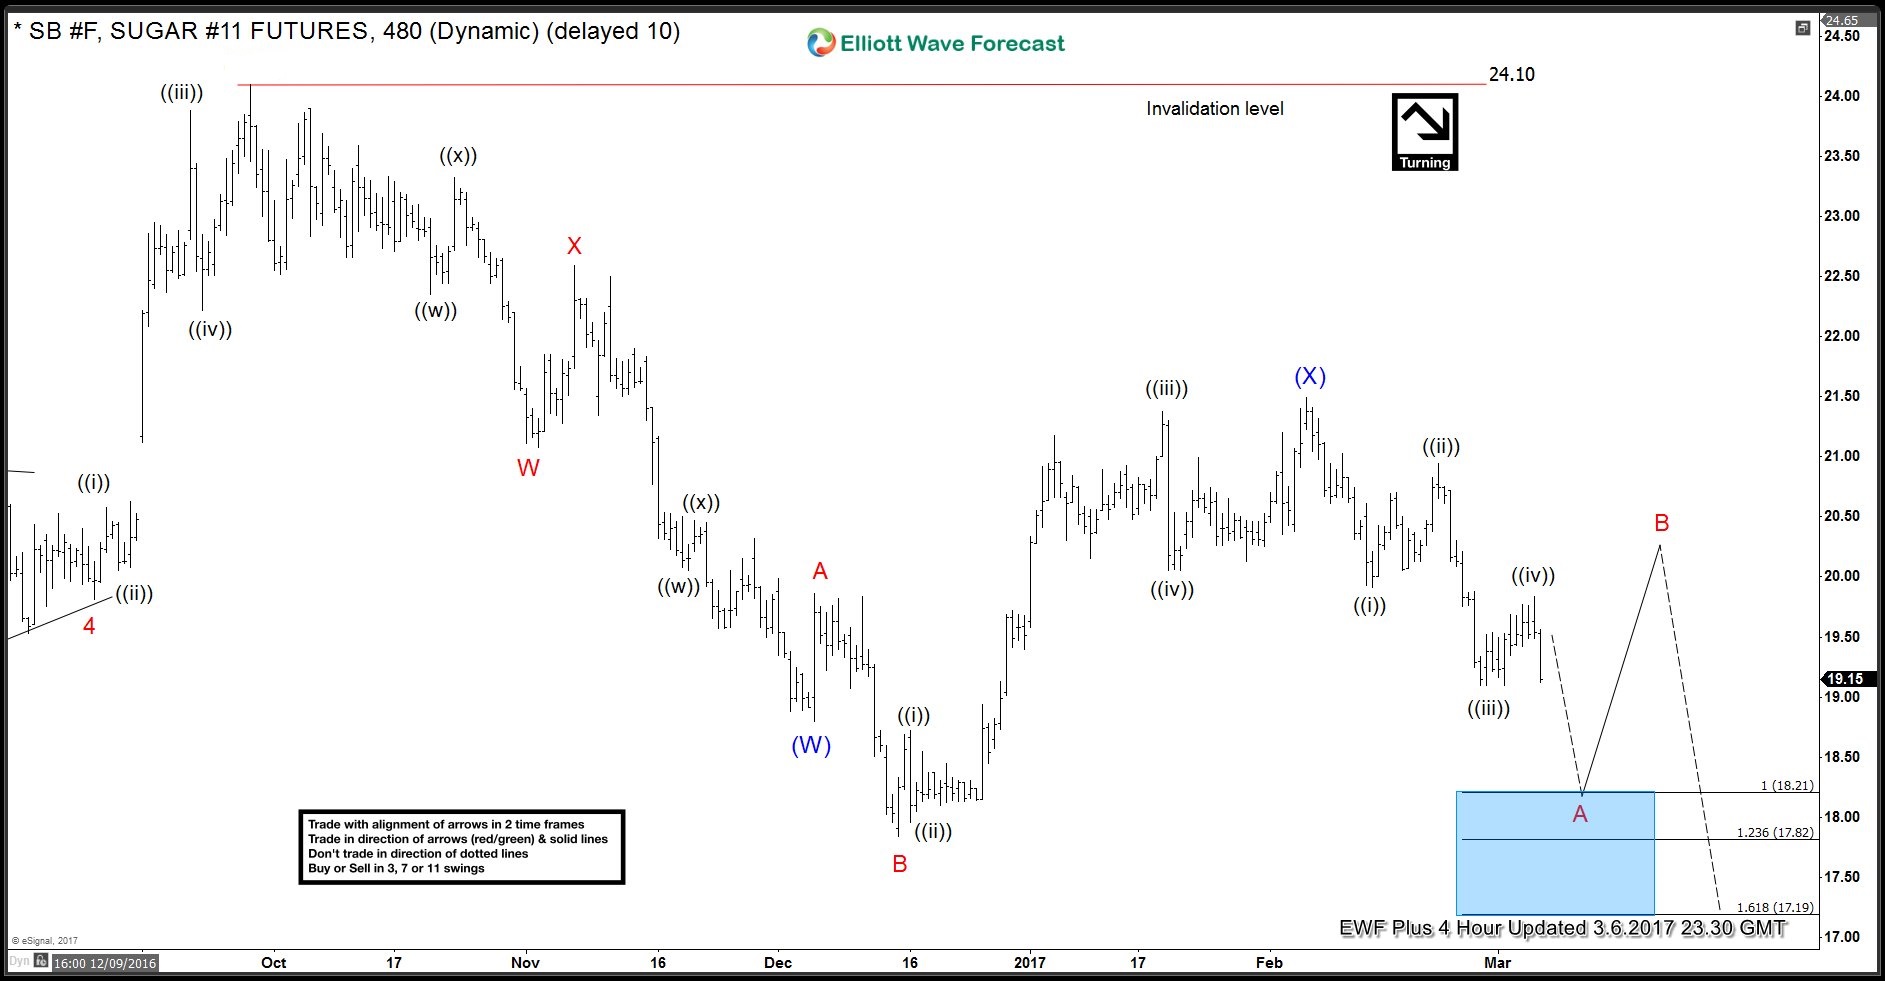
SB_F (Raw Sugar) 4 hour Elliott Wave chart 3/6/2017
Before the start of the selloff early last month, 4 hour chart on 3/6/2017 above suggests that SB_F can continue to go down and even break below the previous low on 12/15 (17.8 cents).
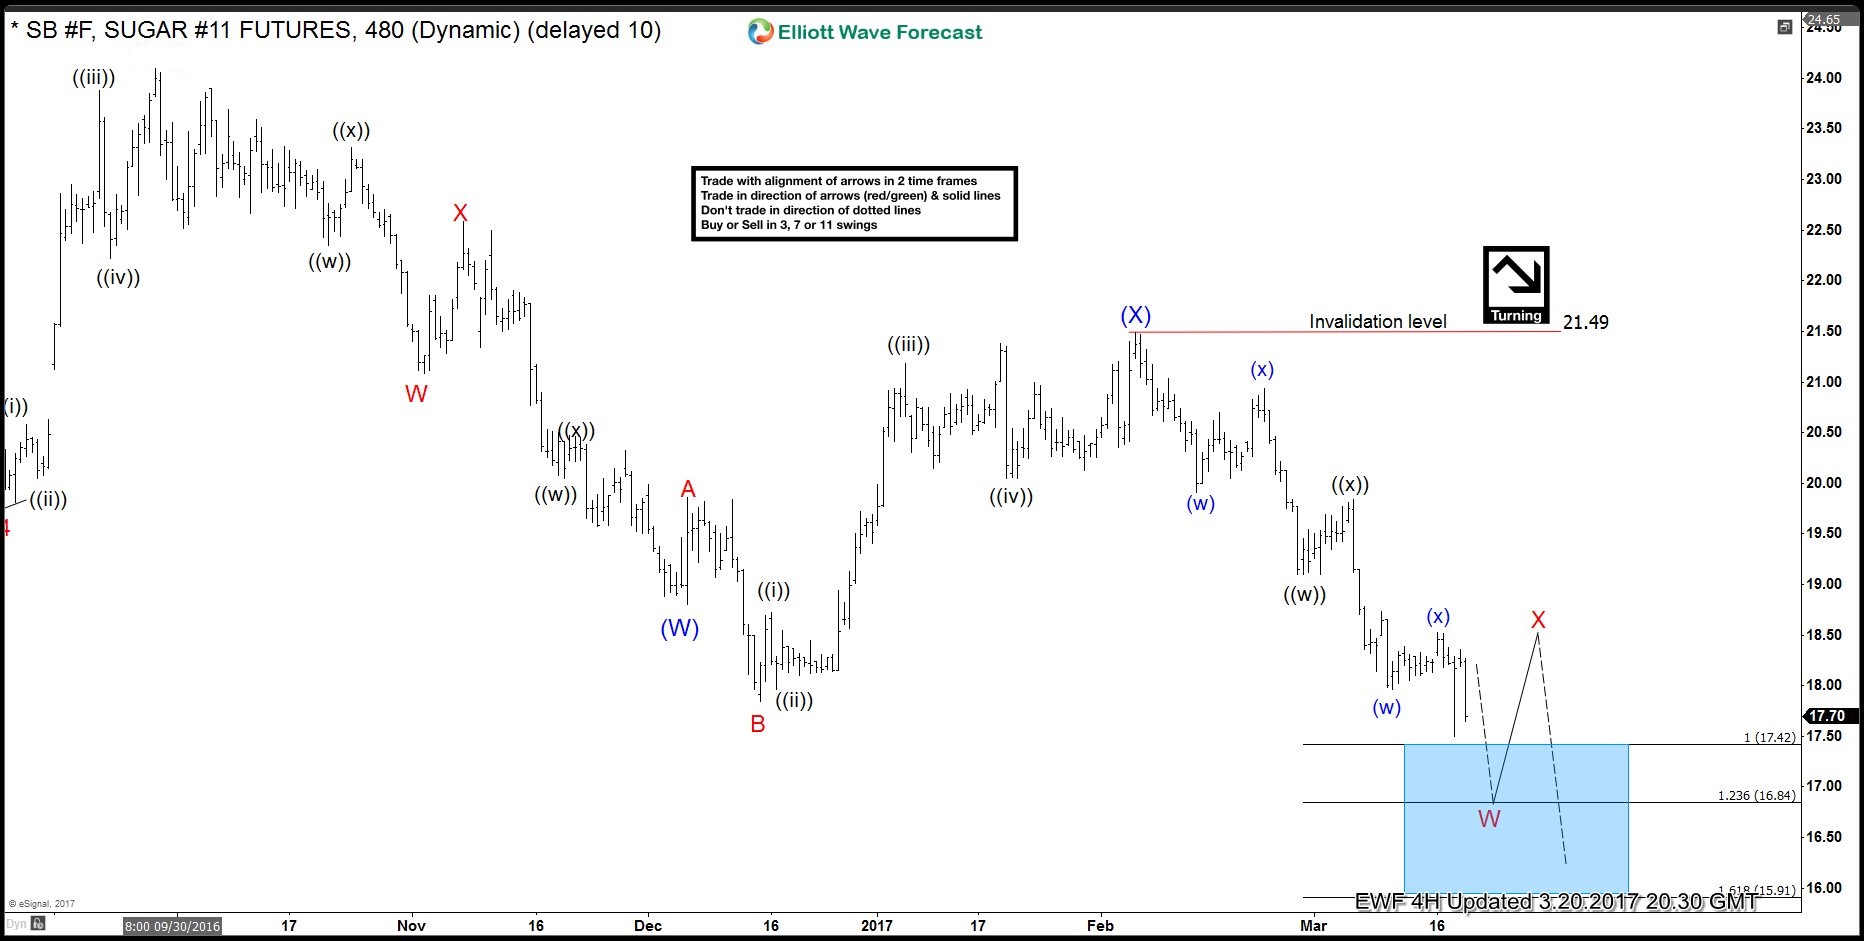
SB_F (Raw Sugar) 4 hour Elliott Wave chart 3/20/2017
Two weeks later on March 20, SB_F (Raw Sugar) broke below 12/15 low (17.8 cents), as expected, which opened further downside. On 3/20, we expected SB_F to bounce from 16.85 – 17.43 area in Minor red X before turning lower again.
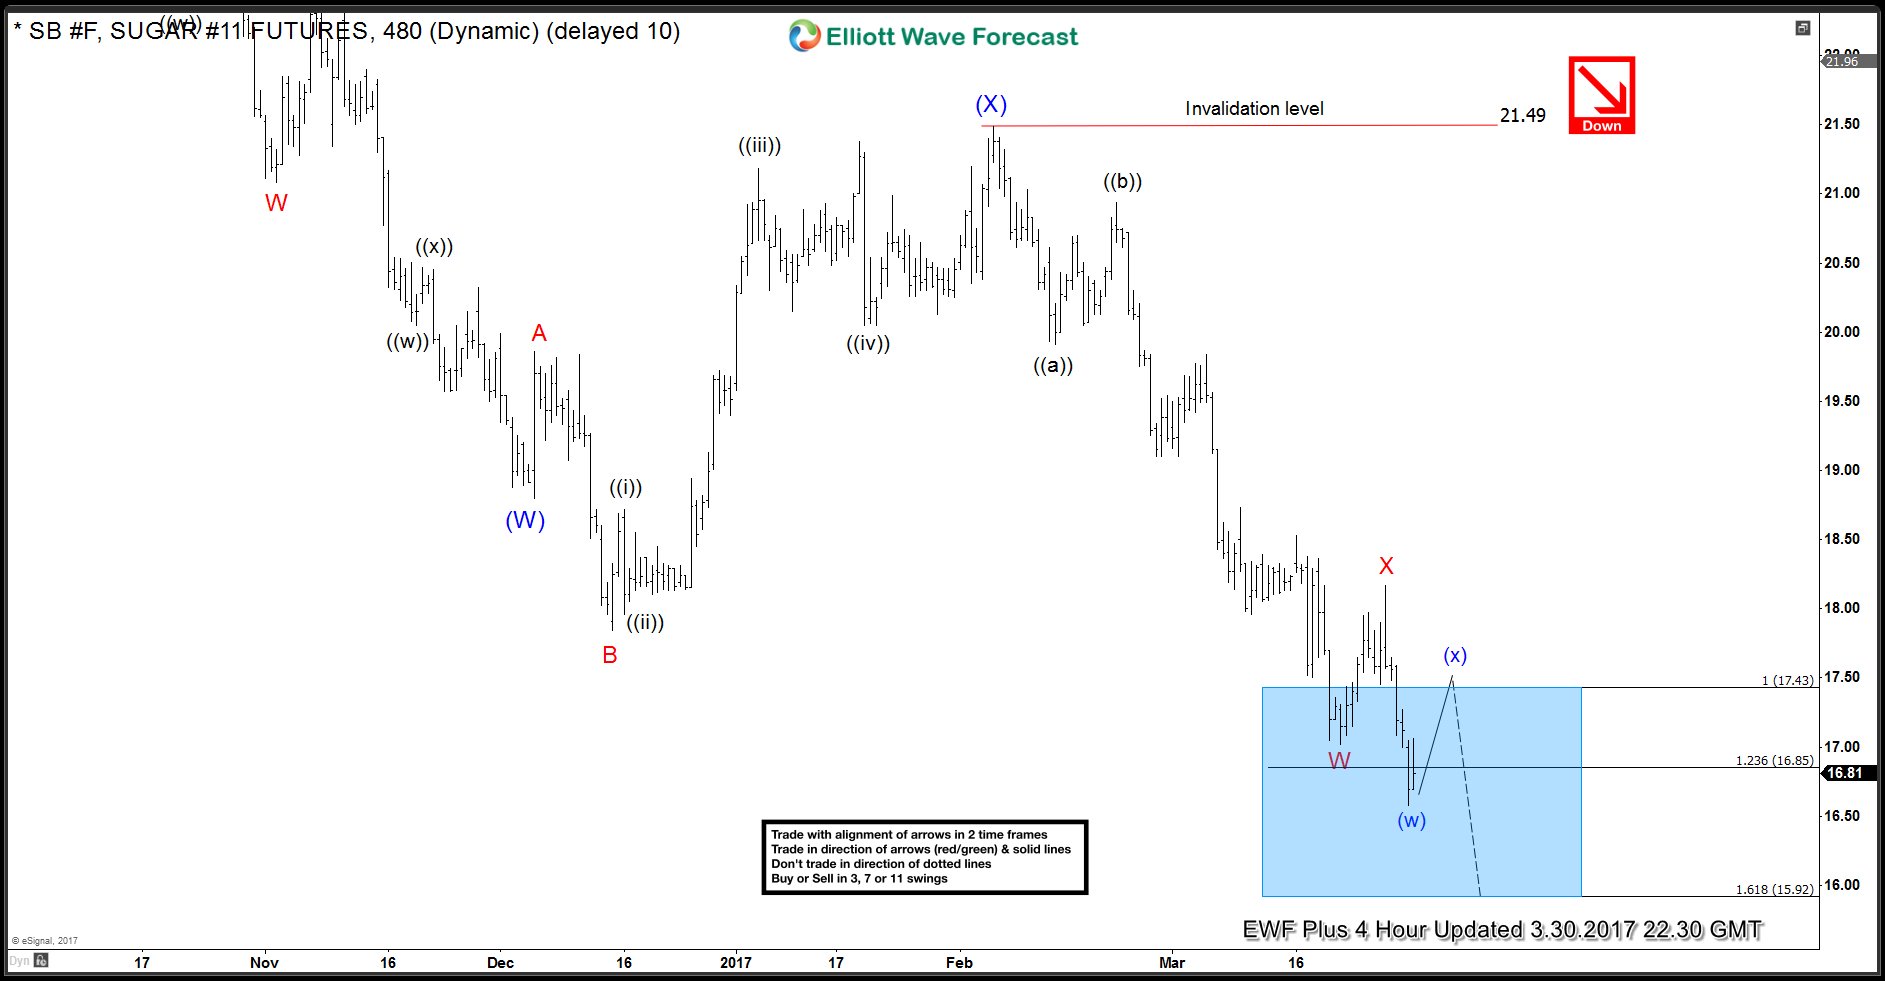
SB_F (Raw Sugar) 4 hour Elliott Wave chart 3/30/2017
10 days later on March 30, SB_F (Raw Sugar) completed Minor wave X bounce then turned lower again as we expected.
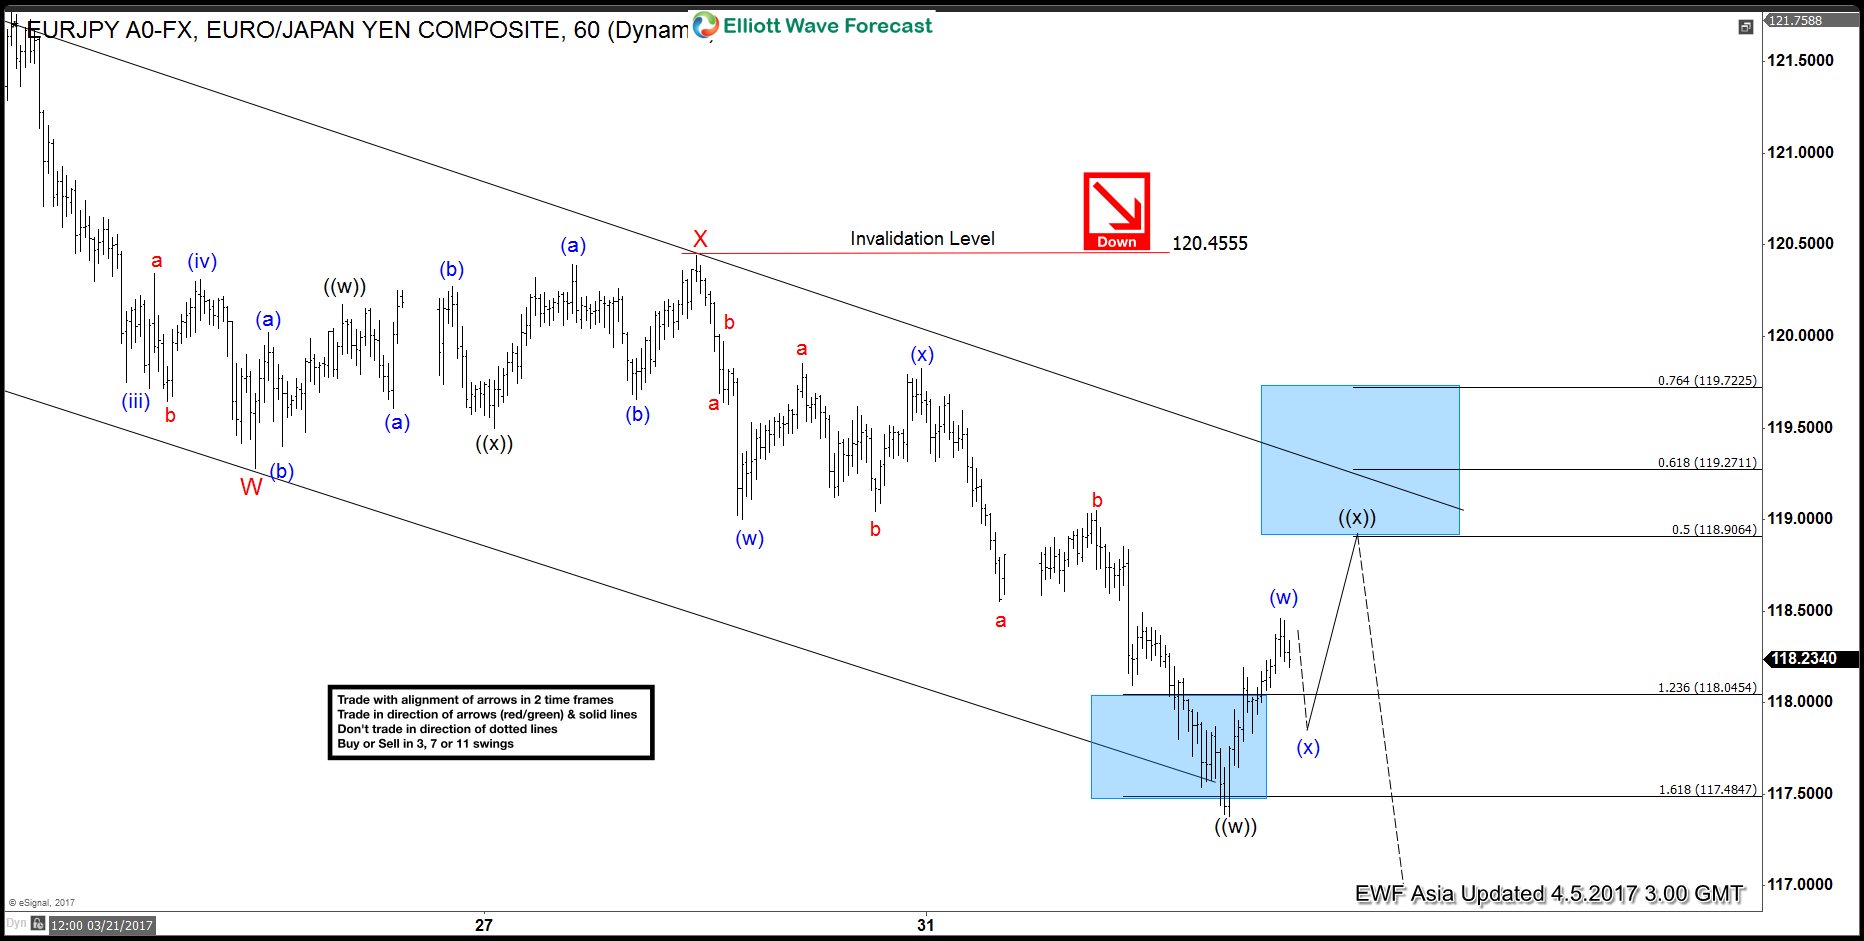
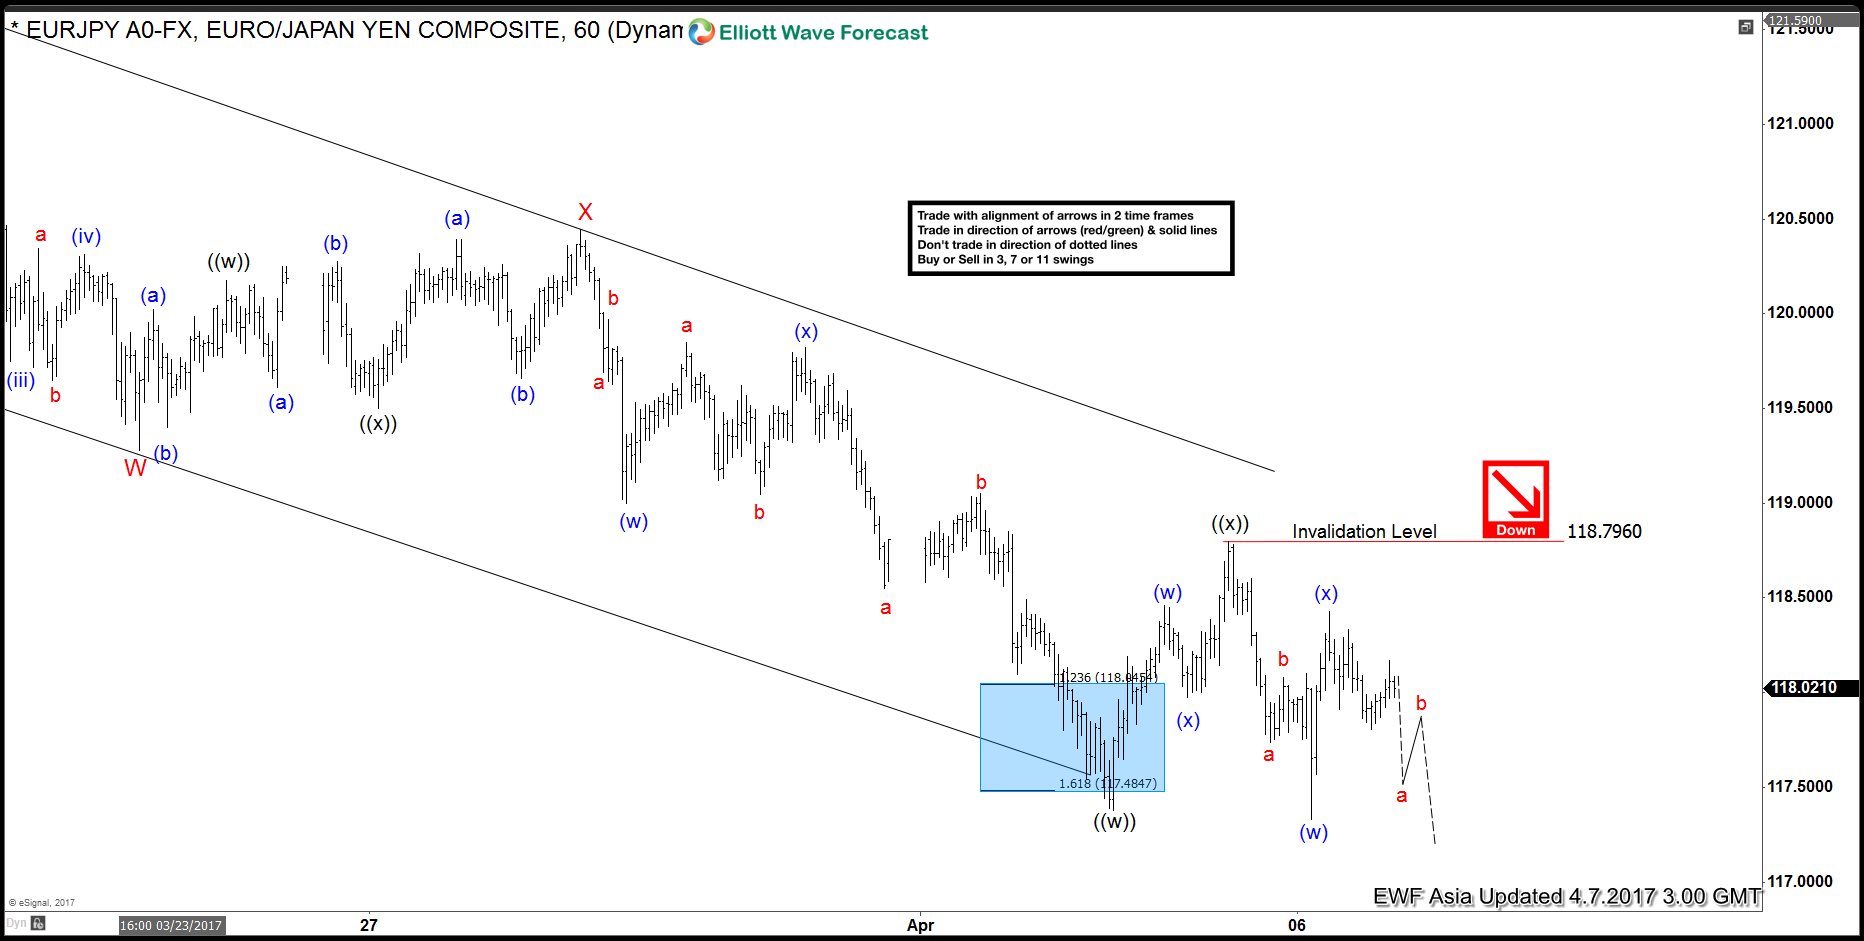
Short term Elliott Wave view in EURJPY suggests that cycle from 3/12 peak (122.89) is unfolding as a double three Elliott wave structure where Minor wave W ended at 119.28 and Minor wave X ended at 120.45. Minor wave Y is in progress and the internal is unfolding also as a double three Elliott wave structure where Minute wave ((w)) ended at 117.38 and Minute wave ((x)) bounce is proposed complete at 118.78. Down from 118.78, if pair can see 1 more minor low, the decline can be defined as 5 waves impulse and the 5 waves move should complete Subminutte wave a, then it should bounce in Subminutte wave b to correct the cycle from 118.78 high before pair turns lower again. We don’t like buying the proposed bounce and expect sellers to appear once Subminutte wave b is complete in 3, 7, or 11 swing provided that pivot at 4/5 high (118.78) stays intact in the first degree.
Short term Elliott Wave view in EURJPY suggests that cycle from 3/12 peak (122.89) is unfolding as a double three Elliott wave structure where Minor wave W ended at 119.28 and Minor wave X ended at 120.45. Minor wave Y is in progress and the internal is unfolding also as a double three Elliott wave structure where Minute wave ((w)) ended at 117.38 and Minute wave ((x)) bounce is proposed complete at 118.79. Pair has resumed the decline lower and the decline is unfolding as a zigzag Elliott wave structure where Subminutte wave a ended at 117.33 and Subminutte wave b ended at 118.43. Near term, while bounces stay below 118.79, but more importantly below 120.45, expect pair to extend lower. We don’t like buying the proposed bounce.
DFMGI tracks Dubai Financial Market which is the largest financial trading exchange in the United Arab Emirates. Dubai has emerged as a global city and business hub of the Middle East , it’s contently growing bigger and becoming one of most expensive city in the world. The Dubai Financial Market (DFM) was founded on 2000, looking at it’s index chart you may say it’s quite different from the rest but we do believe in EWF that there is only one market and every instrument is related to another. Which explain having a different structure or sequence doesn’t necessarily mean that’s trading on it’s own, because the bigger cycles are the same among the different groups of the market.
DFMGI Elliott Wave View
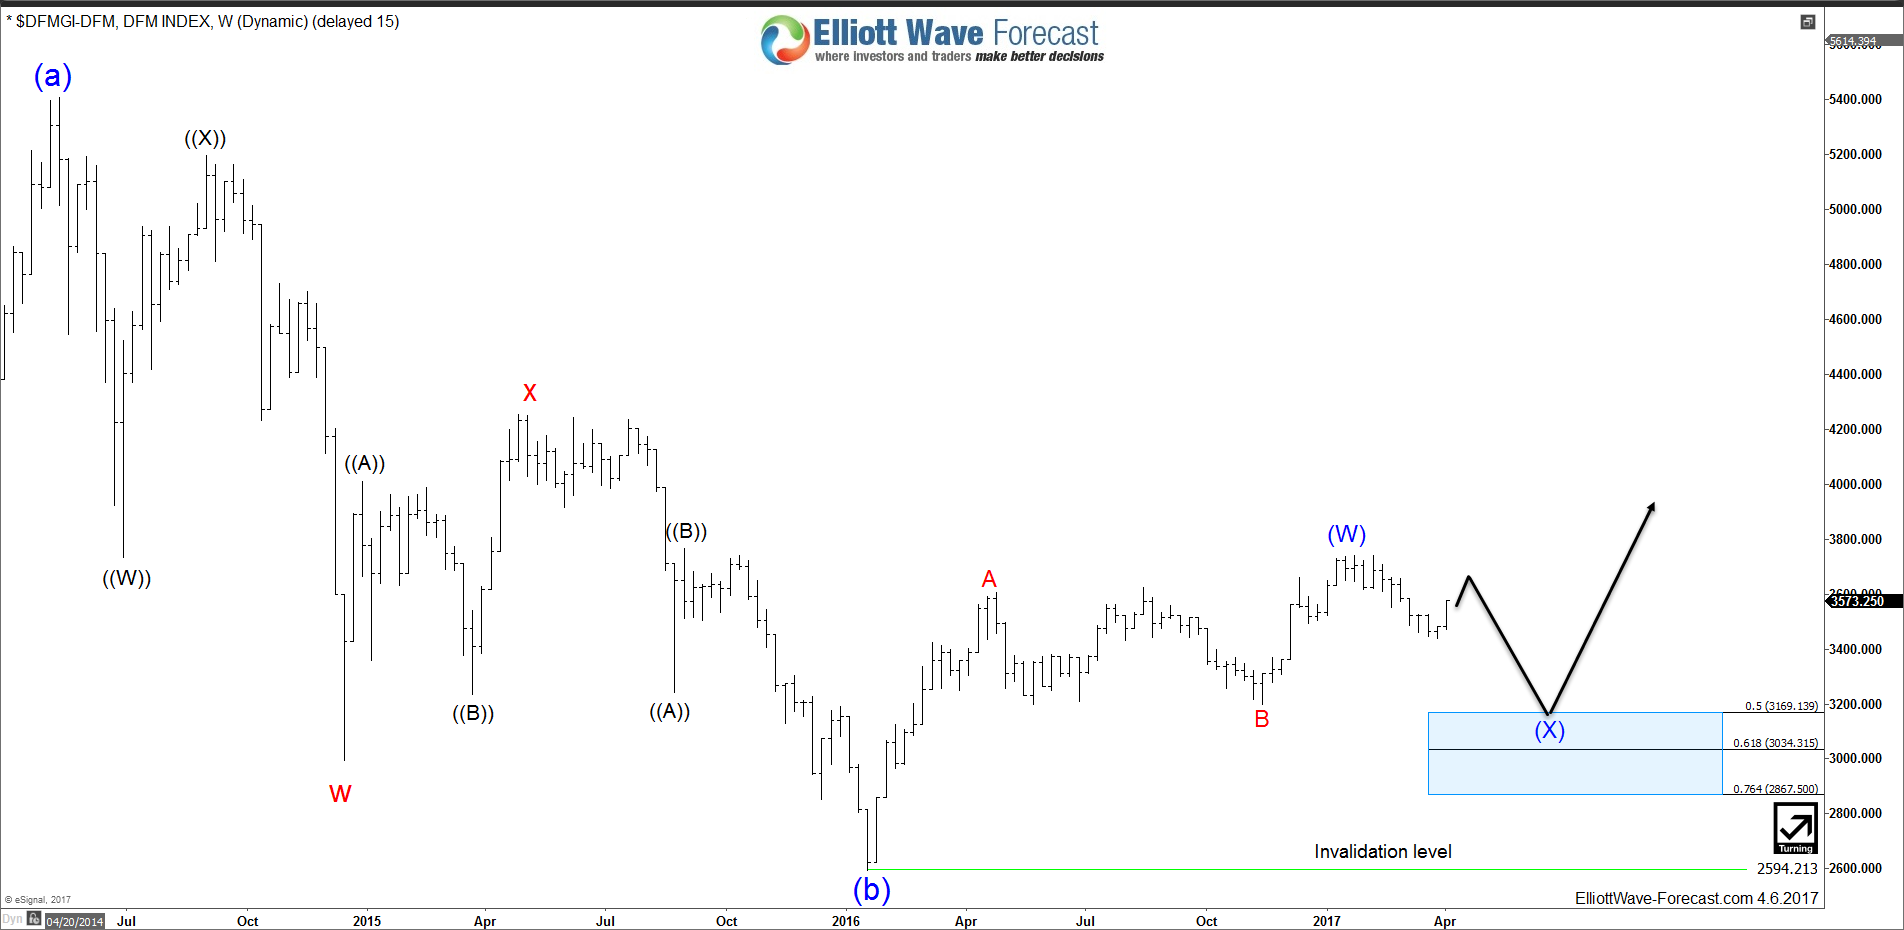
Last year, DFMGI rallied like the rest of world Indices and we can notice that it has a bullish structure in wave (1) unfolding as 5 impulsive waves from January 2016 low followed by a flat correction during the middle of the year in wave (2) and finally it managed to resume the rally from November lows to be make new high.
The index recently ended wave 2 pullback as a double three correction reaching equal legs area 3467 – 3423 from which it bounced higher and still needs to break above February peak to open more extension to the upside. The correction in wave 2 may persist if DFMGI manage to break 03/29 low but it should remain supported while the pivot at 3195 low keeps holding.
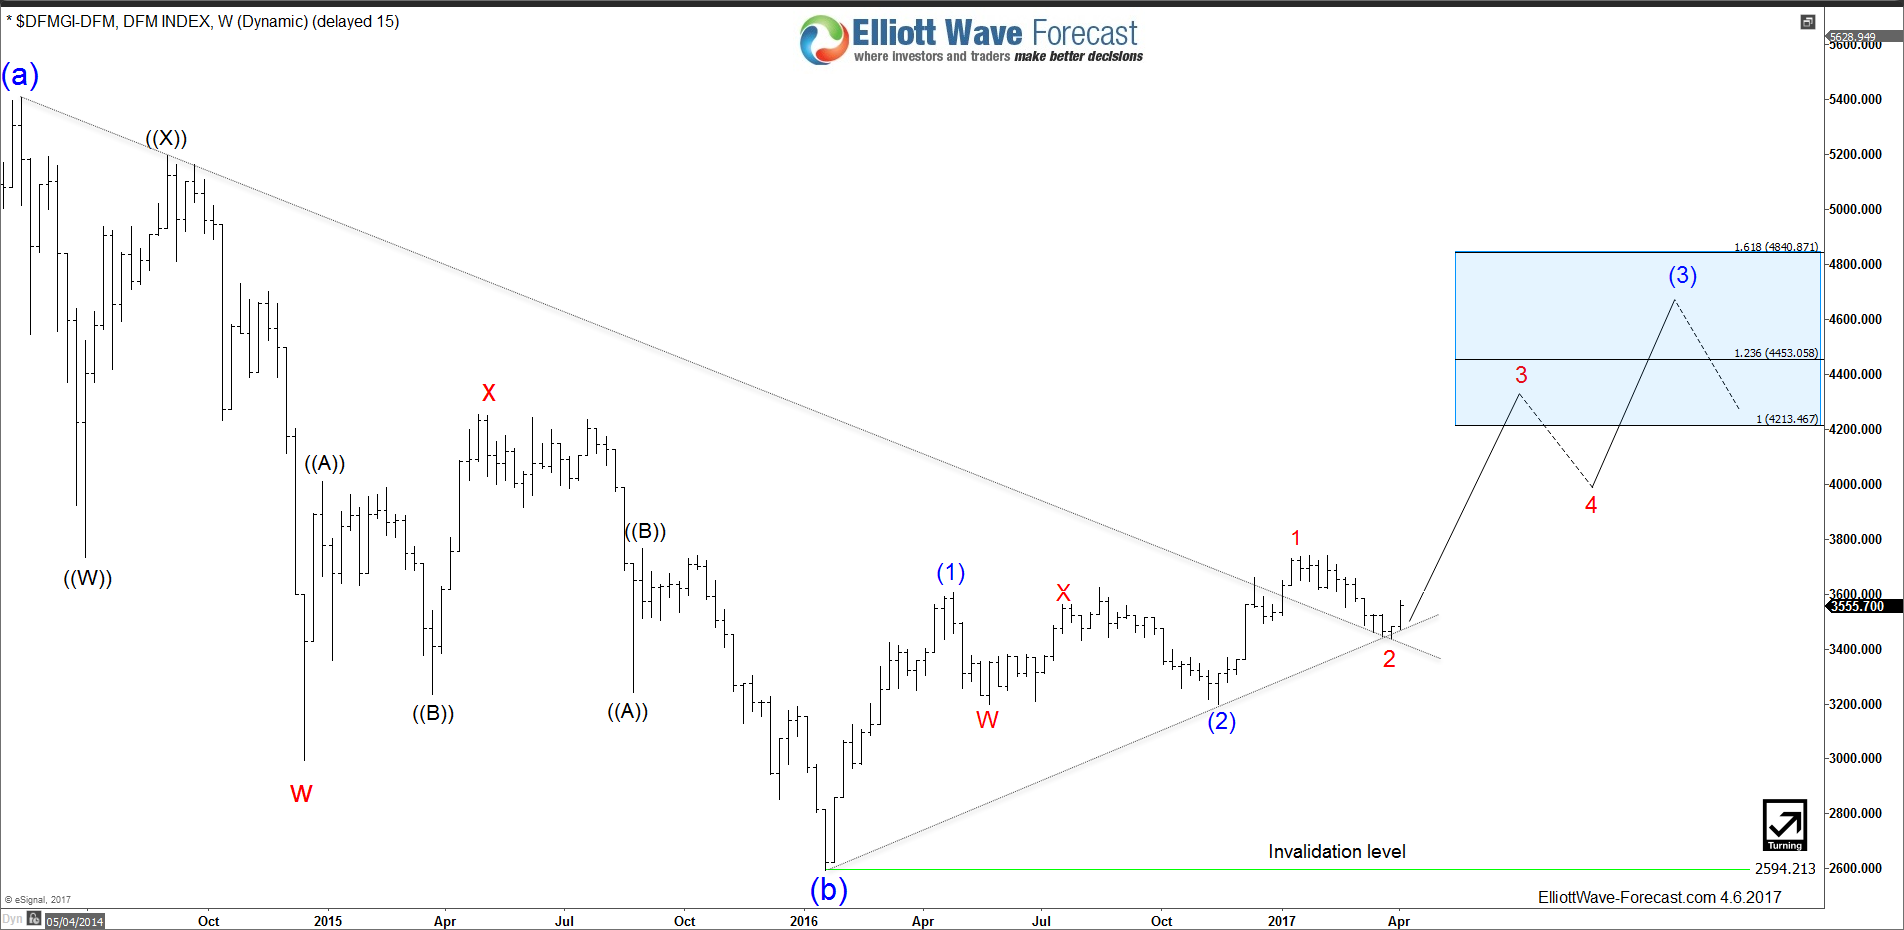
Zooming out to the weekly chart, we can notice that early this year DFMGI broke above the descending trend-line from 2014 peak which is confirming the bullish reversal started last year. Consequently if the Index manage to resume higher then the next target for the bulls would come around 4213 – 4840 area.
In case DFMGI holds below February peak and the pivot at November low gives up , then the Index could have ended the whole cycle from 2016 low and it will be looking to do a deeper correction toward the 50%-61.8 % Fibonacci area ( 3169 – 3034 ) before it can resume the move higher.
Recap:
DFMGI is one of the important Indices in the Middle East , its sharing the same cycle with the rest of world Indices and suggesting that there should be more upside to come if it manage to hold above November 2016 low. A deeper correction may happen but the Index will remain supported as it ended a corrective cycle and has a bullish structure in the bigger time frames.
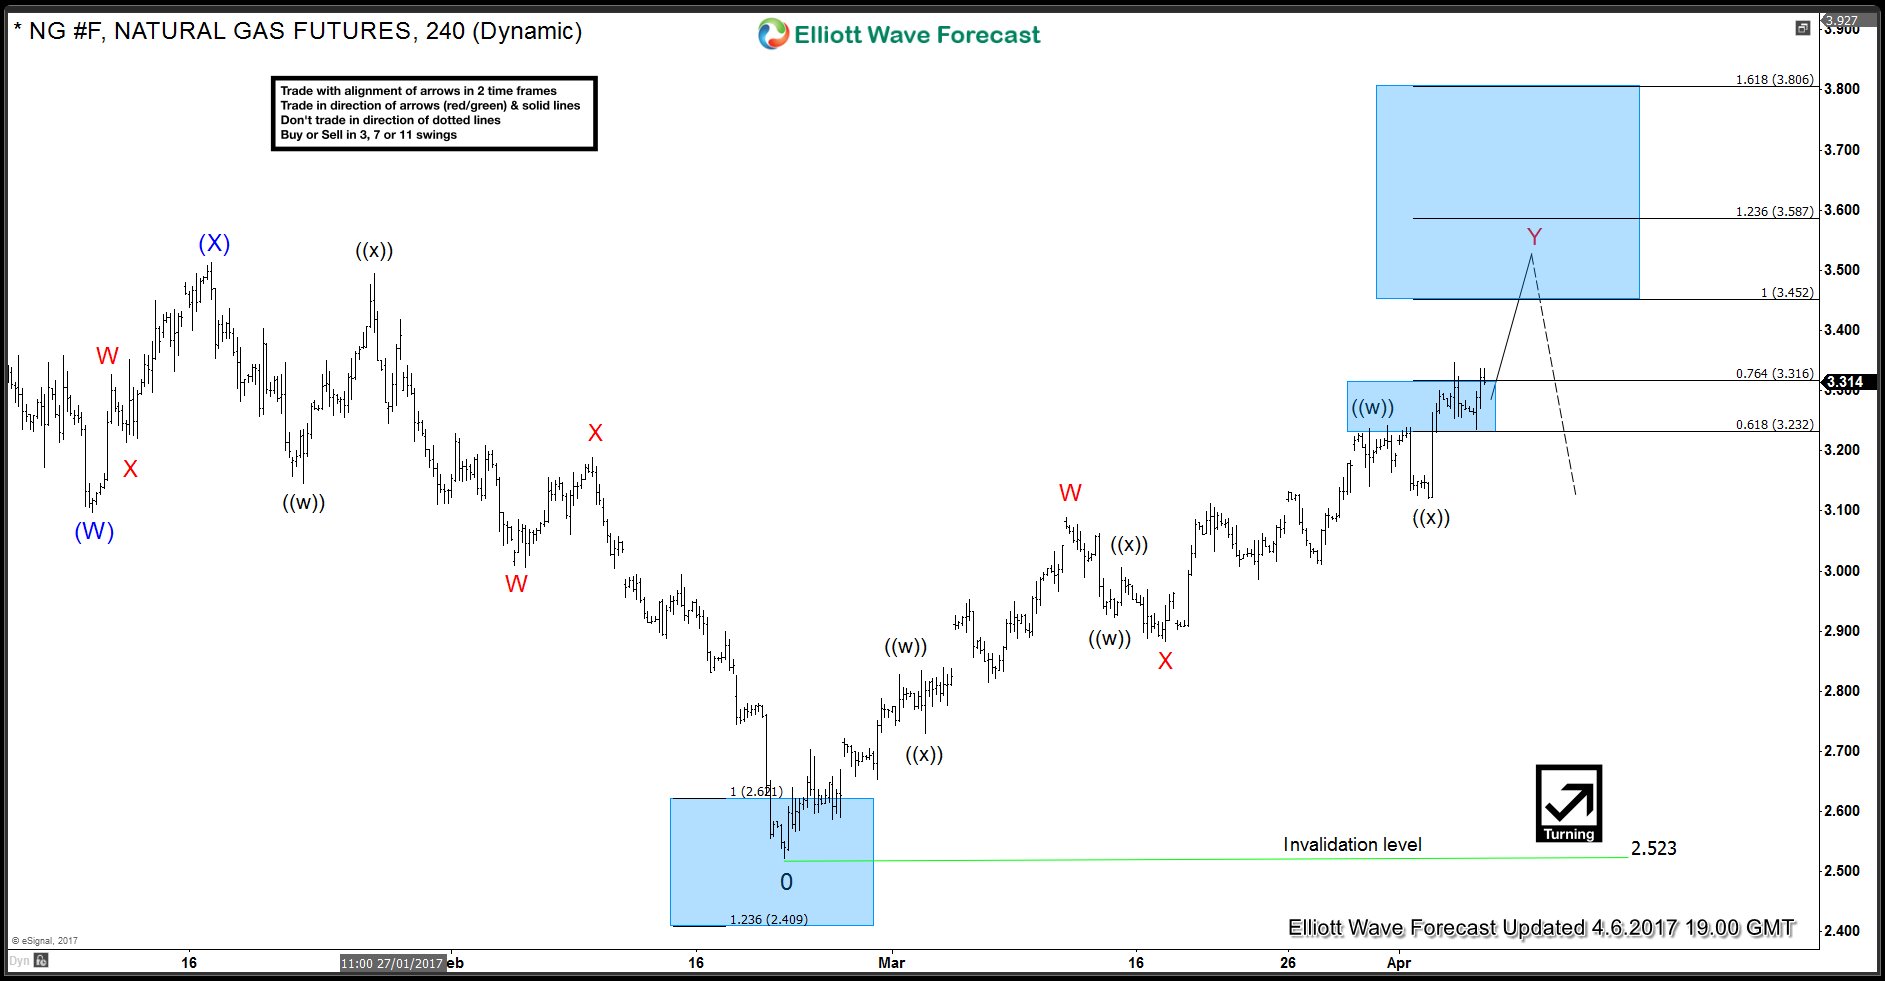
NG #F (Natural Gas) has been rallying since forming a low on 2/22 (2.523). Rally is unfolding as a WXY or double three Elliott Wave Structure where wave W completed at 3.089 and wave X completed at 2.882. Up from red X low, Natural Gas is showing 5 swings up which means the sequence is incomplete and while above black ((x)) low at 3.121, rally should continue higher towards 3.452 – 3.587 to complete 7 swings sequence from red X low. This would also complete a WXY structure from 2.523 low and then we should see a 3 wave pull back in NG #F either to correct the cycle from 2.523 low or at least from red X low.
NG #F (Natural Gas) 4 Hour Elliott Wave Chart
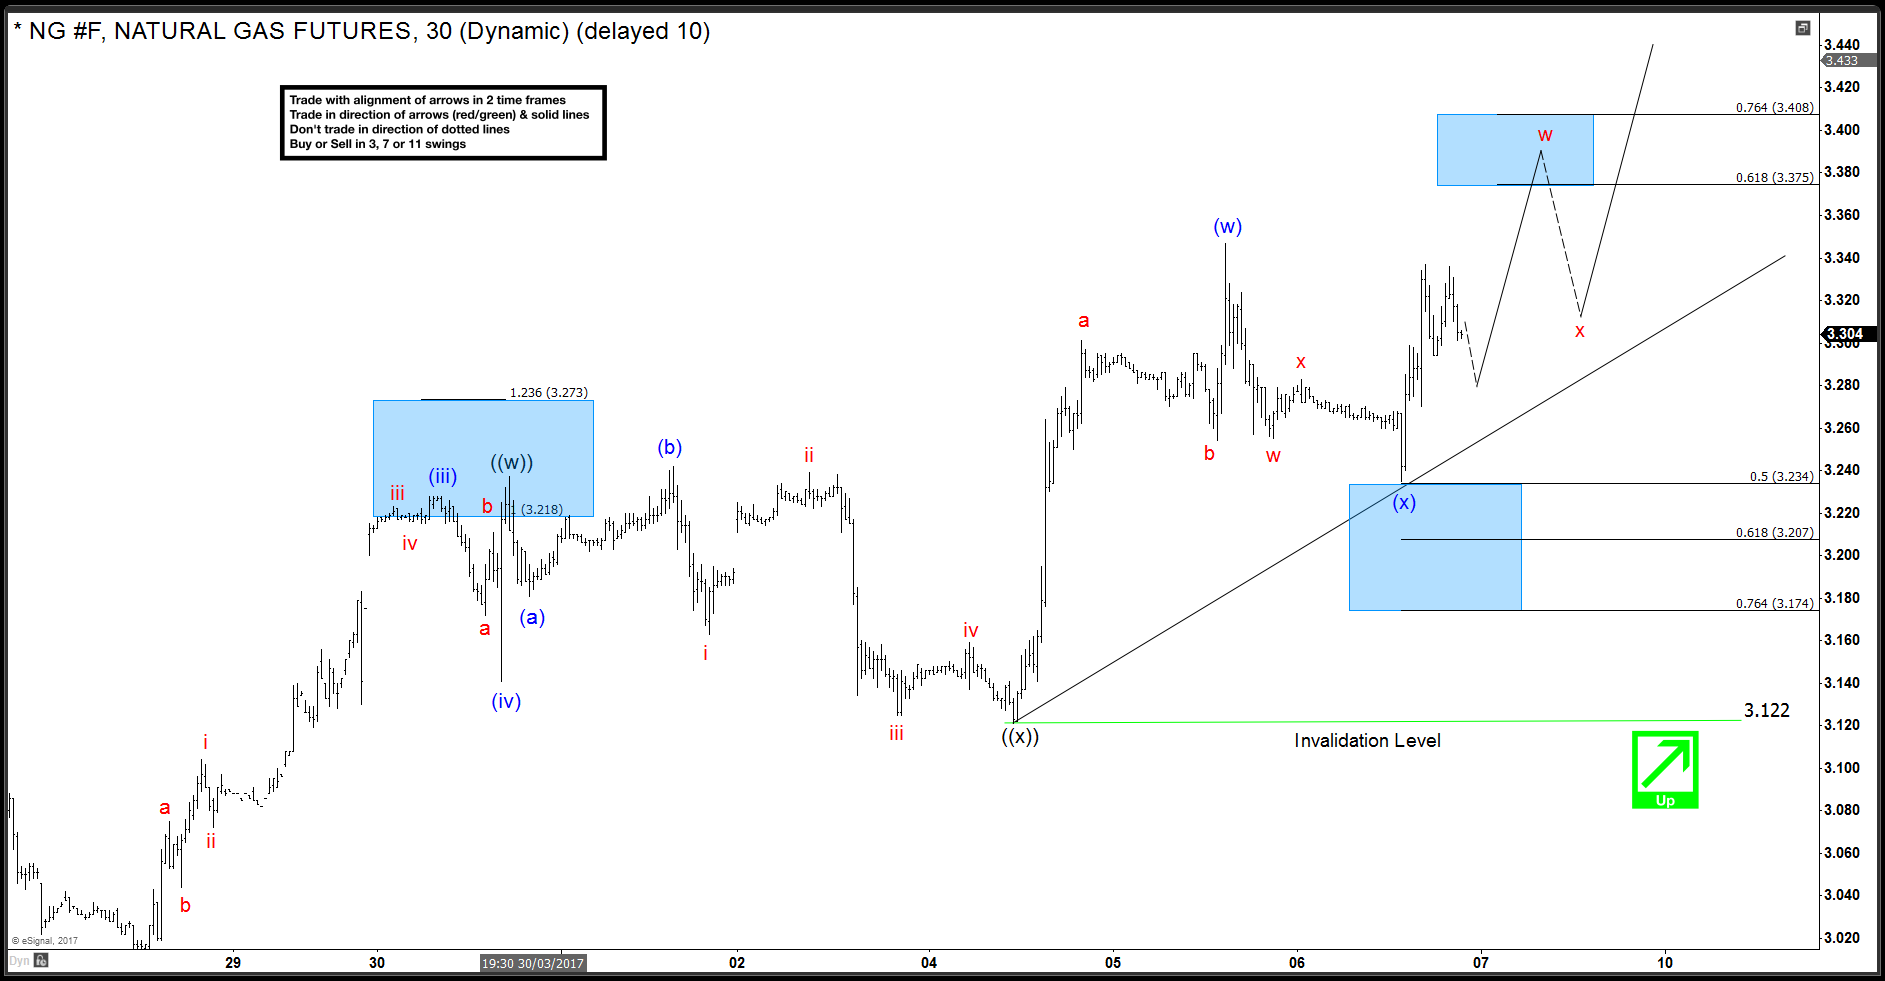
NG #F (Natural Gas) 1 Hour Elliott Wave Chart
Rally to 3.237 completed wave ((w)) which was followed by a FLAT correction to 3.121 which completed wave ((x)). Up from there, it rallied in 3 waves to 3.347 to complete wave (w) and then did a 3 wave pull back to 50 Fibonacci retracement level at 3.234 which we think completed wave (x). Today, Natural Gas started rallying again and now it needs to break above 3.347 (w) high to confirm wave (x) completed at 3.234 and wave (y) higher is in progress. Until 3.347 high doesn't break a test of 3.224 – 3.197 area can’t be ruled out to complete a double three correction in wave (x). Break above 3.347 would initially expose a test of 3.375 – 3.408 area and from there we can see another 3 wave pull back followed by the next leg higher towards 3.461 – 3.514 area which is the 100 – 123.6 Fibonacci extension area of (w)-(x) and will coincide with 100% Fibonacci extension of higher degree red W-X at 3.452.
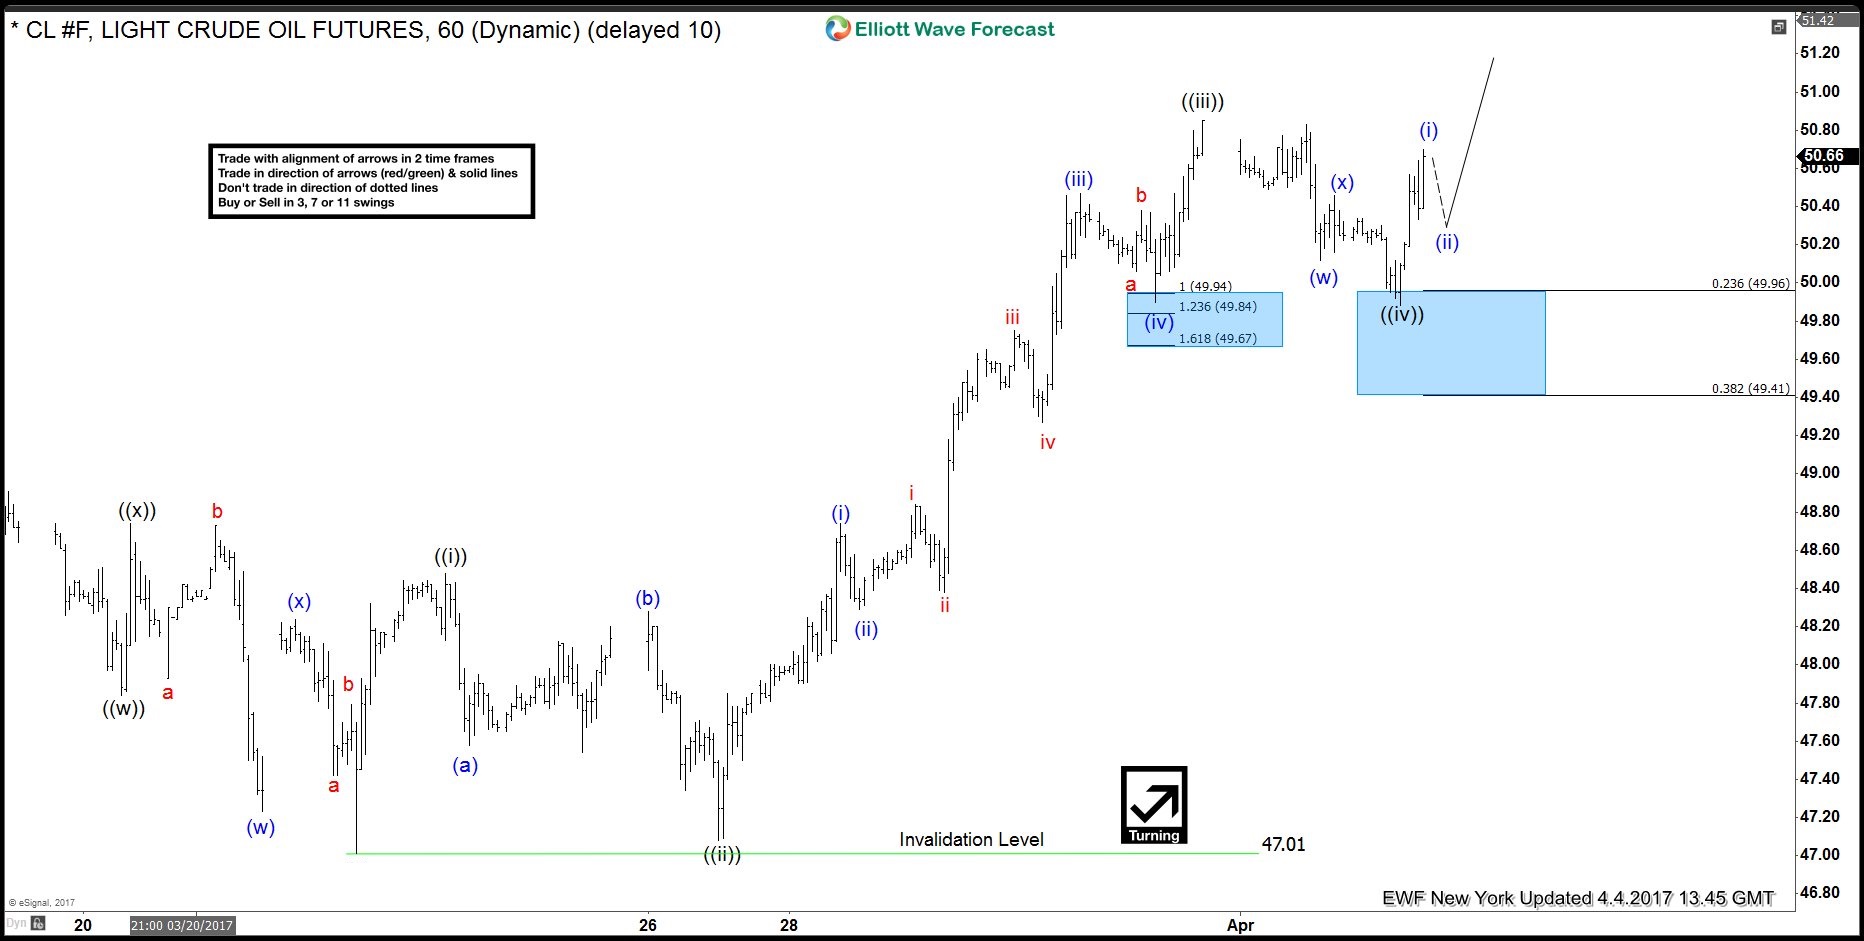
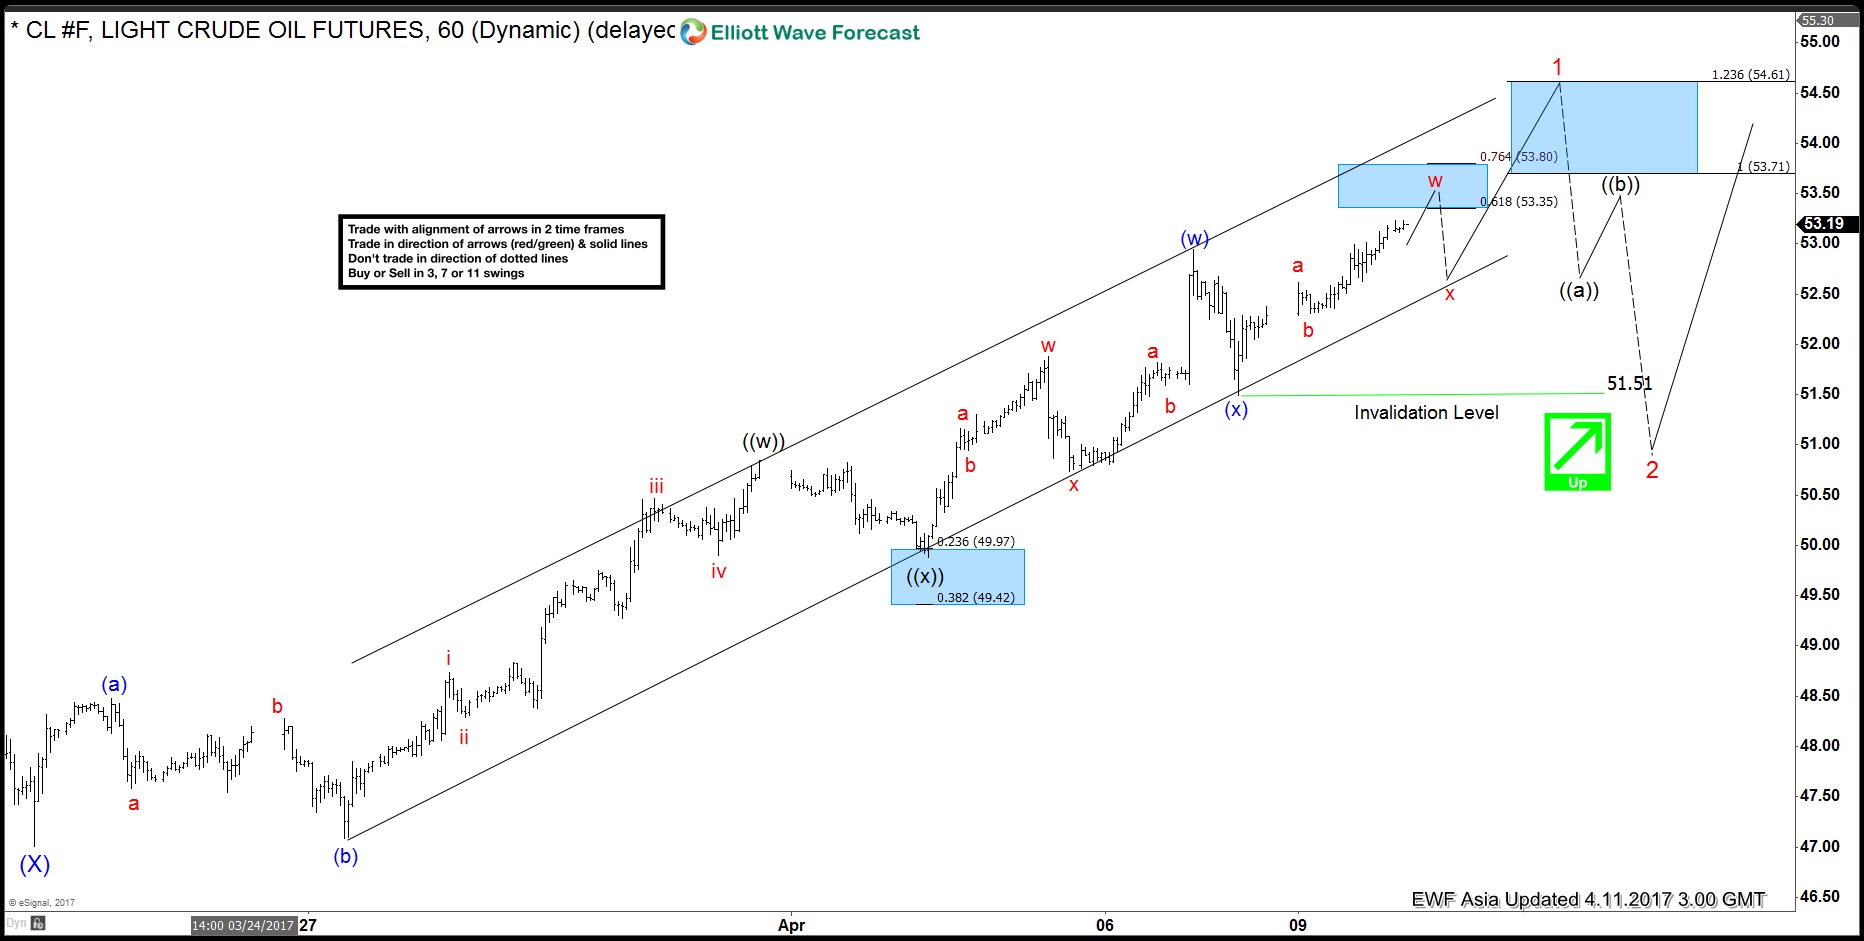
Short term Elliott Wave view in Crude Oil (CL_F) suggests that cycle from 3/22 low (47.01) is unfolding as a double three Elliott wave structure where Minute wave ((w)) ended at 50.85 and Minute wave ((x)) ended at 49.88. Minute wave ((y)) is in progress and the internal is unfolding also as a double three Elliott wave structure where Minutte wave (w) ended at 52.94 and Minutte wave (x) pullback ended at 51.49. Near term, while pullbacks stay above 51.51, focus is on 53.71 – 54.61 area to complete Minor wave 1 and end cycle from 3/22 low, then Crude Oil should pullback in Minor wave 2 to correct cycle from 3/22 low before the rally resumes. We don’t like selling CL_F and expect buyers to appear once Minor wave 2 pullback is complete in 3, 7, or 11 swing for an extension higher.