Elliott Wave Analysis by EWF

Baidu (NASDAQ: BIDU) has declined 20% year-to-date, underperforming the broader market. However, the stock now shows signs of bottoming. Today, we analyze the Elliott Wave structure behind this pullback. Our analysis reveals BIDU is approaching its next technical reversal zone. We also explain the potential bullish path ahead for the stock.

Elliott Wave Analysis

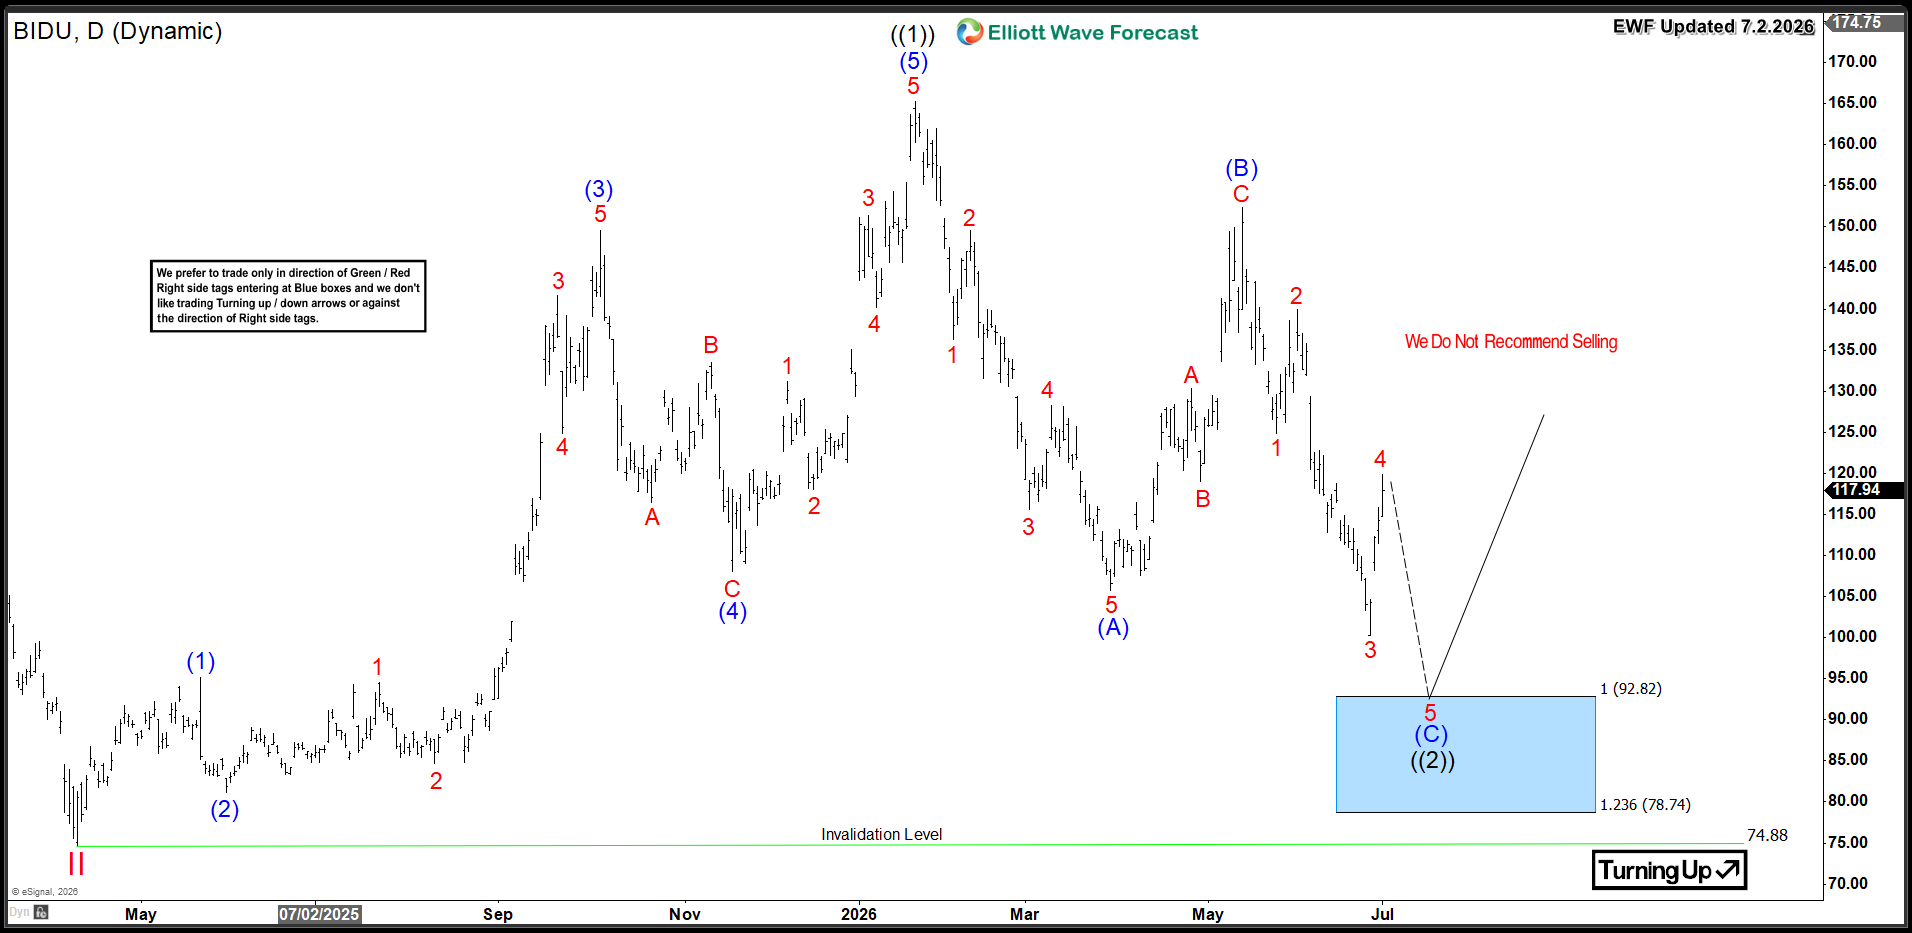
BIDU completed a 5‑wave rally from April 2025 low, peaking at $165. The stock then began a 3‑wave Zigzag correction. Wave (A) dropped to $106, followed by wave (B) rebound to $152. Wave (C) continues lower, still unfolding.

The decline in wave (C) needs another leg down to complete 5 waves, ideally reaching the $92–$78 Blue Box area where buyers often step in at equal legs extreme zones. This area should spark a bullish reversal that could launch a new upside cycle or at minimum trigger a 3‑wave bounce correcting the entire decline.

BIDU Daily Chart 7.2.2026

Baidu BIDU Daily Chart

Conclusion​

Baidu’s daily correction is entering its final phase, with a potential dip below $100 to complete the move lower and reach the buying area, so traders should focus on strategic entry points during this corrective dip while anticipating a reversal by year end.

Source: https://elliottwave-forecast.com/stock-market/baidu-bidu-bullish-turnaround-below-100/
 
Hello traders. In this technical article we’re going to take a quick look at the Elliott Wave charts of FTSE Index published in members area of the website.

As our members know, FTSE made a pullback that unfolded as an Elliott Wave Zig Zag pattern. Price completed a clear 3-wave move down from the peak and found support at the Equal Legs zone (buying area).

In the following analysis, we explain the Elliott Wave pattern and the market outlook.

FTSE Elliott Wave 1 Hour Chart 06.22.2026​

FTSE is currently forming an intraday three-wave pullback from recent highs. We identified a buying zone by measuring the Equal Legs area using the Fibonacci extension tool, with a projected relative to b. The ideal support area comes in at 10370.44-10275.23. The correction is not complete yet, and the index could see more downside in the near term within the marked buying zone. As long as price holds within this region, we expect buyers to step in and the rally to resume toward new highs.

You can learn more about Elliott Wave Patterns at our​

90% of traders fail because they don’t understand market patterns. Are you in the top 10%? Test yourself with this advanced Elliott Wave Test

FTSE

FTSE Elliott Wave 1 Hour Chart 07.03.2026​

The Index has found buyers at the Equal Legs zone , just as expected. The correction ended at the 10333.17 low, and since then, FTSE is giving us a rally. As a result, any long positions from the equal legs zone are now risk-free.

Important note: Our analysis is not based on Elliott Wave in isolation. We perform detailed higher-time-frame cycle analysis, which shows an incomplete market structure. This is one of the key drivers of price action, along with correlation analysis and broader market context.

We also teach our members in live analysis sessions how to identify incomplete bullish and bearish sequences. Even a 14-day trial, is enough to noticeably improve your trading analysis and forecasting approach.

FTSE

Source: https://elliottwave-forecast.com/st...orecasting-the-rally-after-a-3-wave-pullback/
 
Hello fellow traders. In this technical block we’re going to take a quick look at the Elliott Wave charts of NIFTY Index published in members area of the website.

Recently, NIFTY formed a 3-wave pullback after a 5-wave rally, a textbook example of an Elliott Wave bullish sequence. Price completed a clear 3-wave move down from the peak and found support at the Equal Legs zone (buying area).

In the following analysis, we explain the Elliott Wave pattern and the market outlook.

NIFTY Elliott Wave 1 Hour Chart 06.23.2026​

NIFTY is forming an intraday 3-wave pullback from recent highs. We identified this pullback as an Elliott Wave Zig Zag pattern. As our members know , the buying zone is derived by measuring the Equal Legs area using the Fibonacci extension tool. The ideal support area comes in at 23876.66–23695.88. At that zone, we expect buyers to step in and take control, pushing price higher toward new highs.

You can learn more about Elliott Wave Patterns at our​

90% of traders fail because they don’t understand market patterns. Are you in the top 10%? Test yourself with this advanced Elliott Wave Test


NIFTY Elliott Wave 1 Hour Chart 06.23.2026​

NIFTY index has found buyers at the Equal Legs zone, just as expected. We saw a decent reaction from that area, and price rallied toward new highs as anticipated. As a result, long positions taken from the Equal Legs zone are now risk-free. We expect the index to continue finding buyers in a 3-7-11 swing structure, as long as the pivot low at 2307.12 holds.

Important note: Our analysis is not based on Elliott Wave in isolation. We perform detailed higher-time-frame cycle analysis, which shows an incomplete market structure. This is one of the key drivers of price action, along with correlation analysis and broader market context.

We also teach our members in live analysis sessions how to identify incomplete bullish and bearish sequences. Even a 14-day trial, is enough to noticeably improve your trading analysis and forecasting approach.


Source: https://elliottwave-forecast.com/st...ly-after-a-3-wave-pullback-into-support-zone/
 
Fortinet (NASDAQ: FTNT) extended its upside move above our previous $140 target. Today, we analyze the current Elliott Wave structure. Our analysis focuses on this upside extension and the projected target for the current cycle.

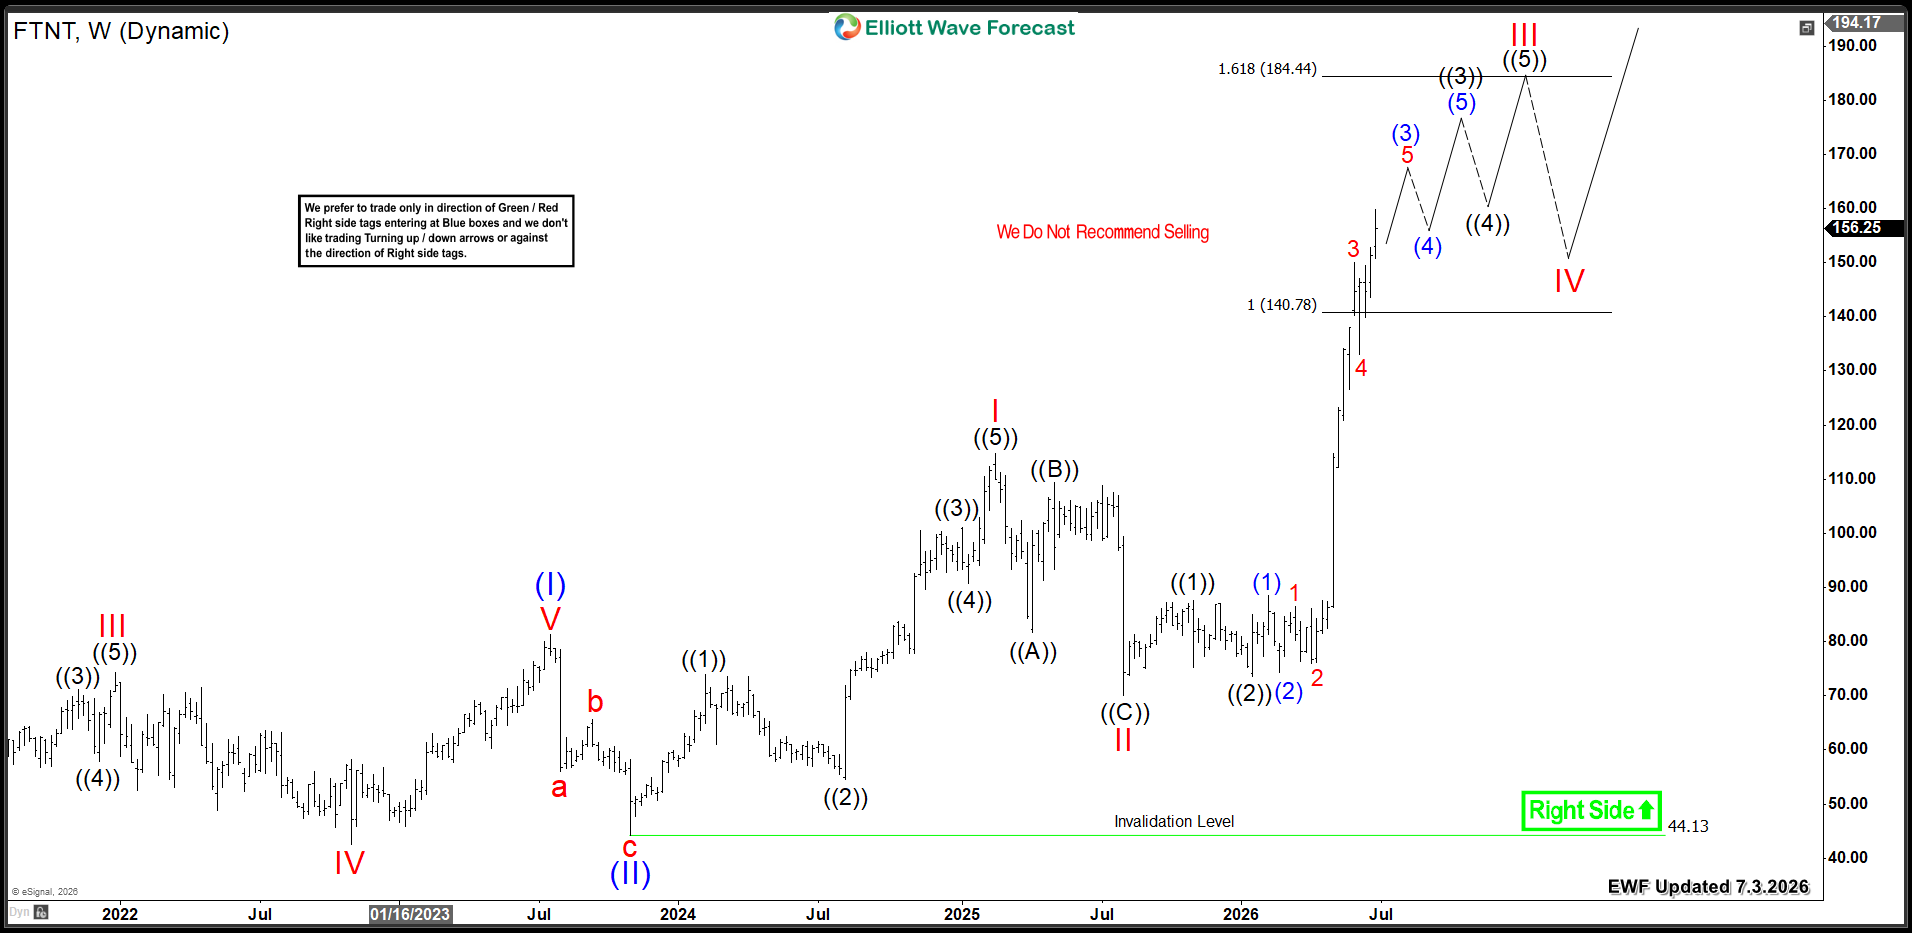
Fortinet is currently within the strongest leg of its impulsive cycle. The stock is extending higher in wave (3) of ((3)) of III. It broke above the $140 target area. The nesting structure from the lows continues unfolding as expected. This strong third wave ideally reaches the 1.618 Fibonacci extension at $184. The cycle usually pushes prices beyond that target. Consequently, we expect the stock to remain supported during wave IV pullbacks. Then, it will look for another extension in wave V.

Fortinet's incomplete bullish sequence suggests wave III will extend further above the $180 golden ratio. Eventually, it should break above $200 as the five-wave structure unfolds.

Fortinet FTNT Weekly Chart 7.3.2026​

FTNT Weekly Chart

Conclusion​

FTNT's impulsive bullish cycle operates at full power and the stock continues seeking further upside extension. Therefore, investors should target buying opportunities within daily and weekly pullbacks.

Source: https://elliottwave-forecast.com/stock-market/ftnt-gains-momentum-targeting-200-milestone/
 
In this Elliott Wave update, we take a look at the long-term structure in Invesco S&P 500 Equal Weight Health Care ETF ($RSPH). The ETF appears to be breaking out after nearly 5 years of sideways consolidation, and the latest price action suggests a larger bullish sequence may now be underway. More importantly, the structure points to the potential for $40+ in the next few quarters if the current breakout continues to develop.

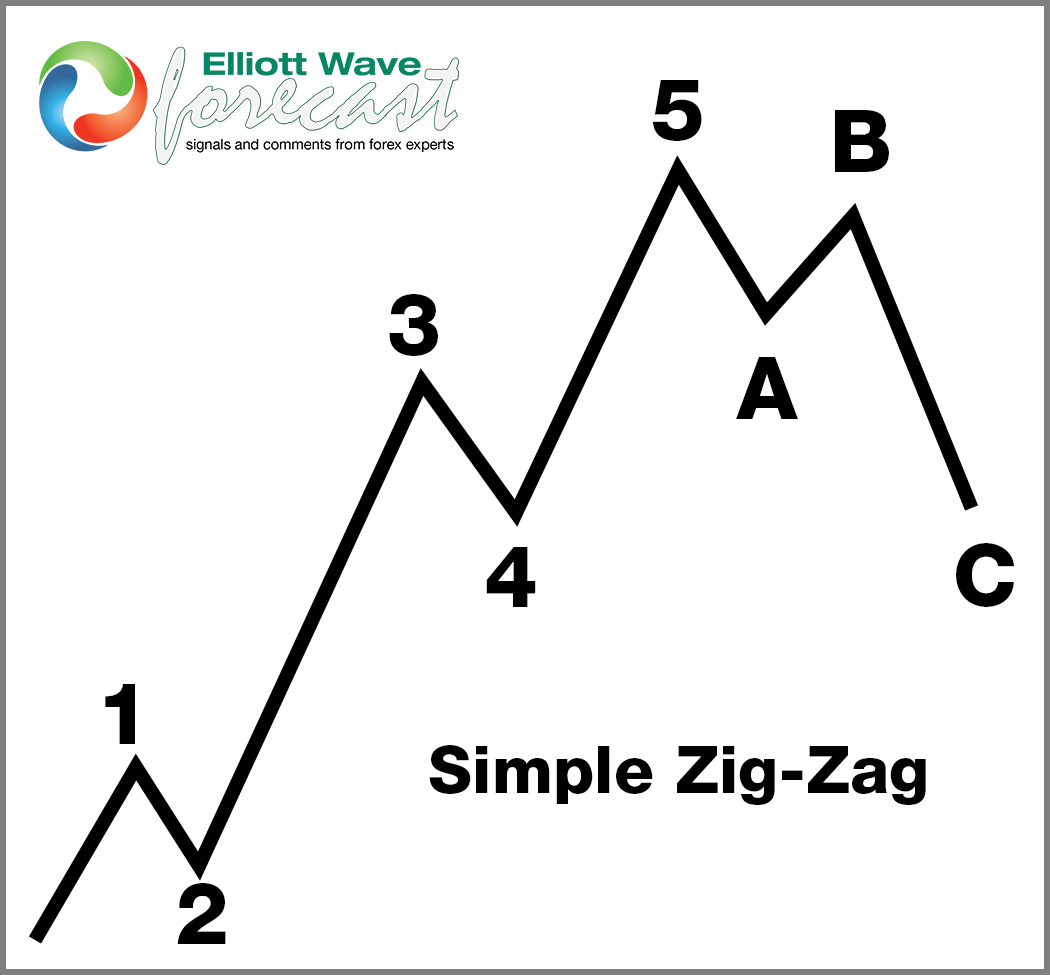
5 Wave Impulse + ABC correction​

$AMD

$RSPH Spent Nearly 5 Years in Sideways Consolidation​

$RSPH

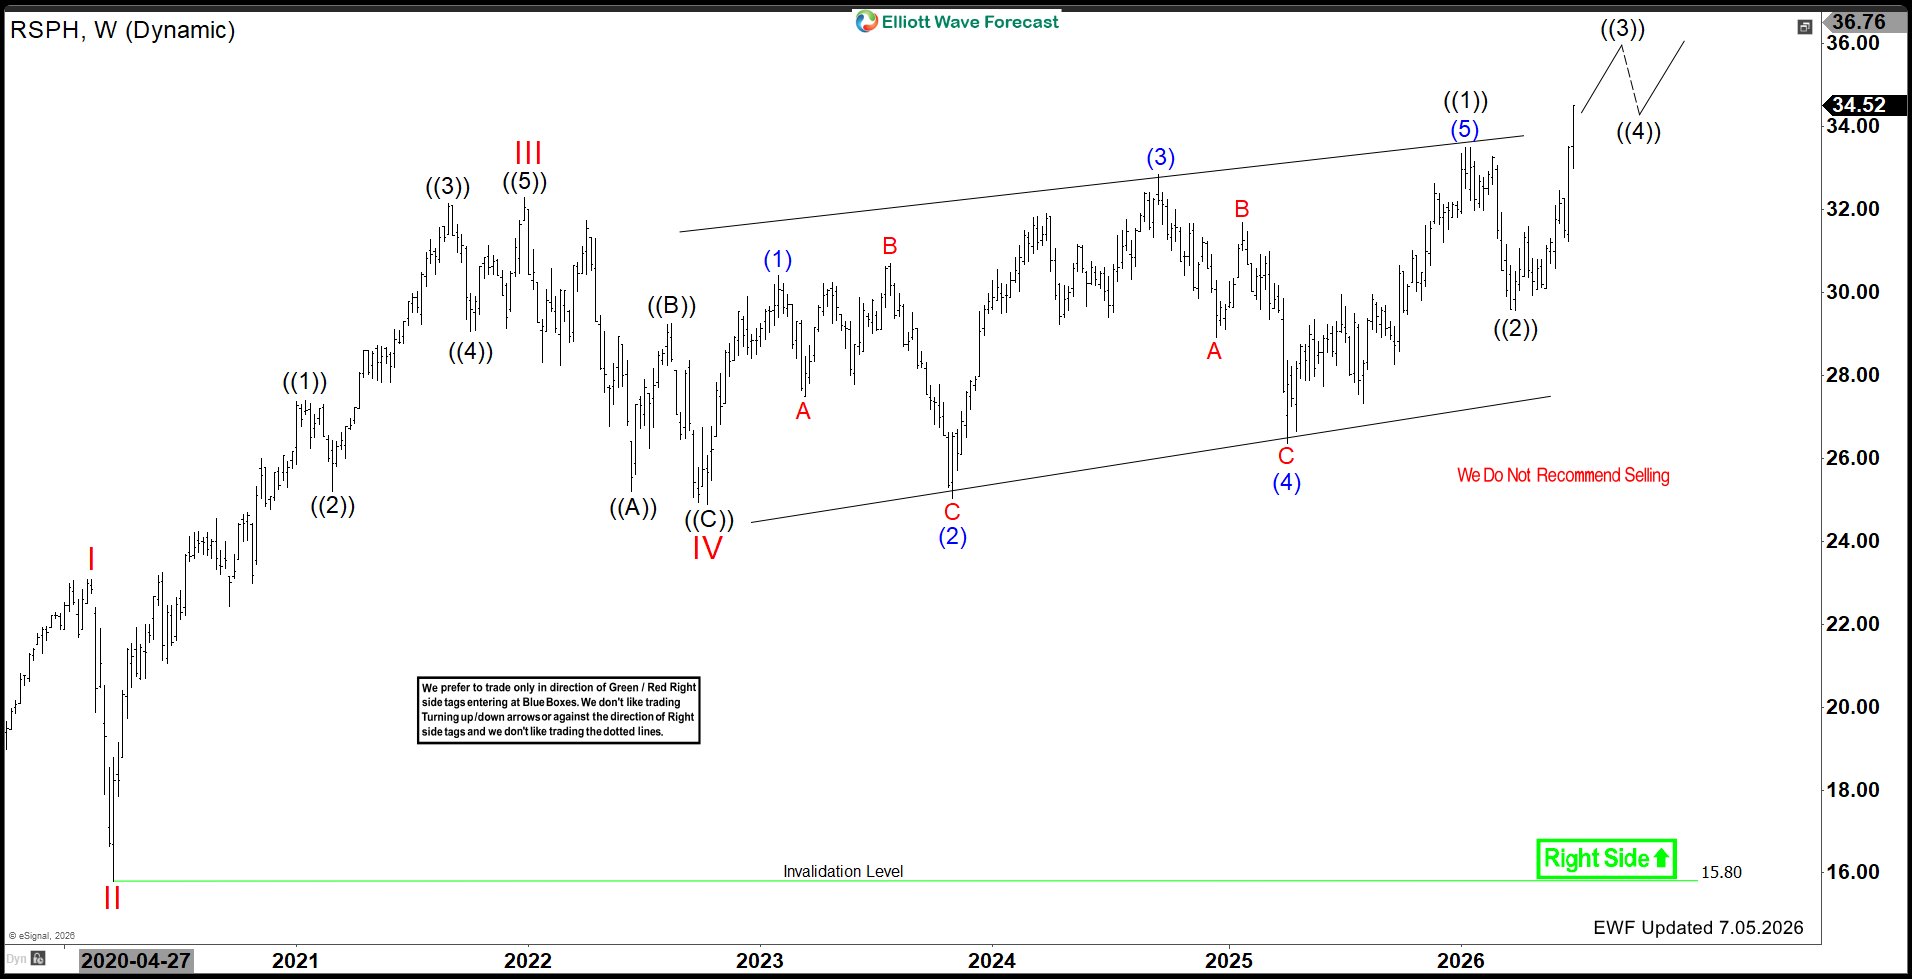
Looking at the weekly chart, $RSPH has traded in a broad sideways range for several years. Since 2021, price has moved in overlapping swings rather than a sustained trend, which supports the idea of a prolonged consolidation phase.

That long base matters because markets often build energy during these multi-year consolidations before a larger directional move begins. In this case, the recent push higher suggests $RSPH may finally be starting to resolve that range to the upside.

5-Wave Diagonal From 2022 Ended in January 2026​

From the 2022 low, $RSPH advanced in what looks like a 5-wave diagonal, and that structure appears to have ended in January 2026. After that peak, the ETF turned lower in a corrective move rather than continuing higher right away.

This is important because ending diagonals often mark the completion of one bullish leg before a pullback takes place. Therefore, the decline that followed January 2026 fit well as a correction rather than the start of a larger bearish trend.

March 30, 2026 Low May Have Completed Wave ((2))​

After the January 2026 high, $RSPH pulled back and appears to have found an important low on March 30, 2026. From an Elliott Wave perspective, that decline can be counted as wave ((2)).

If that view is correct, then the ETF has already started wave ((3)) to the upside. That would explain the strong rebound from the March 30 low and the recent breakout above the upper boundary of the multi-year consolidation structure.

Breakout Suggests More Upside Is Ahead​

Most importantly, $RSPH now looks to be breaking out of the long consolidation range. This breakout improves the bullish outlook because it suggests the market is transitioning from a sideways environment into a trending phase.

As long as the breakout holds, the next leg higher can continue to extend. Consequently, the current structure supports the idea that $RSPH can work its way toward $40+ in the next few quarters.

Why $40+ Is in Focus​

The $40+ area stands out as the next meaningful upside objective as wave ((3)) continues to unfold. Third waves often carry strong momentum, especially when they begin after a long consolidation and a completed corrective pullback.

For that reason, if buyers continue to defend the breakout and the March 30 low remains in place, $RSPH can continue to build on the current advance and target higher levels over the medium term.

Near-Term Outlook for $RSPH​

In the near term, the focus remains on whether $RSPH can hold above the breakout area and continue printing higher highs and higher lows. As long as that happens, the bullish sequence remains intact.

Meanwhile, the March 30, 2026 low remains the key reference point. Holding above that low keeps the view alive that wave ((2)) already ended and that wave ((3)) is now in progress.

Technical Summary​

To summarize, $RSPH appears to be breaking out after nearly 5 years of sideways consolidation. The 5-wave diagonal from 2022 appears to have ended in January 2026, and the pullback likely found its low on March 30, 2026.

Video Analysis​


[video width="1920" height="1080" mp4="[URL]https://elliottwave-forecast.com/wp-content/uploads/2026/07/Debut-2026-07-05-14_10_05.mp4[/URL]" poster="[URL]https://elliottwave-forecast.com/wp-content/uploads/2026/07/rsph.png[/URL]"][/video]

Source: https://elliottwave-forecast.com/vi...5-years-of-sideways-consolidation-targets-40/
 
Hello traders. In this technical article we’re going to look at the Elliott Wave charts of Apple Stock (AAPL) published in members area of the website. As our members know, we have been calling for a pullback in the stock. As expected, the correction unfolded in a clear three-wave structure before buyers stepped back in. In this discussion, we will break down the Elliott Wave forecast.

AAPL Elliott Wave 4 Hour Chart 06.17.2026​

The current view suggests that AAPL stock has started a new bullish cycle. The stock completed the cycle from the 245 low as an impulsive five-wave structure, which is a bullish confirmation.

As markets rarely move in a single direction, a three-wave correction typically follows a five-wave advance, providing an opportunity to join the trend. At this stage, we can see a sharp decline from the peak, which appears to be unfolding in a five-wave structure, suggesting that another leg lower is still needed.

So far, we have seen only the first leg of the Wave (2) correction, marked as A (red). A three-wave bounce in B (red) has also developed. While price remains below the current short-term high, Wave C (red) should ideally be in play, targeting the 272.4–265.3 area (buying zone).

As Elliott Wave practitioners and our members know, these reversal zones are typically identified by measuring the equal legs area (1.00–1.236 Fibonacci extension of A relative to B), using the Fibonacci extension tool.

Did you know ? 90% of traders fail because they don’t understand market patterns. Are you in the top 10%? Test yourself with this advanced Elliott Wave Test

Official trading strategy on How to trade 3, 7, or 11 swing and equal leg is explained in details in Educational Video, available for members viewing inside the membership area.


AAPL Elliott Wave 4 Hour Chart 06.17.2026​

The stock has made another leg down in Wave C (red) and completed the correction. Unfortunately, it missed our buying zone by a few points and completed the correction slightly above our entry level. This time, the market left us without the trade.It is important to mention that when we miss the optimal entry, we avoid entering in the middle of the move. Instead, we wait for a new setup to develop. At this stage, we would like to see a break above the Wave (1) blue peak to confirm a further bullish extension. Once this breakout occurs, we will look for another three-wave pullback before considering new buying opportunities.

Keep in mind that the market is dynamic, and the proposed view may have changed in the meantime. Our member chat rooms are open 24/7 and provide ongoing expert guidance on market trends and Elliott Wave analysis. Members are encouraged to ask questions about market structure and technical setups at any time.


Source: https://elliottwave-forecast.com/st...-aapl-elliott-wave-forecasting-the-next-move/
 
The VanEck Junior Gold Miners ETF (GDXJ) is designed to mirror the MVIS® Global Junior Gold Miners Index, giving investors targeted access to smaller‑capitalization gold producers across international markets. Because junior miners tend to exhibit greater volatility and higher growth potential, the fund is often viewed as a high‑beta vehicle for trading and investing in gold price trends.

GDXJ Monthly Elliott Wave View​


GDXJ-Monthly20260706121503.jpg


On the monthly timeframe, GDXJ carved out a significant low in 2016 at $16.87. From that base, the ETF began climbing in a layered impulsive advance. The initial wave (I) topped at $52.50, after which a corrective phase in wave (II) pulled prices down to $19.52. Momentum then rebuilt, with wave I of (III) reaching $65.95 before wave II of (III) retraced to $25.64. A powerful extension followed, as wave III of (III) surged to $157.49. The market has since entered a wave IV of (III) correction, which remains unfinished. This suggests that further weakness is possible before the corrective phase concludes and the broader uptrend resumes.

GDXJ Daily Elliott Wave View​


GDXJ Elliott Wave Chart


The daily Elliott Wave structure of GDXJ highlights the internal development of wave (III). The corrective wave II of (III) bottomed at $25.64, while the subsequent wave III of (III) surged to $157.49. That advance unfolded as a textbook five‑wave impulse, subdividing into waves ((1))–((2))–((3))–((4))–((5)). The market has since transitioned into a wave IV correction, which is evolving as a double three. Within this sequence, wave ((W)) completed at $106.59 and wave ((X)) at $136.55. Current price action suggests additional downside potential toward the 100%–161.8% Fibonacci extension of wave ((W)), spanning $49.26–$82.69. This zone is expected to provide support and set the stage for the next upward cycle.

Source: https://elliottwave-forecast.com/st...rs-etf-gdxj-still-has-room-for-more-downside/
 
The rally from June lacks impulsive strength and ends after only three waves higher. This three‑wave structure signals a corrective move, not the start of a sustained bullish trend. Therefore, the advance fits as part of a larger double‑correction pattern still pointing lower.

Moreover, the incomplete downside structure suggests Ford may resume weakness once the connector finishes. The market offered temporary strength, yet that strength aligns with a corrective bounce inside a broader bearish sequence. Consequently, expect renewed downside pressure as the double correction unfolds.

Elliott Wave Outlook: Ford (F) Weekly Chart March 2026

Elliott Wave Outlook: Ford (F) Weekly Chart March 2026

In March, we expect Ford to stay inside a corrective structure that began months earlier. Wave B failed to break the wave (X) high and stalled near 14.80, which confirmed the rally was corrective. After that, price turned sharply lower, keeping the broader bearish sequence intact and signaling that wave C should develop next.

Furthermore, we anticipate an impulsive decline toward the blue‑box area at 8.28–4.26. Buyers typically return in this zone, and that reaction should complete the entire wave II correction. Once this support triggers, Ford should set the stage for a new rally into the next cycle.

(If you want to learn more about Elliott Wave Principle, please follow these links: Elliott Wave Education and Elliott Wave Theory.)

Elliott Wave Principle Behind the Market Structure​

Impulse

An impulse is a clean 5‑wave pattern that drives the trend forward.

  • Waves 1‑3‑5 are strong and directional.
  • No overlap between waves 1 and 4.
  • Wave 3 is usually the strongest.
  • Structure is clear, with increasing momentum

Impulse

Elliott Wave Outlook: Ford (F) Weekly Chart July 2026

Elliott Wave Outlook: Ford (F) Weekly Chart July 2026


The market broke above wave B, which initially suggested a possible bottom. However, we still see only three waves higher, keeping the bearish sequence active and confirming that downside pressure remains dominant.

Moreover, we need an impulse or a leading diagonal from the lows to change the trend. For now, this rebound fits as wave ((X)), and we are building wave ((Y)) of II. This setup implies three more waves lower aiming to break 8.43 before completing the structure.

Source: https://elliottwave-forecast.com/stock-market/ford-f-broke-higher-target-remains-unchanged/
 
Vertex Pharmaceuticals Incorporated (VRTX), operates as Biotechnology company in the United States, Europe & internationally. It offers transformative medicines for people with serious diseases of different age groups. It comes under Healthcare – Biotech sector & trades as “VRTX” ticker at Nasdaq.

In weekly, VRTX confirmed higher high above November-2024 high expected in last article. It should continue rally towards 556.9 – 591 area in shorter cycle within May-2026 sequence. We like to buy the pullback in 3, 7 or 11 swings at extreme area, when reach.

VRTX - Elliott Wave Latest Weekly View:​

VRTX-W12.jpg

In weekly, it placed ((I)) at $306.08 high (July-2020) & ((II)) at $176.36 low (October-2021). Above there, it ended (I) of ((III)) at $519.88 high (November-2024) & (II) at $362.50 low (August-2025). Within (I), it ended I at $292.75 high, II at $233.01 low, III at $510.63 high, IV at $447.70 low & V at $519.88 high. Within extended III, it placed ((1)) at $324.75 high, ((2)) at $282.21 low, ((3)) at $448.40 high, ((4)) at $391.01 low & ((5)) at $510.63 high. It ended (II) in double three correction. It ended w at $377.85 low in December-2024, x at $519.68 high in March-2025 & y at $362.50 low in August-2025.

VRTX - Elliott Wave View From 3.23.2026:​

VRTX-W11.jpg

Above $362.50 low, it ended ((1)) at $507.92 high, ((2)) at $412.27 low & favors rally in ((3)) towards $556.87- $646.41 area. It ended (1) of ((1)) at $403.58 high, (2) at $374.17 low, (3) at $487.52 high, (4) at $450.67 low & (5) at $507.92 high. As expected, it ended ((2)) in price channel against August-2025 before rally continue. Within ((3)), it ended (1) at $456.68 high, (2) at $420.01 low & favors rally in (3). It expects five swings to unfold above $556.87 to finish ((3)). The rally can either in ((3)) as conservative view or can be (1) of ((3)) in more bullish case, if extends more. We like to buy the pullback in 3, 7 or 11 swings at extreme area, when reach.

Source: https://elliottwave-forecast.com/stock-market/vrtx-elliott-wave-forecast-target-at-556-9-646-4/
 
KORU (Direxion Daily MSCI South Korea Bull 3X ETF) delivers 300% daily leveraged exposure to South Korean large‑ and mid‑caps, making it a high‑volatility instrument suited for short‑term tactical trades rather than long‑term investing.


Quick instrument snapshot​

  • Full name: Direxion Daily MSCI South Korea Bull 3X ETF (KORU)
  • Objective: Targets +300% daily performance of the MSCI Korea 25/50 Index (before fees and expenses)
  • Primary listing: NYSE Arca

KORU — Daily Elliott Wave Chart (Update: July 8, 2026)​

KORU Pullback Reaching Blue Box Area, Buyers Eye Potential Turn Higher


The latest daily chart shows the rally from the April 2025 low ending in wave (I) at $1,284.97. The subsequent wave (II) pullback appears to be unfolding as a zigzag corrective pattern:

  • Wave a ended at $580.00.
  • Wave b bounced to $1,111.00.
  • Wave c is targeting the blue‑box area between $422.65 and $259.92.
From that blue‑box zone, buyers may look for a turn higher — either for the next impulsive extension or, at minimum, a three‑wave corrective bounce.

Source: https://elliottwave-forecast.com/st...ue-box-area-buyers-eye-potential-turn-higher/