Elliottwave-Forecast

Master Trader
Feb 17, 2017
2,453
9
84
www.elliottwave-forecast.com
Canopy Growth Corporation (NYSE : CGC) is a Canadian cannabis company. The company was known as Tweed Marijuana Inc. then it was renamed in 2015. As of late September 2018, Canopy became the world's largest cannabis company, based on market capitalization.

Since last December, CGC saw a strong rally achieving 90% gains in just 2 months before starting a correction lower. So before we jump into any conclusion, let's take a look at the bigger picture:

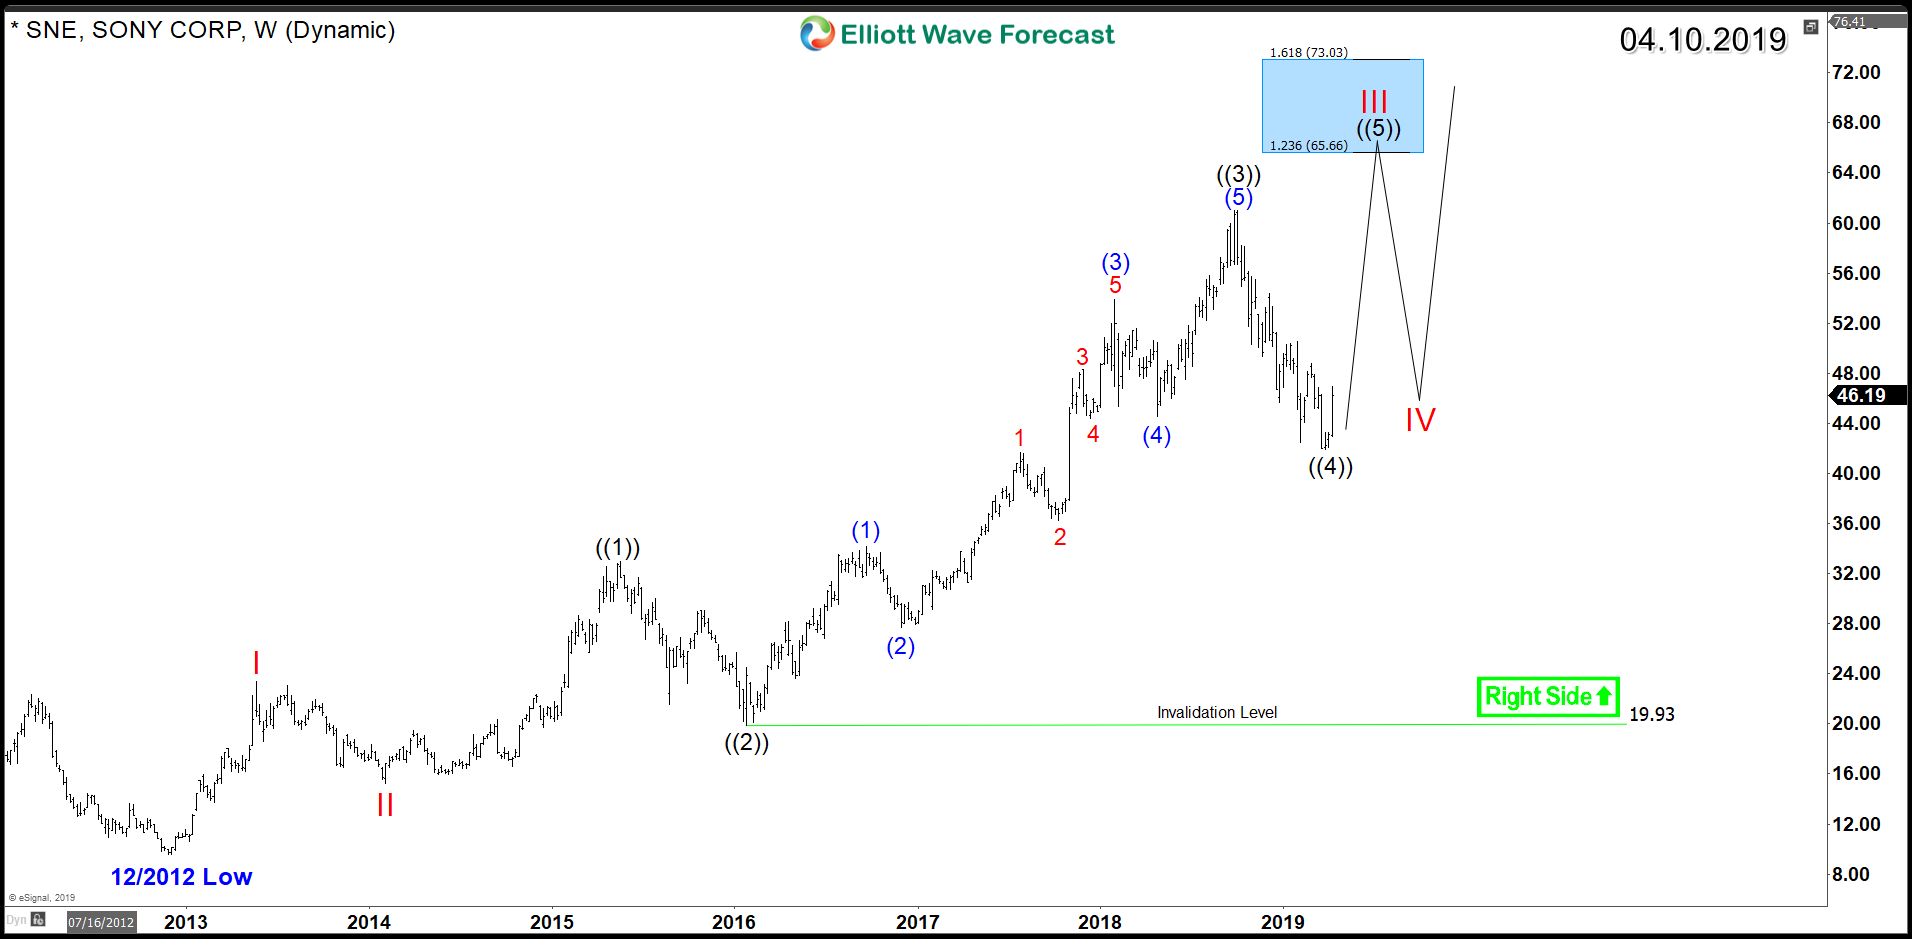
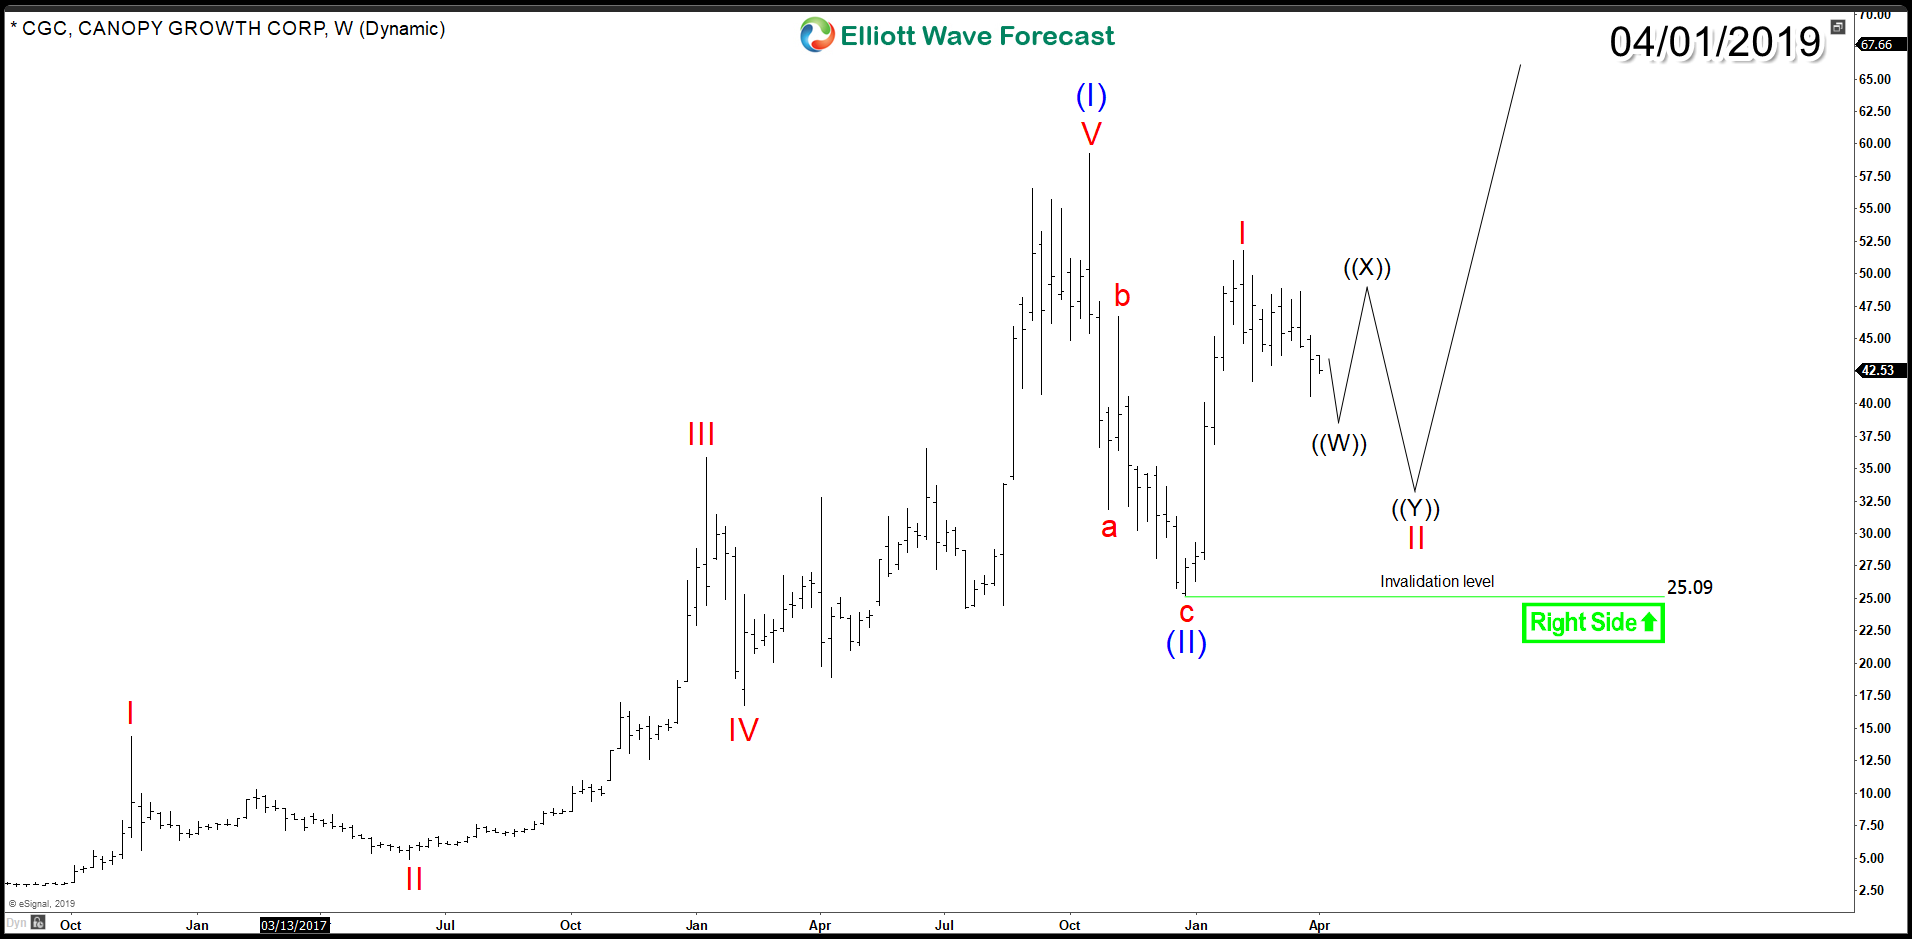
CGC Weekly Chart 4/1/2019


In the above chart, we can see that CGC rallied in an impulsive 5 waves advance since IPO proposed to be the first wave (I) and that cycle ended on October of last year at $59.25 peak. Then down from there, the stock corrected the entire cycle lower in a classical 3 waves zigzag structure which ended on December 2018 at $25.

Therefore, the stock is technically trapped between those two levels and only a break above 2018 peak will be the key to start a new bullish cycle. At this stage, a double correction in wave (II) isn't denied yet but the rally from December low is suggesting a new impulsive structure taking place supporting the bullish scenario.

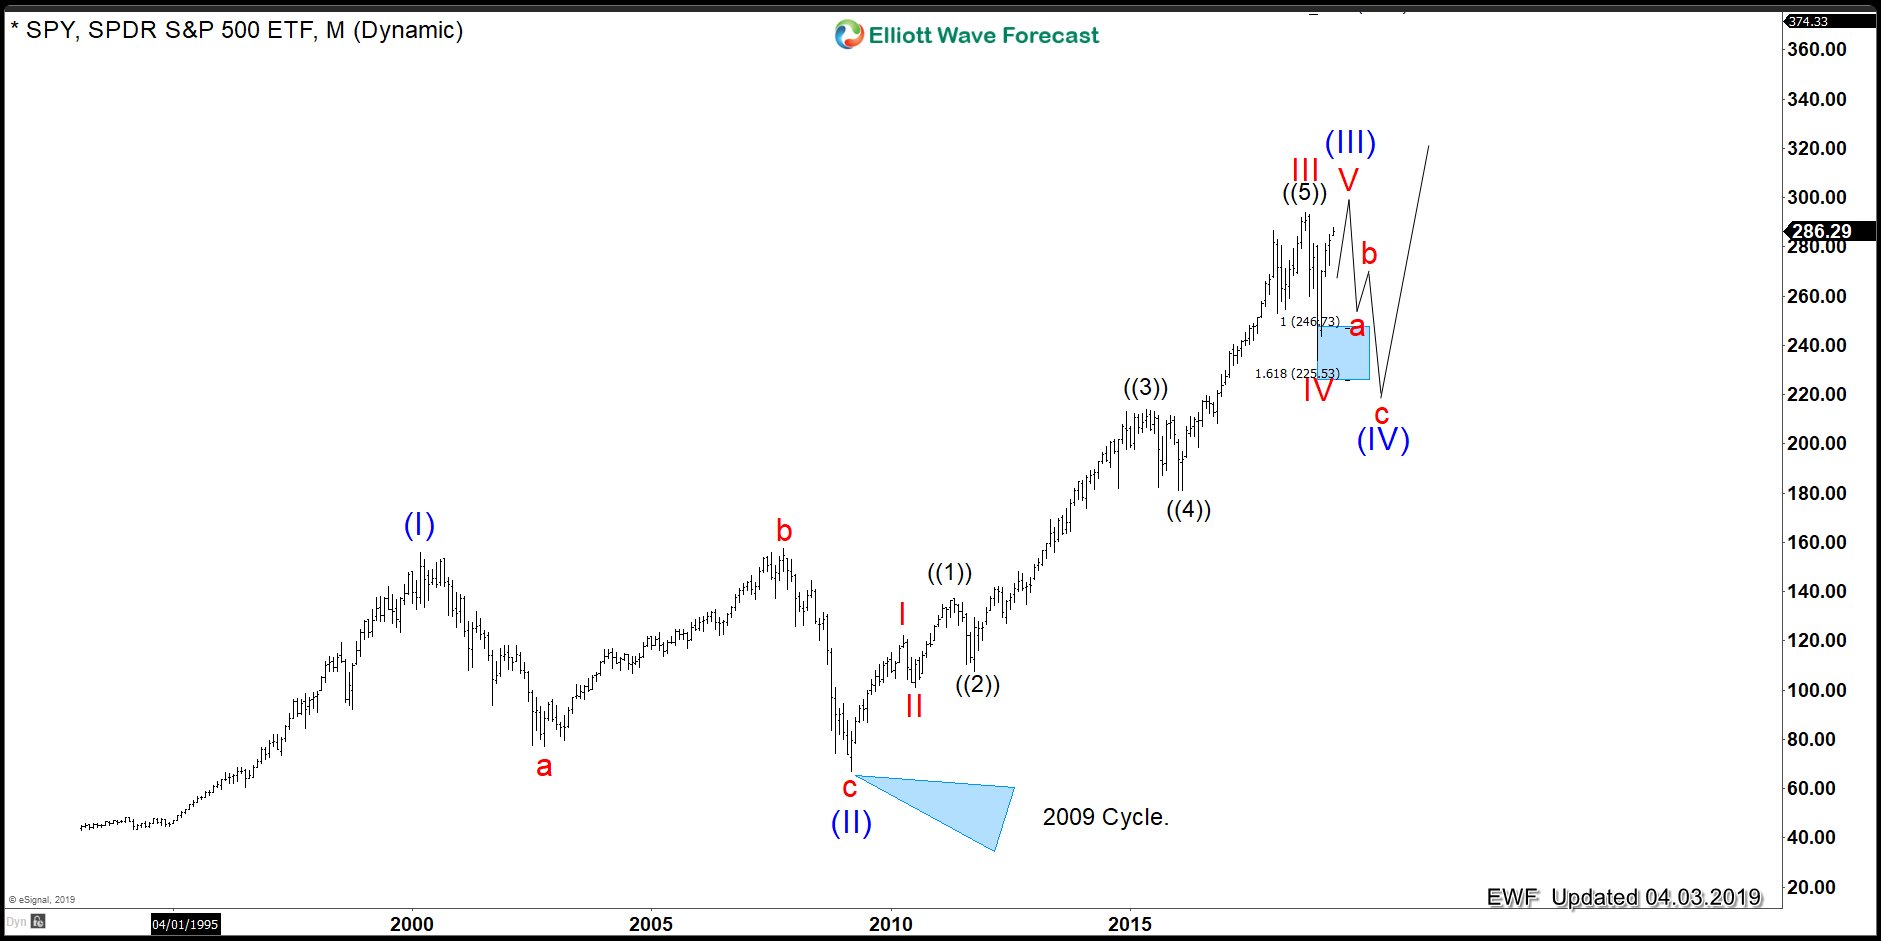
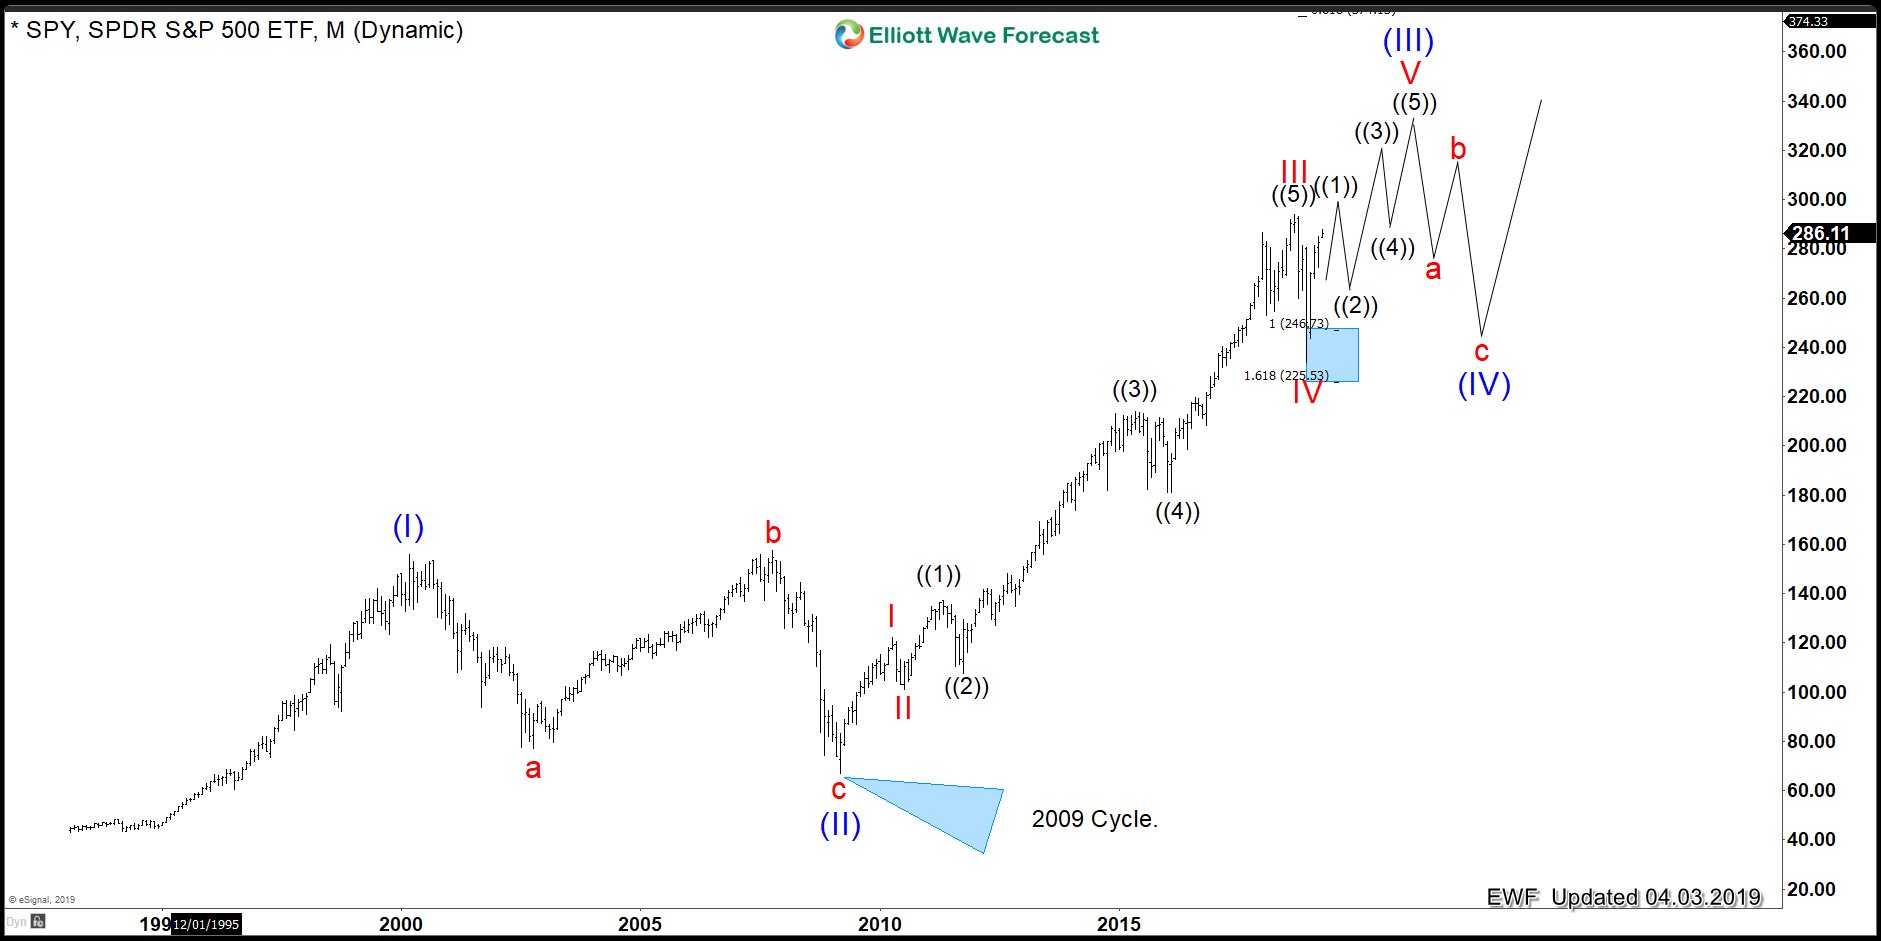
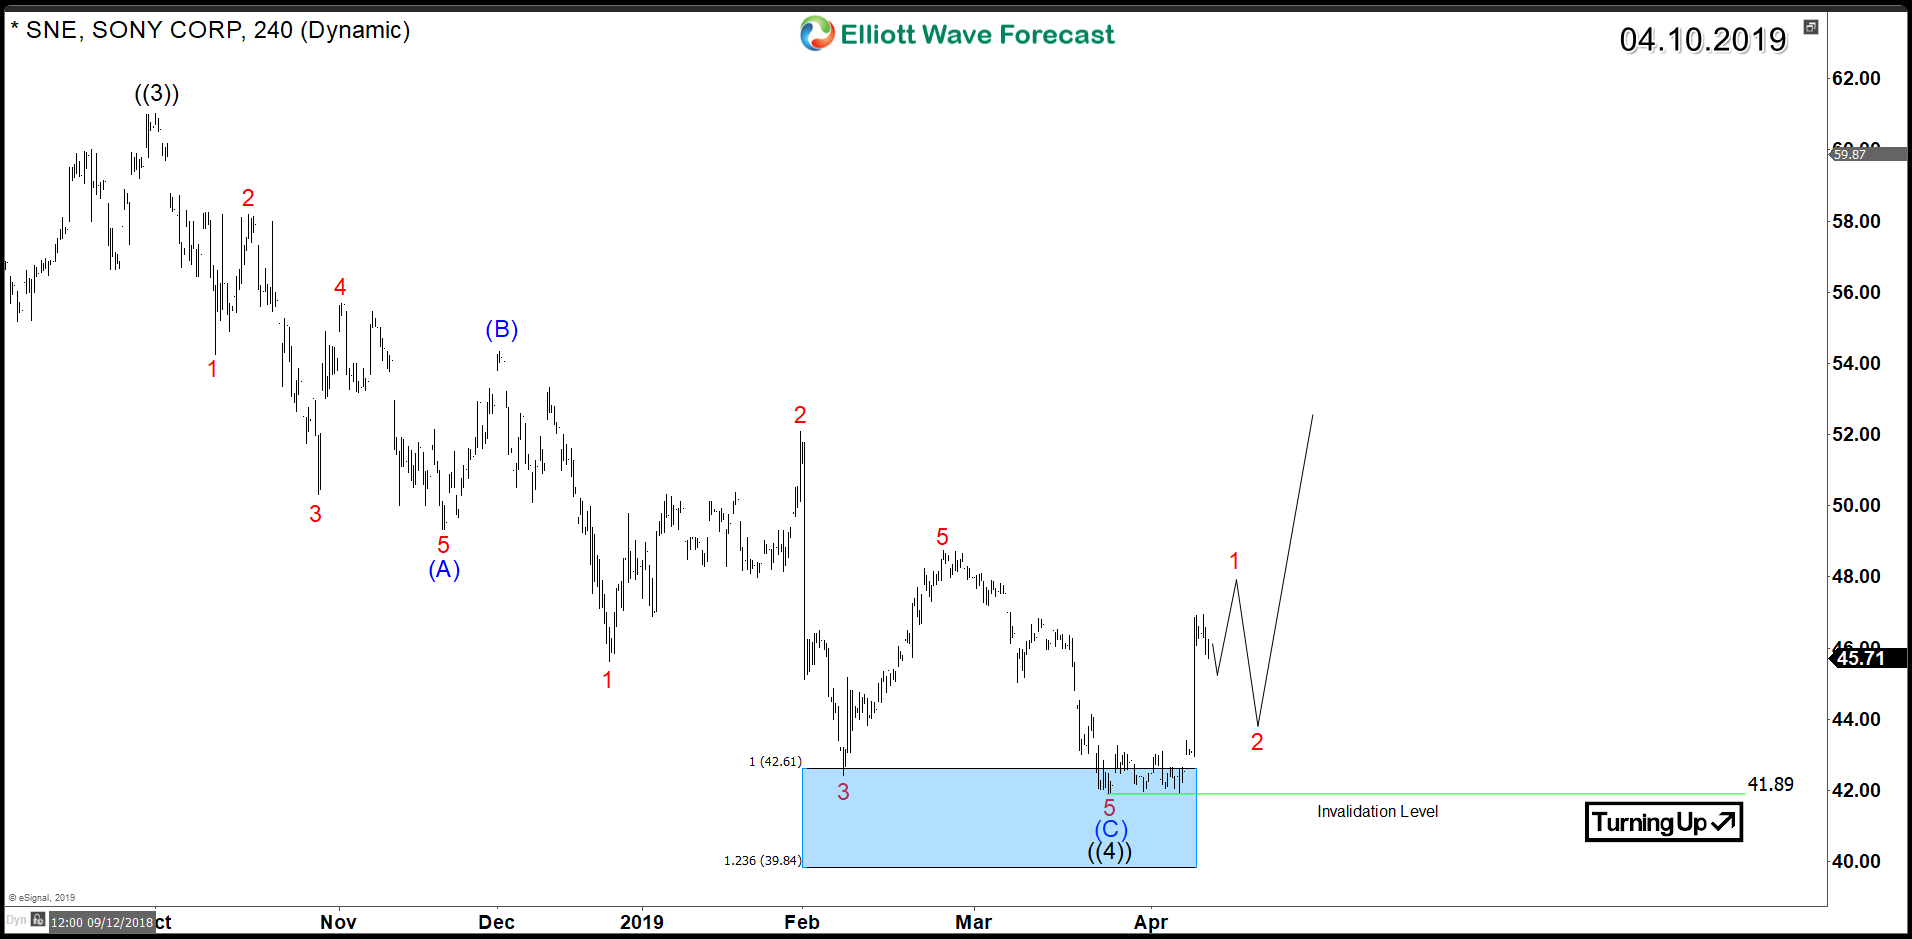
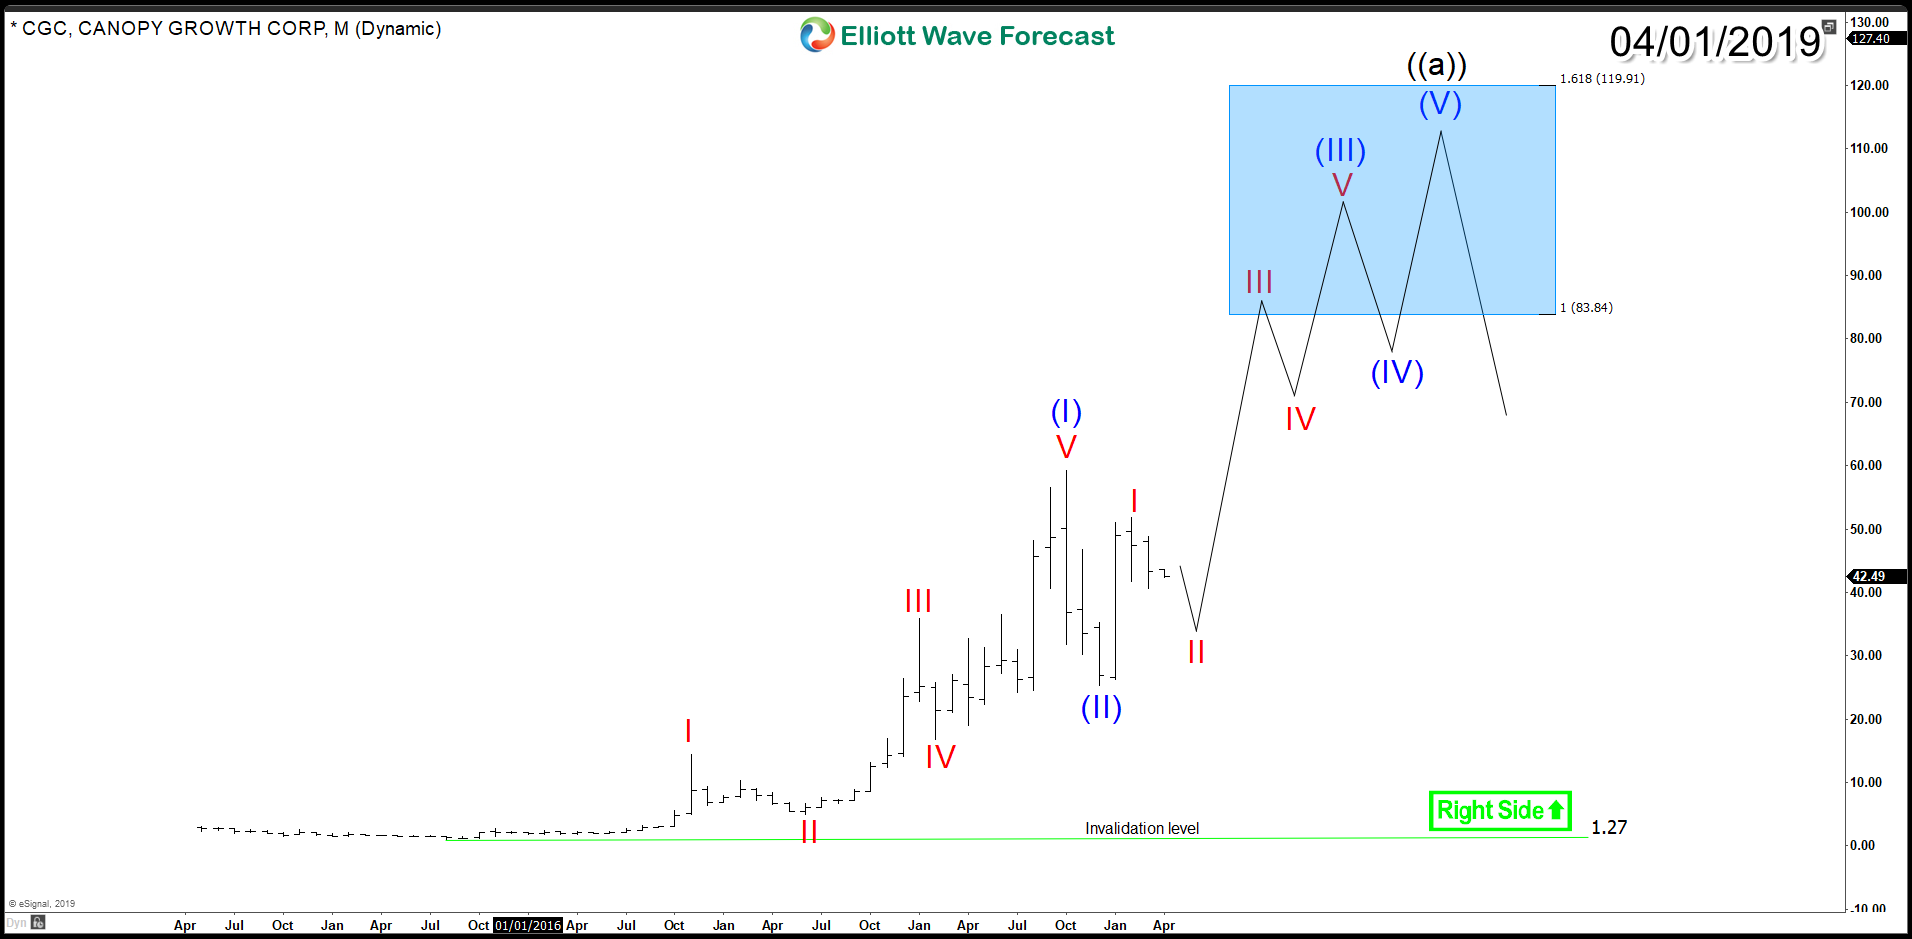
CGC Monthly Chart 4/1/2019


Making new all time highs will be the start of a new incomplete bullish sequence for CGC. Consequently, the stock will be aiming for a minimum target at the 100% Fibonacci extension level at $83.84 and higher levels above $100 will follow. So based on that assumption, investors will be looking to buy any pullback in 3 , 7 or 11 swings against 2018 low.

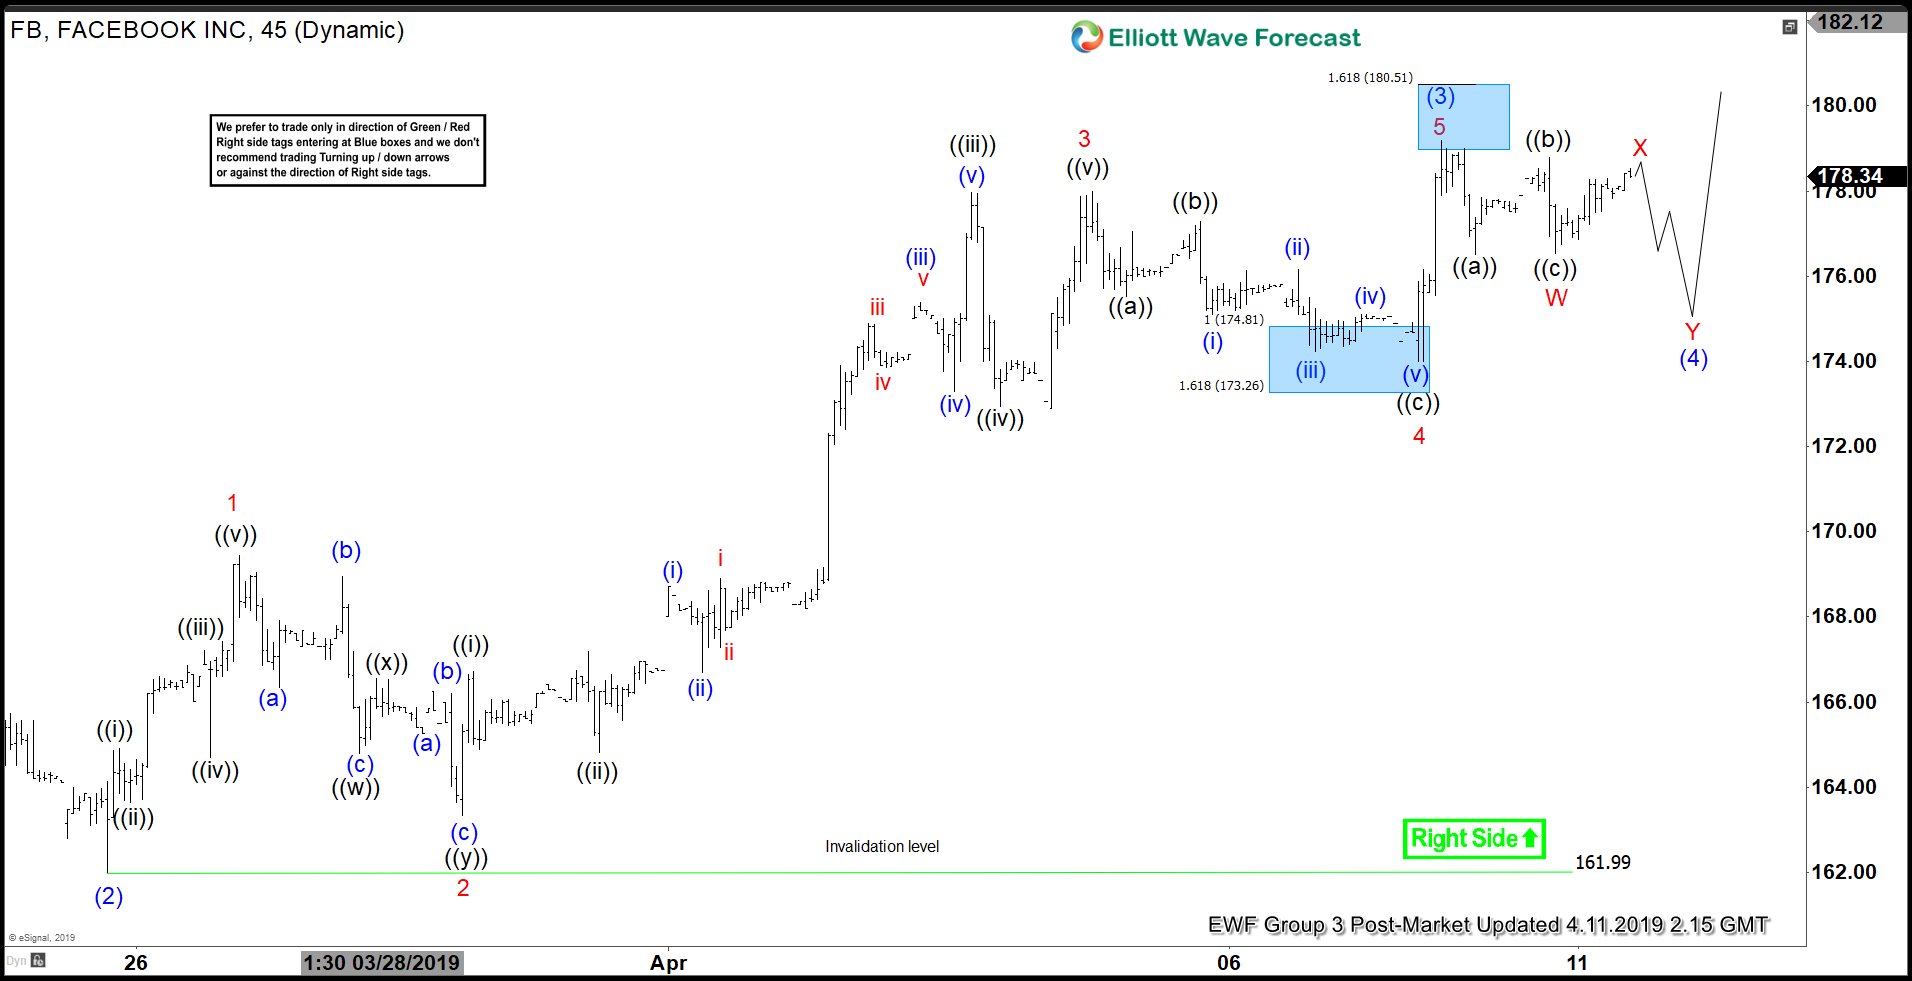
Now as we established the main trend for the stock, we can take a look at the daily chart and explore the potential moves that can take place in the coming weeks:

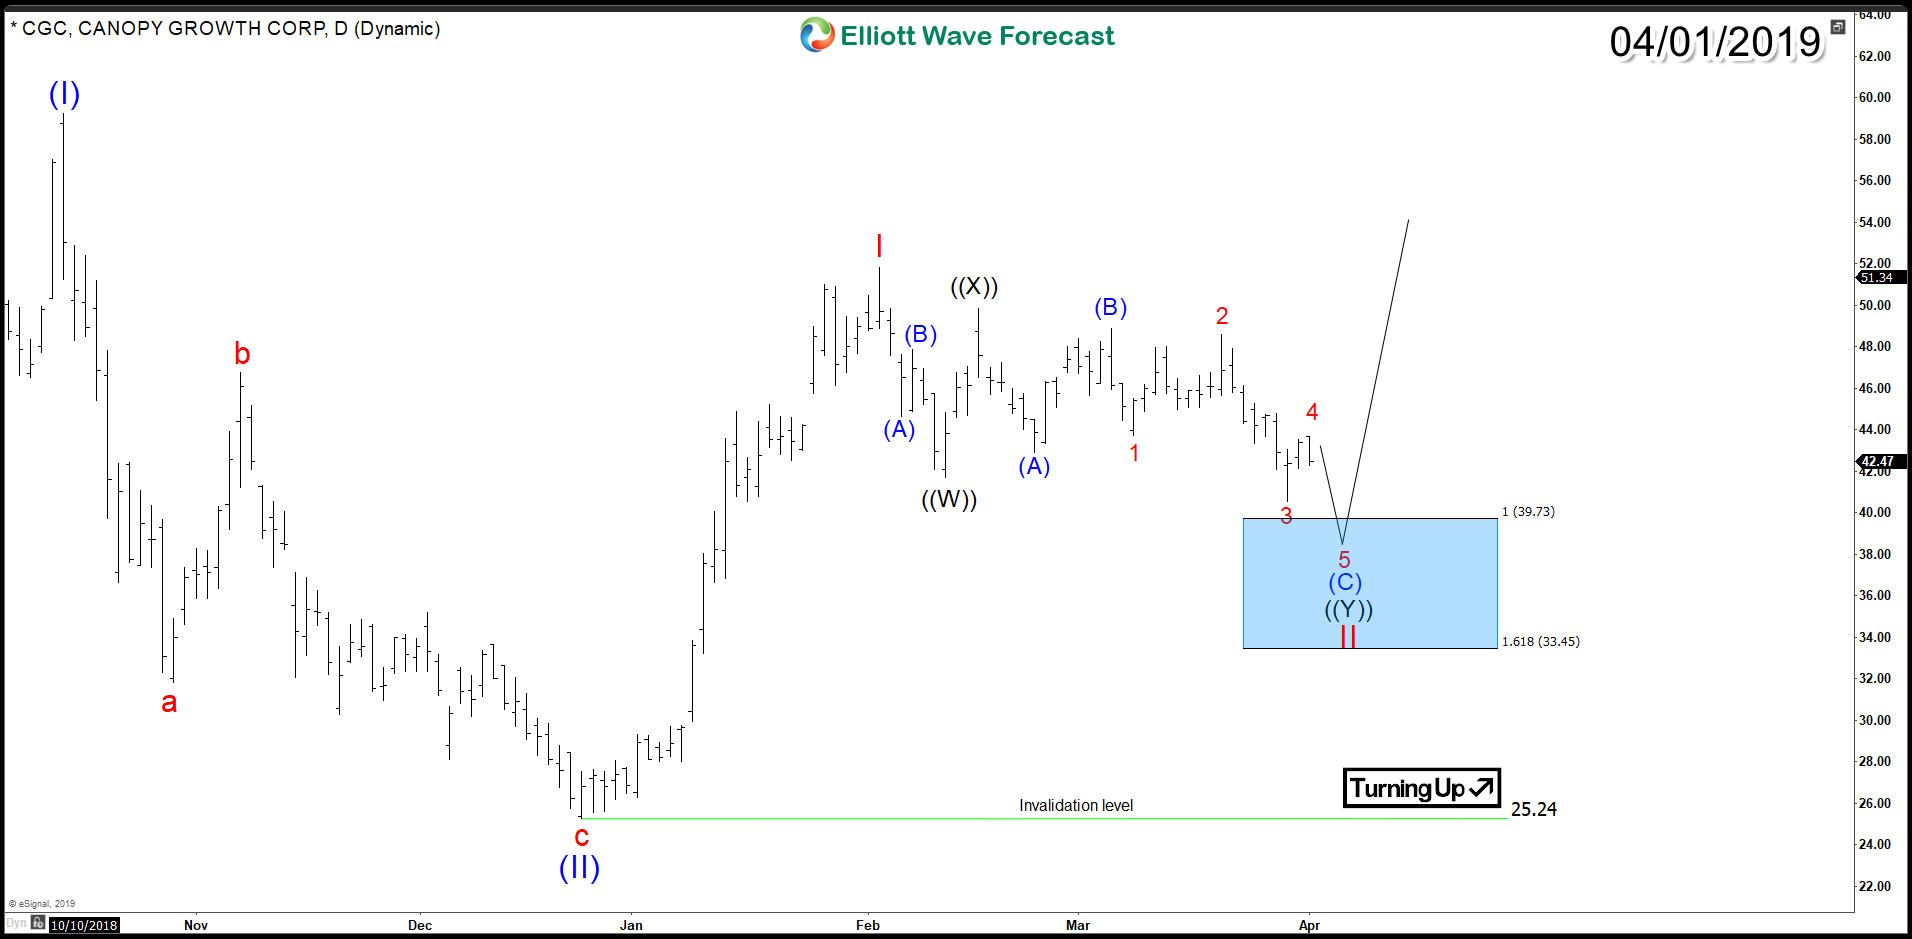
CGC Daily Chart 4/1/2019


Currently, CGC is proposed to be doing a double three corrective structure since February 2019 peak which ideally expected to find buyers at extreme blue box area $39.7 - $33.45 for a 3 waves bounce at least. However, if the stock fails to rally to new highs from there, another double correction can take place against $25 before ending wave II and turning higher.

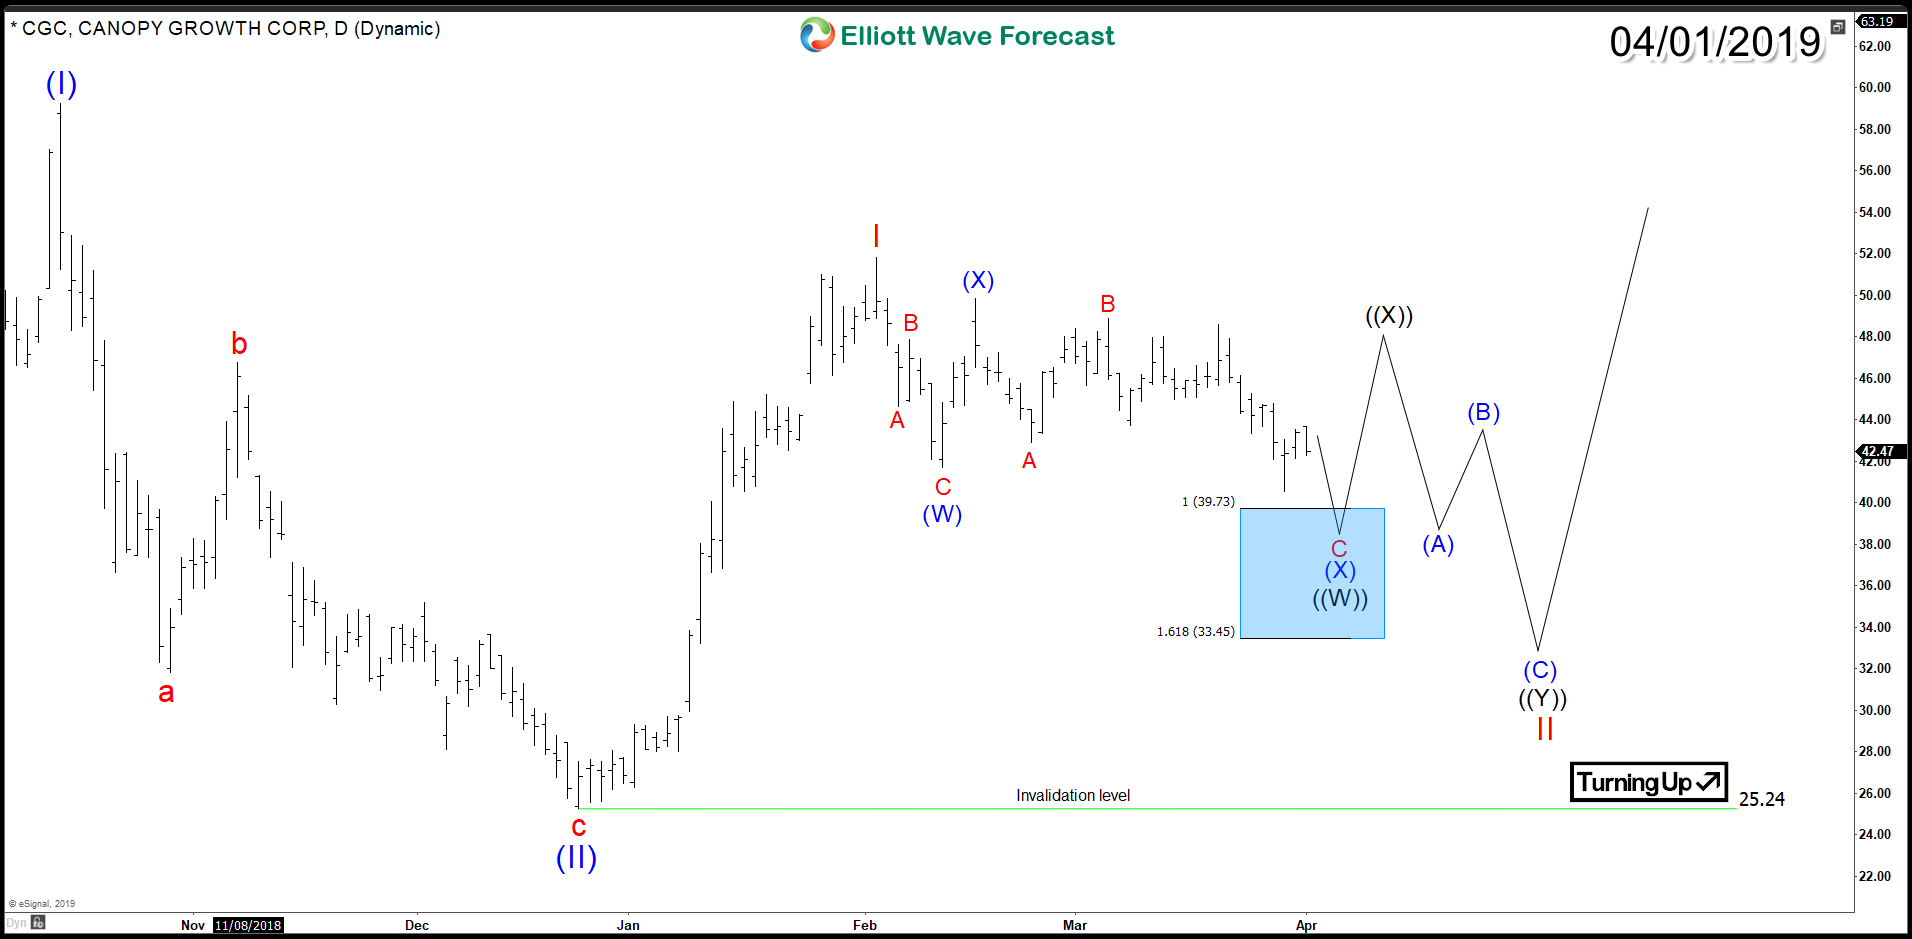
CGC Daily Alternative Chart 4/1/2019


Conclusion
Canopy Growth Corporation is a Bullish stock and it's looking to remain supported against December 2018 low $25. The stock still needs to break above 2018 peak to open the door for higher levels.
 

Elliottwave-Forecast

Master Trader
Feb 17, 2017
2,453
9
84
www.elliottwave-forecast.com
GBPAUD Technical Analysis April 2/2019

GBPAUD : Bearish market patterns can be seen on the GBPAUD 1 hour chart. In the chart below both the blue and pink bearish patterns already triggered SELLS. Blue bearish pattern triggered SELLS at the BC 0.50% Fib. retracement level and the pink bearish pattern triggered SELLS at the XA 1.27% Fib. retracement level. Only the grey bearish pattern has still not triggered SELLS (XA 0.886%). Price does not need to move higher to the grey XA 0.886% Fib. level to trigger the grey bearish pattern SELL for the pair to start a move lower. Both blue and pink bearish patterns have already got sellers in the market. If looking to trade GBPAUD stops should be placed at the point B high of the blue bearish pattern and traders should watch for a possible move lower at the pink XA 1.27% Fib. level. The targets (green) are based on the pink bearish pattern XA 1.27% entry. As long as the March 27/2019 high holds GBPAUD has a strong probability of making another move lower. Only time will tell what GBPAUD will do but at least now you are aware of the possible area where the pair can reverse lower from.

GBPAUD 1 Hour Chart 4.2.2019


Of course, like any strategy/technique, there will be times when the strategy/technique fails so proper money/risk management should always be used on every trade. Hope you enjoyed this article.
 

Elliottwave-Forecast

Master Trader
Feb 17, 2017
2,453
9
84
www.elliottwave-forecast.com
Cycle from Dec 26, 2018 low in S&P 500 (SPX) remains in progress as an impulse Elliott Wave structure. In the 1 hour chart below, we can see wave (4) of this impulsive move ended at 2722.27. The Index has resumed higher in wave (5) with subdivision also as an impulse of lesser degree. Up from 2722.27, wave 1 ended at 2852.42 and wave 2 ended at 2785.02.

Wave 1 subdivides as an impulse where wave ((i)) ended at 2736.25 and wave ((ii)) ended at 2723.02. Up from there, wave ((iii)) ended at 2821.24, wave ((iv)) ended at 2803.46, and wave ((v)) of 1 ended at 2852.42. Wave 2 pullback unfolded as double three Elliott Wave structure where wave ((w)) ended at 2802.13, wave ((x)) ended at 2823.28, and wave ((y)) of 2 ended at 2785.02. Wave 3 rally is currently in progress as an impulse. Near term, while dips stay above 2784.94, expect Index to extend higher. We don't like selling the proposed pullback.

1 Hour SPX Elliott Wave Chart
 

Elliottwave-Forecast

Master Trader
Feb 17, 2017
2,453
9
84
www.elliottwave-forecast.com
Most of the World Indices have ended the cycle from the post-2009 Financial crisis low. But still, there are few Indices which are due for another cycle higher. SPX and SPY are running in an Elliott Wave Impulse structure. We at Elliott Wave Forecast believe in the idea of combining other Financial Instruments and relate them with each other. Consequently, we combine also cycles to each other. As we do understand that most of the time the Financial Market works, as a whole.

Recently, we did a blog about the SPY showing the increased volatility. We explained how the Index can be doing a new high and can turn lower in a higher degree wave (IV). The most significant low in most of the Indices is the 12/2018. Above from there, the price action seems to unfold as an Impulse.

In the monthly chart below you can see that the SPY ETF is close to breaking into new all-time highs again. But what will happen after that? This question cannot be answered using its own price action. As Elliott Wave Theory practitioners, we do understand that this is either the whole red wave V or alternatively, it is just wave ((1)) of wave V. If you use only the Theory, you will be left with no answer. But as I said before, we at Elliott Wave Forecast use additional tools and we follow around 100 instruments on a Daily basis and relate them to each other. Today, we will be using General Motors stocks to track and decide which way the SPY ETF can go. In either case. It will extend within wave V or ends wave V. The following chart is showing the SPY ending wave V.


SPY ETF 04.03.2019 Monthly Elliott Wave View


And the next chart is showing the second scenario. Which is showing SPY with an extended wave V.


SPY ETF 04.03.2019 Monthly View with extended wave V


At this moment in time, we can not tell which one of the 2 scenarios will be ending happening based on the Elliott Wave Theory. So we look for another instrument to peak the path with a higher probability. For that let's relate the GM stock and the German DAX.


DAX vs General Motors Daily Chart Overlay


The General Motors stock is always trading similar to other big World Indices. The chart above shows the relation of the DAX Index together with the GM stock. And it is easy to see that they trade overall in the same direction. However, one of the biggest differences is that GM bottomed first when it reached 100% equal legs from 10/24/17 peak at $30.56+ area. Also, we can see how the first pullback in GM ended at 12/26/18. And at that time we saw the low in the DAX and in other World Indices as well. Then both have been trading higher since that low. Then it became very interesting because of the following 3 observations.

1. General Motors has an early low and consequently reached 100% equal legs from 10/24/18 and found sellers at $41.50

2. General Motors ended the cycle from 12/26/18 which is the same as the World Indices cycle

3. The DAX is still trading higher within the 12/26/18 cycle and soon will reach its respective 100% equal legs area


In our system, this is a huge and important observation. Because now GM will possibly dictate if the SPY ETF will extend within wave V or will end the wave V. With that said, it is now easy how to put this into the context. For that, we will have a look at the chart below.


GM 04.03.2019 4-Hour Elliott Wave View


The chart is showing the price action in GM from 10/24/2018 lows. It shows our Blue Box area which comes at around $41.50 which is from its 10/24/18 low. The key is that GM needs to hold the peak at $41.50. If it breaks that peak clearly the Bears will lose control of the Market. The peak at 41.50 means that it ended a 3 waves advance structure. And a break above there will mean it becomes 5 waves from lows and consequently, more upside will be seen after a 3 waves pullback. This path would mean that the Bulls would be on the driver seat and that will translate that SPY will be ending only wave ((1)) of wave V.

But for now, we believe that as far as GM hold the peak at $41.50, sellers have the chance to make another run lower and create 7 swings lower across the World Indices. Then SPY will be ending wave V and consequently wave (III).

We at Elliott Wave Forecast understand that the Market cannot be forecasted based on one instrument and its price action. We have noticed that after years of practicing the Elliott Wave Theory. We knew that adjustments and other tools were needed to get an edge over the Market. We have learned that in the Market you always have more than one path. Therefore, relating other Instruments is key to determine the possible outcome.
 

Elliottwave-Forecast

Master Trader
Feb 17, 2017
2,453
9
84
www.elliottwave-forecast.com
HDFC Bank Limited (Housing Development Finance Corporation) is an Indian banking and financial services company headquartered in Mumbai, India. It has 88,253 permanent employees as of 31 March 2018 and has a presence in Bharain, Hong Kong and Dubai. HDFC Bank is India’s largest private sector lender by assets. It is the largest bank in India by market capitalization as of February 2016. It was ranked 69th in 2016 BrandZ Top 100 Most Valuable Global Brands

HDFC Bank structure of the rally from the all time low is taking the form of an Elliott Wave Impulse and today, we will present the Long-term and mid-term Elliott Wave Analysis of HDFC Bank and also look at the upside targets after it broke above July 2018 peak (2220). HDFC Bank is part of NSE

HDFC Bank Weekly Elliott Wave Analysis
Weekly chart shows HDFC Bank stock to be still within wave ((III)) from the all time low when wave (I) ended at 1128 (July 2015), wave (II) ended at 925.80 (February 2016), wave (III) ended at 2220 (July 2018) and wave (IV) completed at 1885 (October 2018). It has already made a new high above July 2018 peak suggesting wave (V) of ((III)) is in progress and should ideally reach an area between 2462 - 2688 to complete wave ((III)) before it starts a larger pull back in wave ((IV)) to correct the cycle from 2009 low and then resume the rally again. Trend is extreme as of now but there is still room for further upside within the cycle from January 2019 low and hence we don't recommend the selling, short-term traders would still be looking for buying opportunities in intra-day dips. Mid-term traders, however, would ideally wait for a pull back in red wave IV and next swing trading opportunity would be seen during wave ((IV)) pull back.


HDFC Bank Daily Elliott Wave Analysis
HDFC Bank Daily chart shows the structure of the move up from October 2018 low i.e. wave (IV) low. We can see that the stocks has reached 100% extension of wave I related to wave II but it appears to be still in 3 waves up from the red II low and is in need of a pull back and another high to complete red wave III. Afterwards, a pull back in wave IV would be expected to correct the cycle from 2022 (January 2019) low and another high to complete wave V of (V) and the black wave ((III)) which should mark the end of cycle from 2009 low and could then see a roll over process starting.

Alternatively, wave (V) could take the form of an Ending Diagonal when a pull back and another high would complete wave I of (V) as a zigzag and then we could see a larger pull back to correct the cycle from October 2018 low in the form of wave II before extension higher in the form of wave III of diagonal wave (V).


Elliottwave-Forecast

Master Trader
Feb 17, 2017
2,453
9
84
www.elliottwave-forecast.com
Target ( TGT )
Looking at the March report for February US Retail Sales numbers we find the current level of sales at 445.66B, down from 446.71B last month. This represents a monthly annualized growth rate of -2.82%, compared to a long term average annualized growth rate of 4.17%. Is this a blimp or is the first data point signaling a coming problem for retailers? Consequently with that question in mind I set out to scan retailer stock charts to look for any clear Elliott Wave patterns that may provide an opportunity to exploit any mispricing. It didn't take me long to find one that appears relatively clear. Target Corporation (NYSE: TGT) appears to have completed an impulsive 5 wave move to the downside from the $90.39 high of 9/10/2018.

The subdivision from the September highs are clearly in 5 waves. As Elliotticians we would look for a corrective structure to follow. This would place the probabilities on our side that we should see another swing to the downside once a correction was complete.

Elliott Wave
From the $60.15, wave (a), lows of December 24,2018 TGT appears to have progressed higher in a double-three pattern. The most recent high is the $81.56 print on 3/28/2019. If we indeed turn from there we know that we should take out the $60.15 low, but how low could TGT extend?

I want to be clear and state that we have no confirmation of a top at the March 28th high. But, if we aggressively call a top in place at that $81.56 high then we would look for a symmetrical move in wave (c) relative to the length of (a). This targets $51.35. Can it go that low?

We'll be looking for a short term bearish sequence to develop from $81.56 to start the confirmation process.


To your success,


James

EWF Analytical Team
 

Elliottwave-Forecast

Master Trader
Feb 17, 2017
2,453
9
84
www.elliottwave-forecast.com
Biogen Incorporation (ticker symbol: BIIB) is an American multinational biotechnology company specialized in discovery, development, manufacturing, and delivery of therapies for the treatment of neurogenetics, hematologic and autoimmune disease. The company currently employs 7800 people approximately.

The BIIB stock's value has declined 34% from 2018-2019 with net income dropping down to $1.72 billion from $2.61 billion last year. However, in this blog, we will take a look at the technical picture of the stock using the Elliott wave theory to identify future price action in the stock below.

BIIB Weekly Elliott Wave Analysis


Looking at Weekly Time Frame Chart, the cycle from All time lows is complete at $442.29 high seen on 3/20/2015 peak in Grand Super Cycle degree. Down from there, the stock is doing a bigger 3 wave pullback to correct the all-time low cycle within Grand Super Cycle degree wave ((II)).

The pullback from the peak takes the form of an Elliott wave zigzag structure where Super Cycle degree wave (a) ended at $205.42 low. Wave (b) bounce ended in lesser degree zigzag structure at $388.83 high. Wave (c) lower remains in progress towards $151.50-$95.55 100%-123.6% Fibonacci extension area of (a)-(b).

BIIB Daily Elliott Wave Analysis


Here's the Daily Time frame Chart, suggesting that as far as a pivot from $388.83 high stays intact near-term bounces should fail in 3, 7 or 11 swings for more downside in the stock towards $151.50-$95.55 area lower within wave Super Cycle degree wave (c). This area should see buyers for next cycle higher or bigger 3 waves bounce at least.

BIIB Daily Alternative Elliott Wave Analysis


Above is the Daily Alternative view Chart, in which the degree of pullback from 3/20/2015 peak can be unfolding as double three structure instead of zigzag structure. In this scenario, the decline to $205.42 low ended Super Cycle degree wave (w) with subdivision of a zigzag structure. Then a bounce to $388.83 high ended wave (x) with subdivision also as a zigzag Elliott Wave structure.

Down from there, wave (y) can be unfolding as double three structure where it can be ending cycle degree wave w in red at $233.98-$165.65 100%-161.8% Fibonacci extension area of ((A))-((B)). Then from there, the stock can see a 3 wave bounce against $388.83 high before a final extension lower towards $151.50-$95.55 area lower can be seen.

Keep in mind that the market is dynamic and the view could change in the meantime. Success in trading requires proper risk and money management as well as an understanding of Elliott Wave theory, cycle analysis, and correlation. We have developed a very good trading strategy that defines the entry. Stop loss and take profit levels with high accuracy and allows you to take a risk-free position, shortly after taking it by protecting your wallet.
 

Elliottwave-Forecast

Master Trader
Feb 17, 2017
2,453
9
84
www.elliottwave-forecast.com
Hello fellow traders. Today, I want to share some Elliott Wave charts of the BABA stock which we presented to our members in the past. Below, you see the 1-hour updated chart presented to our clients on the 03/28/19. showing that BABA ended the cycle from 03/07/19 low (171.55) at the peak of 03/19/19 (183.48) in red wave W.

Below from there, we advised members that the pullback in red wave X ended at 173.59 low. Above from there it did the first leg higher in 5 waves of blue wave (a) which ended at 180.57 peak. Then below from that level, we said to our clients it should see the equal legs from 03/26 peak towards the areas of the 100 - 1.618 Fibonacci extension of the red wave w-x which came around 176.24-174.02. Therefore, we expected buyers to appear in the sequences of 3, 7 or 11 swings. And that was the first area for buyers to appear to take prices to new high above 03/19/19 (183.48) peak. Or a larger 3 waves bounce at least. As BABA entered the blue box it reacted quite aggressively to the upside.


BABA 03.28.2019 1 Hour Chart Elliott Wave Analysis


In the last Elliott Wave chart, you can see that BABA continued the strong reaction higher and rallied like expected to new highs. Above red wave W peak. Due to the turning up tag, we expected BABA to be supported overall in the 1H timeframe. If traded our blue box. Any trades from that area have been risk-free, which means the stop-loss was moved to breakeven, targeting higher levels. Do please keep in mind that the 1-hour chart which I presented might have changed already. The blue boxes you see in our charts are our so-called High-Frequency boxes. Where the market ideally shows us a reaction either lower or higher. These areas are used be traded in the direction of the right side.


BABA 04.01.2019 1 Hour Chart Elliott Wave Analysis


I hope you liked this blog and I wish you all good trades.
 

Elliottwave-Forecast

Master Trader
Feb 17, 2017
2,453
9
84
www.elliottwave-forecast.com
Hello fellow traders. In this technical blog we’re going to take a quick look at the Elliott Wave charts of GBPCAD. As our members know GBPCAD is showing incomplete bullish sequences in the cycle from the August 15th 2018 low. Break of the 01/25 peak made the pair bullish against the 1.697 pivot. Consequently, we advised members to avoid selling the pair and keep on favouring the long side. In the following article, we’re going to explain the Elliott wave structure and Forecast.

GBPCAD 4 Hour Elliott Wave Analysis 3.21.2019
Besides we have bullish sequences in August 2018 cycle, short term rally from the 1.697 low has 5 waves structure which supports idea of further rally. 5 waves from the mentioned low suggests we have ended only the first leg of potential Elliott Wave ZIG ZAG Pattern . So once B pull completes we can get another leg up C red. As of right now GBPCAD is correcting the short term cycle from the 1.697 low. Pull back is labeled as B red , having ((a)) ((b)) ((c)) subdivisions. We see pull back incomplete when we can still be in ((c)) black leg. Chart is calling for potentially another leg lower, however we don't recommend selling it.


GBPCAD 1 Hour Elliott Wave Analysis 3.21.2019
B red pull back can be still in progress. We are calling for another short term swing down to allow the price to reach important technical area marked at the blue box : 1.74306-1.7345 ( buyers zone) . As our members know, Blue Boxes are no enemy areas , giving us 85% chance to get a bounce. Because of incomplete swing sequences in August cycle and 5 waves from the 1.69704 low, we expect to see reaction in 3 waves up from the blue box at least.


GBPCAD 1 Hour Elliott Wave Analysis 3.24.2019
Eventually GBPCAD has made leg lower as expected. The price has reached proposed Blue Box area at 1.74306-1.7345. Buyers appeared right at the blue box when pull back completed at 1.74198 low. We got expected rally. Now, we need to see break above March 12th peak to confirming next leg is in progress. Any longs from blue box area should be already risk free. If not already long we don't recommend buying short term dips against the 1.74198 low until March 12th peak gets broken.

Keep in mind that market is dynamic and presented view could have changed in the mean time. Best instruments to trade are those having incomplete bullish or bearish swings sequences. We put them in Sequence Report and best among them are shown in the Live Trading Room.


Elliottwave-Forecast

Master Trader
Feb 17, 2017
2,453
9
84
www.elliottwave-forecast.com
Welcome traders, today we look at a couple of 30-min Coffee futures (KC_F) charts and its price action within hours. The following analysis will show how profitable and efficient it can be to trade with our philosophy and basic Elliott Wave analysis.

First of all, we start on March 27th with a 30-minute chart presented to our members. Here, we believe the market favors the downside in the near term based on our count. The top at $98.75, labeled as wave '((ii))', serves as a resistance pivot after finishing a 7 swing move 'w-x-y'. From there, an overlapping 5 wave structure is identified and a pullback initiates for wave '(b)'. Due to the nature of wave (i) down as a diagonal, we expect a 3,7 or 11 swing move down for wave '(iii)'. According to Elliott Wave theory, we are safe to assume an Elliott Wave zigzag structure move to complete wave '((iii))'; hence, the projected '(a)-(b)-(c)' move .

Under our methodology, we do not take action with an unconfirmed 'right side of the market'. In this particular example we have a confirmed 'right side' . This is represented by the "RightSide" arrow in red. So, we let the market shows itself and act when the price reaches extreme areas countering to the 'right side'. As soon as wave (a) was confirmed, and an a-b swing is identified, we derived a 1:1 minimum target and a 1:1.618 extreme target. These targets are combined to provide a blue box target area where high probabilities favor the instrument to react from and very possibly resume the trend lower.

Coffee 03.27.2018 1 Hour Chart Elliott Wave Analysis


Below you will see an updated chart of coffee later on the same day. The bounce took the the structure of a 7 swing 'w-x-y' into the blue box, then coffee reacts and resumes the dominant trend. Our members were advised to take the short and were rewarded. Trading is always about taking a chance. But, what can be better than taking a chance with probabilities on your side. Now, we continue adapting and we wait for a new opportunity as the market repeats itself. Once again, our blue box target areas showing how accurate they can be. In the Live Trading Room, we have closed our short position from 96.08 blue box at 92.8 for a $3.28 profit.

Coffee 03.27.2018 1 Hour Chart Elliott Wave Analysis


*Note : Keep in mind the market is dynamic and the presented view might have changed after the post was published.

If you like what you read or if you are interested on our Elliott Wave theory application visit us at Elliott Wave Forecast. We cover 78 instruments in total for which we provide daily live analysis. Up-to-date Elliott wave analysis, and potential reversal target areas are always available. And if that was not enough, we provide support through a 24/7 chat room.
 

Elliottwave-Forecast

Master Trader
Feb 17, 2017
2,453
9
84
www.elliottwave-forecast.com
Elliott Wave view on FTSE calls the rally from February 28, 2019 low (7041) as an impulse Elliott Wave structure. An impulse is a 5 waves structure with wave 1, 3, and 5 all subdivide in 5 waves of lesser degree. Up from 7041 low, wave 1 ended at 7370.6 and wave 2 ended at 7146.29. Wave 3 remains in progress and subdivides as 5 waves of lesser degree. Up from 7146.29, wave ((i)) ended at 7222.64, wave ((ii)) pullback ended at 7160.14. Index resumes rally in wave ((iii)) at 7461.39, and wave ((iv)) ended at 7420.41. Short term, Index has scope to extend higher 1 more time in wave ((v)) before ending wave 3.

Afterwards, Index should pullback in wave 4 before the rally resumes in wave 5. Wave 4 should correct wave 3 rally from 7146.29 low and expected to complete at 23.6-38.2 Fibonacci retracement. Once wave 3 is complete, we can then project wave 4 potential area. We don't like selling the Index and expect buyers to appear to buy dips in 3, 7, or 11 swing as far as pivot at 7146.29 low stays intact.

1 Hour FTSE Elliott Wave Chart Asia Update
 

Elliottwave-Forecast

Master Trader
Feb 17, 2017
2,453
9
84
www.elliottwave-forecast.com
Short Term Elliott Wave view on Nikkei Futures suggests the pullback to 20704 ended wave (2). The Index then resumed higher in wave (3) which ended at 21985. The internal of wave (3) subdivided as an impulse Elliott Wave structure. Up from 20704, wave 1 ended at 21415, wave 2 ended at 20985, wave 3 ended at 21765, wave 4 ended at 21490, and wave 5 of (3) ended at 21985. We can also see the internal of wave 1, 3, and 5 all subdivide as an impulse (5 waves) of lesser degree. This is an illustration of fractal within Elliott Wave where each wave consists of smaller waves and the pattern repeats indefinitely.

Wave (4) dips appears complete after a 3 waves pullback ended at 21427 - 21583 blue box area. The internal of wave (4) unfolded as a zigzag Elliott Wave structure where wave A ended at 21735, wave B ended at 21835, and wave C ended at 21565. At this stage, Nikkei still needs to break above wave (3) at 21985 to avoid a double correction in wave (4). While dips continue to stay above wave (2) low at 20704, expect Index to extend higher in wave (5). If bounce from the blue box fails to break above (3) high and it breaks the recent low, then structure of wave (4) should become a double three Elliott Wave structure and would be labelled as WXY. We would be able to define the next blue box area for a bounce if the bounce does fail and breaks the recent low.

1 Hour Nikkei (NKD_F) Elliott Wave Chart Asia Update
 

Elliottwave-Forecast

Master Trader
Feb 17, 2017
2,453
9
84
www.elliottwave-forecast.com
GBPJPY Technical Analysis April 10/2019

GBPJPY : Bearish market patterns can be seen on the GBPJPY 4 hour chart. In the chart below a blue bearish Head and Shoulders pattern is visible and price has already broken below the Neck Line which can be signalling for more possible downside in the coming trading sessions. As long as the right shoulder of the H&S pattern remains intact it is highly possible that GBPJPY will continue lower. A break above the high of the right shoulder will invalidate the blue bearish pattern. If price stays below the high of the right shoulder and pushes lower traders will then need to watch for the break below the orange descending triangle pattern. A break below the orange triangle pattern will confirm that sellers are in control and price will continue lower and hit the targets below. Another added confirmation will be if price respects the light blue 50 moving average before the sell entry breakout. Price respecting the moving average before the sell breakout entry will signal that possible trend to the downside is still going on which started from the March 14/2019 high. If looking to trade GBPJPY traders will need to watch if price stays below the April 9/2019 high and SELL on the break below the April 9/2019 low (green sell entry). If this happens then stops should be placed at the high of the right shoulder (April 9/2019 high). If price breaks above top of right shoulder before the green SELL break entry then the sell trade setup is cancelled. There is UK news release coming later today at 4:30am EST so trade safe and only SELL GBPJPY if the patterns stay intact.

GBPJPY 4 Hour Chart 4.10.2019


Of course, like any strategy/technique, there will be times when the strategy/technique fails so proper money/risk management should always be used on every trade.
 

Elliottwave-Forecast

Master Trader
Feb 17, 2017
2,453
9
84
www.elliottwave-forecast.com
Welcome traders, today we will look at a couple of USDSEK pair charts.The following analysis will show how profitable and efficient it can be to trade with our philosophy and basic Elliott Wave analysis.

First of all, we start on March 19 2019 with a 4-hr chart presented to our members. At the time, we maintained a bullish perspective due to our Elliott Wave analysis. Moreover, an incomplete bullish sequence to the upside (green bullish stamp). The top shown below labeled as wave ‘A’, serves as a resistance after finishing a 5 wave move. From there, according to Elliott Wave theory, we expect a pullback. Due to the straight down pullback, followed by 2 bounces failing to break wave ‘((A))’, it led us to believe 3 swing pullback was developing. More specifically, a ((w))-((x))-((y)) double Elliott Wave zigzag structure forming for wave ‘B’.

Under our methodology, our members are encourage to take action with a confirmed ‘right side of the market’. This is the meaning of the green ‘RightSide’ arrow. So, we let the market shows itself and we adapt our count to make sense of the price action. When wave ((x)) is confirmed, a 1:1 minimum target and a 1:1.618 extreme target is derived. These targets are combined to provide a high probability area for a reversal (this are is illustrated as a blue box). To add to this, a crucial rule in our methodology is a sequence must finish as a complete 3,7 or 11 swing move. So, based on this, our members are fully encouraged to take long position in this particular case.

USDSEK 3.19.2019 4-Hr Chart Elliott Wave Analysis


Below you can see an updated chart of the instrument from April 7th. Notice how the pair reacted off of the blue box target area and resumes the upside. Our members took a long trade from 9.117 in Live Trading Room and now has a risk free trade with stop at break even. At this stage however, the pair is no longer at extreme area so we don't recommend opening a new position. Pair now needs to break above wave (1) to avoid a double correction. Trading is always about taking a chance. But, what can be better than taking a chance with probabilities on your side. With a mapped entry, an invalidation level set up, the right side, sequences, add up to great trading opportunities. Waiting for the right signals proved to be successful and we got the proposed reaction as expected.

USDSEK 4.7.2019 4-Hr Chart Elliott Wave Analysis


*Note : The market is dynamic and our view is bound to change after date posted.

Trading success is a journey and you will never be perfect at it, but you can always master your reaction to the market.
 

Elliottwave-Forecast

Master Trader
Feb 17, 2017
2,453
9
84
www.elliottwave-forecast.com
Sony Corporation (NYSE: SNE) is a Japanese multinational conglomerate corporation. The Company has a diversified business primarily focused on the Electronics, Games, Entertainment and Financial Services.

In this article, we'll be looking at the technical Elliott Wave structure of the stock since late 2012 after a significant drop in Yen value which helped the Japanese stock market to start a recovery.

SNE have been rallying in the recent 7 years with an impulsive Elliott waves structure and the incomplete bullish sequence is still suggesting further upside for the stock as long as 2016 pivot at $19.9 holds. We use our proprietary pivot system to tell us when a cycle has ended & when we need to switch to a different degree, therefore Sony can still aim higher for $65 - $73 area before another correction takes place.

Sony SNE Weekly Chart


Since October 2018, the stock corrected lower in a classical 3 waves zigzag structure and reached the extreme blue box area $42.6 - $39.8 which is a High-frequency area where markets are likely to end cycles and make a turn. Up from there, SNE started bouncing higher ending the cycle from the peak and initially resuming the main daily bullish trend or doing a 3 waves bounce at least.

Sony SNE 4H Chart


Recap:

Sony impulsive structure since 2012 will remain intact as long as pivot at 2016 low $19.9 holds and short term support stands at March 2019 low $41.9. Consequently, the stock can see a recovery back toward $51 - $53 to clarify the short term structure then it can attempt to break 2018 peak.
 

Elliottwave-Forecast

Master Trader
Feb 17, 2017
2,453
9
84
www.elliottwave-forecast.com
Elliott Wave view on Facebook (ticker FB) suggests that the rally from March 19, 2019 low is unfolding as an impulse Elliott Wave structure. In the 1 hour chart below, we can see wave (2) of this impulse ended at $161.99. The rally from there to $179.19 ended wave (3). Internal of wave (3) subdivides as an impulse of lesser degree. Up from $161.99, wave 1 ended at $169.45 and wave 2 pullback ended at $163.33. The stock extended higher in wave 3 to $178, wave 4 ended at $174, and wave 5 of (3) ended at $179.19.

Wave (4) pullback is now in progress to correct cycle from March 25, 2019 low (161.99) in 3, 7, or 11 swing before the stock resumes higher again. While staying below $179.19, the stock has a chance to turn lower in wave (4) as a double correction. If the stock breaks above $179.19 from here, then it can still be part of wave (3) in extended wave 5. We don't like selling the stock and favor more upside as far as pivot at $161.99 stays intact.

1 Hour Facebook (FB) Elliott Wave Chart Asia Update


Elliottwave-Forecast

Master Trader
Feb 17, 2017
2,453
9
84
www.elliottwave-forecast.com
Silver has been bouncing since making a marginal new low on April 4, 2019. We publish a free Chart Of The Day from visitors of our websites every day from Monday - Friday. We showed Silver 1 Hour Elliott wave count in 3.29.2019 Chart Of The Day and forecast was for another low to complete 5 waves decline from $15.63 peak followed by a bounce and lower again. Below chart is from 3.29.2019 that we presented as Chart Of The Day.

Silver 1 Hour Elliott Wave Count - 3.29.2019


Wave ((iv)) bounce failed as expected and it resulted in a new low to $14.88 on April 4, 2019. This low was below wave ((iii)) low $14.95 and hence it met the minimum requirements for a 5 waves decline from $15.63 peak. According to Elliott Wave Theory, after a 5 waves impulsive decline, a 3 waves correction should take place. Now, let's take a look at the latest 1 Hour chart of Silver from the members area.

Silver 1 Hour Elliott Wave Count - 4.9.2019
Chart below shows the expected 3 waves corrective bounce is taken the form of a Zigzag Elliott wave structure. A zigzag is a 5-3-5 structure labelled ABC, both waves A and C are 5 waves (impulse or diagonal) and wave B could be any corrective structure. In the current wave ((ii)) bounce, wave (a) ended at $15.17, wave (b) ended at $15.04 and wave (c) has entered the blue box reaching the minimum target at $15.33. It can still make another high within the blue box but should ideally hold below $15.52 and then resume the decline in wave ((iii)) or make a larger 3 waves pull back at least to correct the cycle from $14.88 low. Invalidation level for this Elliott wave count is at $15.63 and as far as that level is holding, expect Silver to resume the decline in wave ((iii)) of C.


Elliottwave-Forecast

Master Trader
Feb 17, 2017
2,453
9
84
www.elliottwave-forecast.com
Gold miners as a group is unpopular since it topped in 2011 together with Gold. One well-known Index which represents major Gold Miners is the GDX. The Index topped in 2011 at $67 and declined a massive 81% before forming a low in 2016 at $12.40. None of the ample liquidity from central bank's money printing moves to the Gold Miners in the past 10 years. The Index remains depressed at low level while major indices, techs, crypto-currencies, cannabis all propel higher in a parabolic move.

Unsurprisingly, Gold Miners remain to be one of the most hated sectors. Sentiment to the sector is still very low, but is it about to turn? In this article, we will take a look at a couple of charts to see if they are ready to move higher.

Overlay Chart of GDX-to-Gold Ratio and GDX


The chart above is an overlay chart of GDX-to-Gold ratio and GDX in logarithmic scale. The upper chart is the GDX-to-Gold ratio while the lower chart is the Gold Miners ETF. We can see a couple of things from the above chart:

  1. A positive correlation between the two charts. They share the same oscillation and move together (up and down) in tandem. This suggests when the ratio is going higher, then Gold Miners is also going higher. The opposite is also true when the ratio goes lower, Gold miners also goes lower.
  2. GDX-to-Gold ratio (the upper chart) is retesting the bearish trend channel from October 2007 high. A break above this bearish trend line suggests that the Gold Miners Index will outrun Gold to the upside due to rising ratio. A break above the bearish trend line also suggests the Gold Miners should go higher due to the positive correlation.
  3. The GDX chart (the lower chart) has already broken the bearish trend line from August 2011. This is the same bearish channel in Gold (XAUUSD / GLD) as well after it topped in 2011. This suggests the Gold Miners is ready to recover and rally more.
Weekly Elliott Wave Chart of GDX-to-Gold Ratio


From the chart above, we can see that since it formed a low on January 18, 2016, the rally in the GDX-to-Gold looks impulsive and ended wave A / 1 on August 2016. After that, the ratio is in a protracted pullback & possibly ended wave B /2 already on September 2018. The ratio has since broken the descending bearish channel suggesting the next leg higher (wave C / 3) has already started. It still needs the confirmation by breaking above wave A/1 high, but the outlook looks constructive and promising.

We can conclude from the above two charts that Gold Miners could soon make a move to the upside, especially if we can see the GDX-to-Gold ratio breaking above the 2007 trend line.
 

Elliottwave-Forecast

Master Trader
Feb 17, 2017
2,453
9
84
www.elliottwave-forecast.com
XLE Topping Soon
Taking a look at the recent Elliott wave structure in XLE suggests a top may be near. Starting from the 12/24/18 low at $53.25 the energy ETF shows a 5 wave impulse in wave (A) to $66.93 on 2/20/19. From there we count a 3 wave correction to the (B) wave low at $63.31 on 3/8/19. So we see 5 waves up followed by 3 back. This sequence gives a clue for practitioners of Elliott wave on what to expect next. The most likely structure playing out is that of a zigzag. This pattern is characterized by the 5-3-5 structure within its subwaves.

It is the structure from this (B) wave low that we are giving the most attention. The overlapping nature of the price action from $63.31 suggest an ending diagonal wave (C). In an ending diagonal we need 5 overlapping waves before completion. Since we only count 3 waves from the 3/8/19 low the structure has yet to be confirmed.

XLE ZigZag


A Closer Look
Waves 1, 2, and 3 of the ending diagonal are complete and now we look for wave 4 to end above the wave 2 $64.87 low of 3/25/19. Looking at the chart below we look for wave 4 to end with one more push lower above $64.87 before turning higher for wave 5. This will be confirmed by moving above wave 3's 4/8/19 high, $68.25. Consequently a push below $64.87 before the new high would suggest that the entire cycle from the 12/24/18 lows has ended. Let's see how this plays out over the coming sessions.