Elliottwave-Forecast

Master Trader
Feb 17, 2017
2,453
9
84
www.elliottwave-forecast.com
Zendesk (NYSE: ZEN) is a customer service software company based in United States. Its cloud-based help desk solution is used by more than 200000 organizations worldwide. the company's earnings over the next few years are expected to increase by 34%, indicating a highly optimistic future ahead which would attract more investors.

In this article, we'll be taking a look at the technical picture of the stock using the Elliott wave Theory to identify the potential future path.

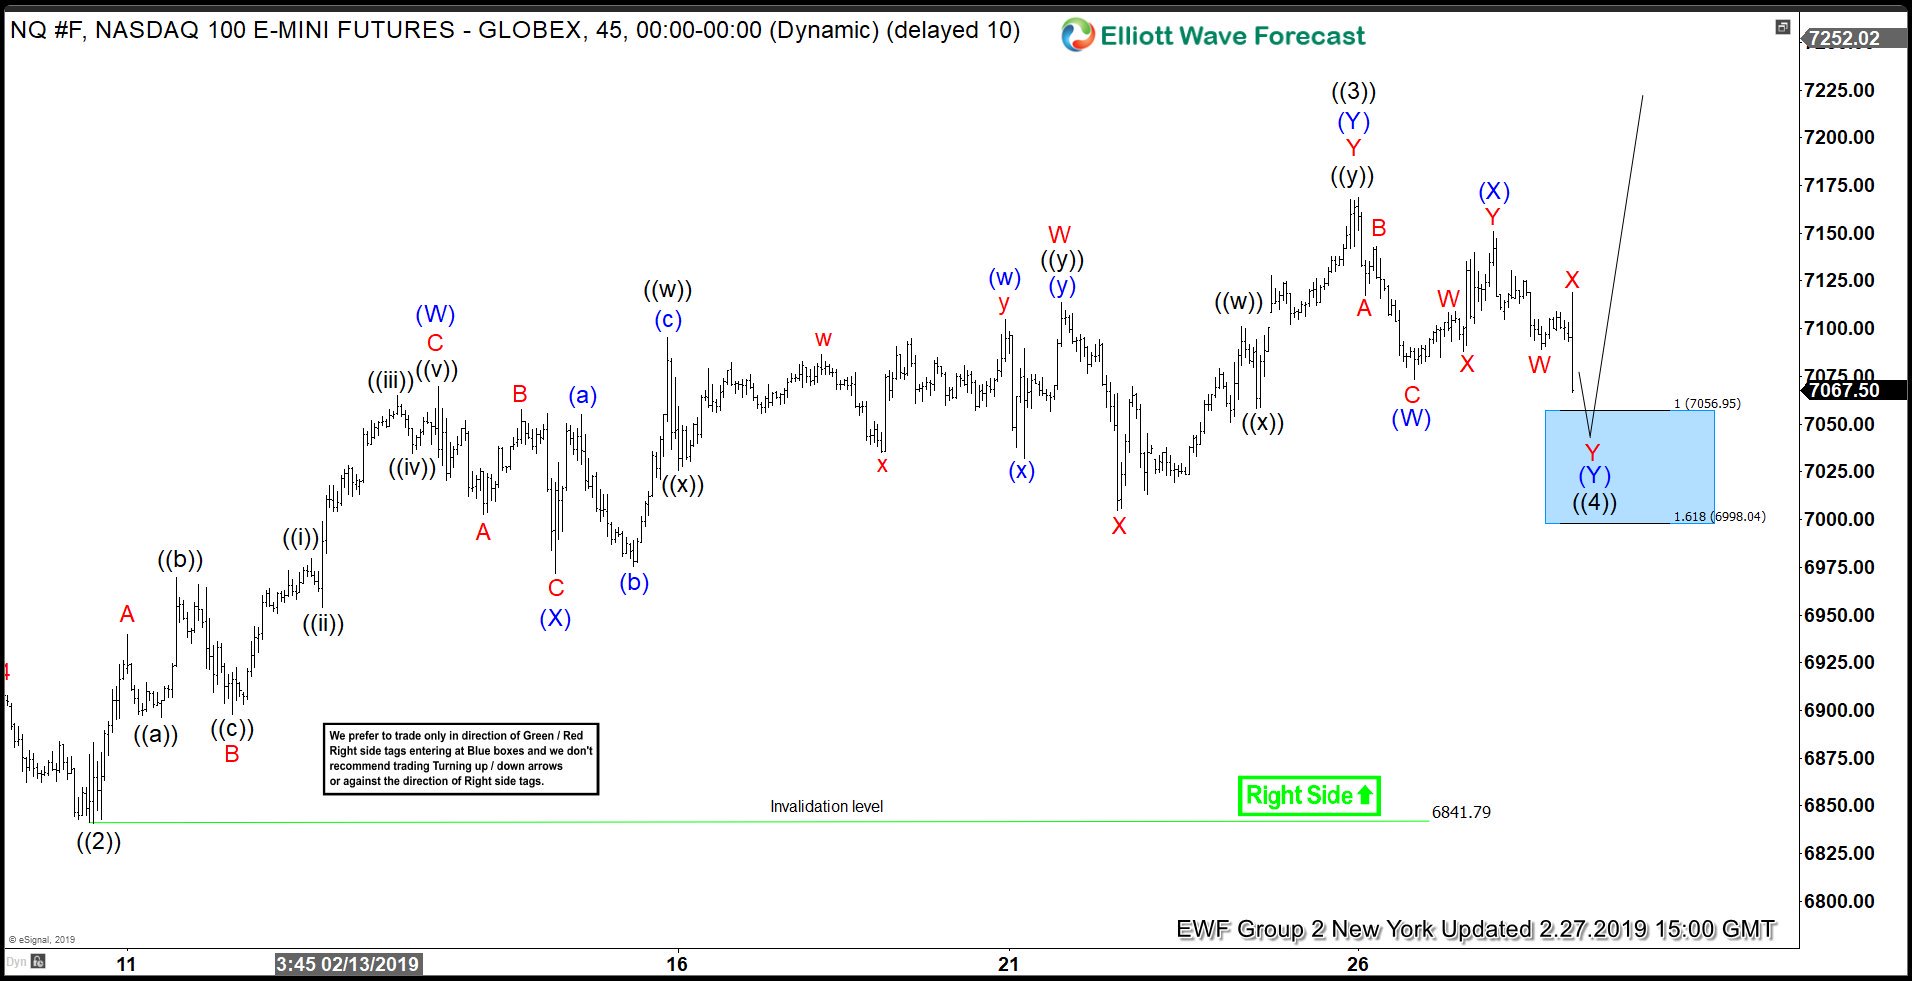
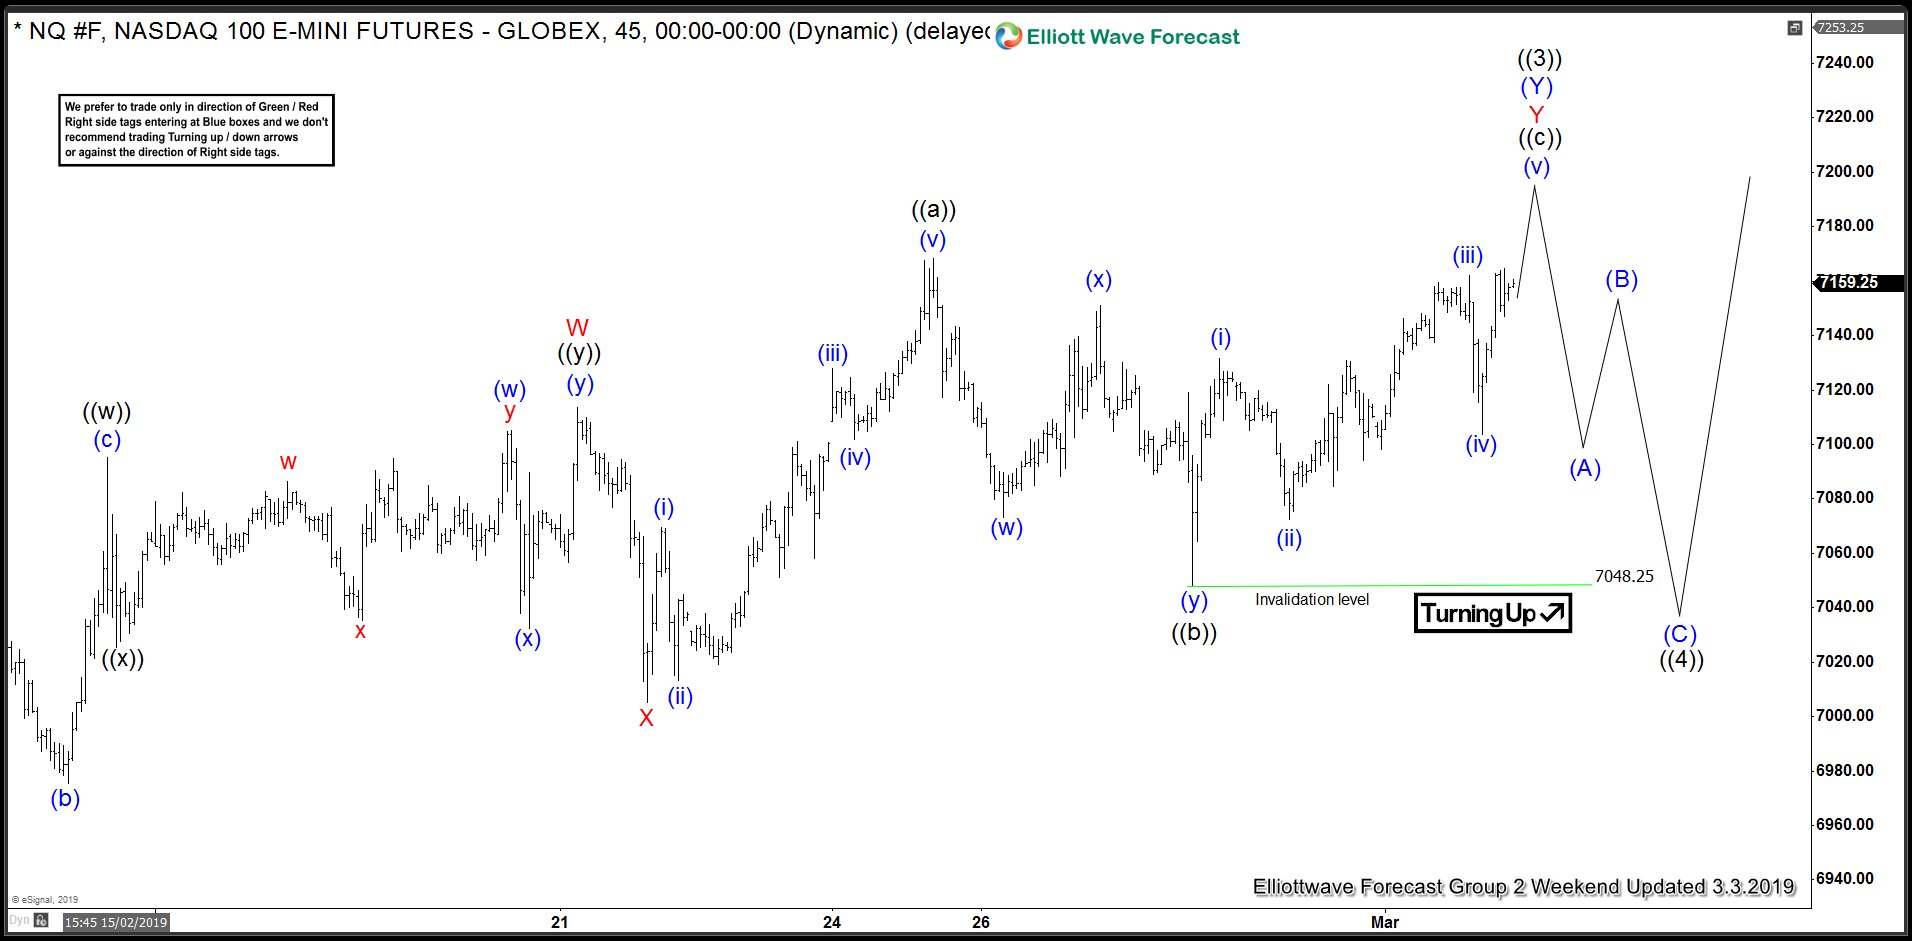
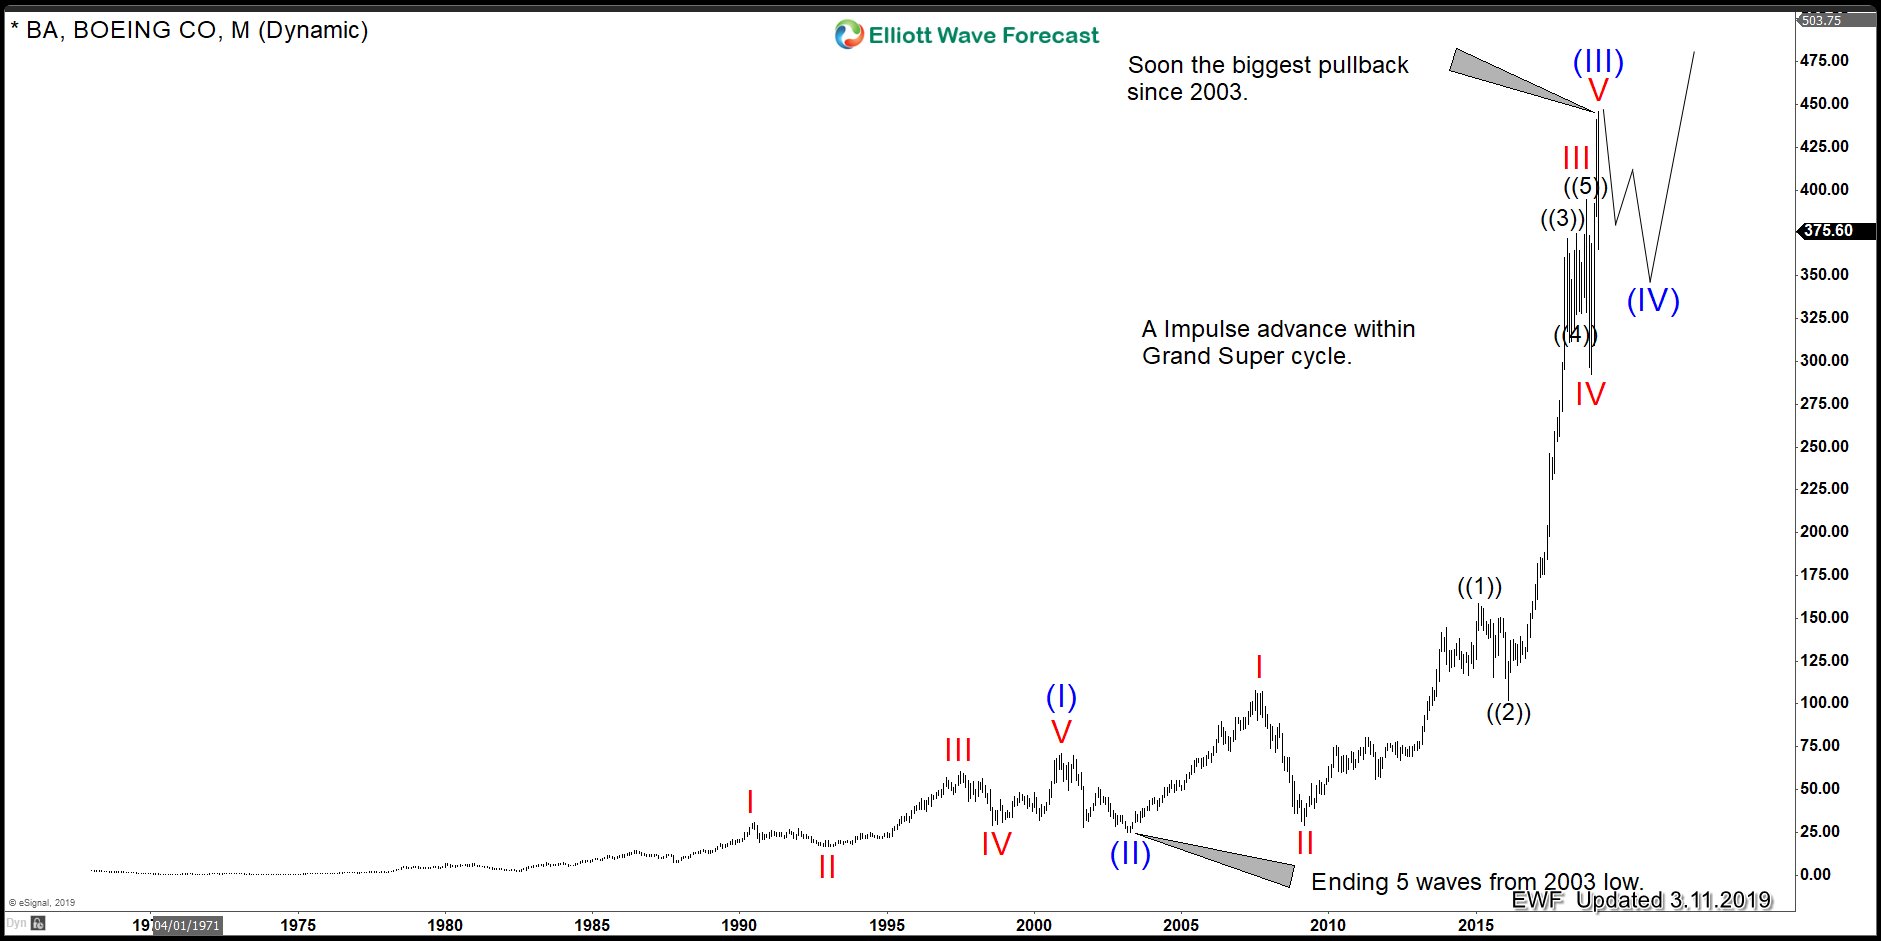
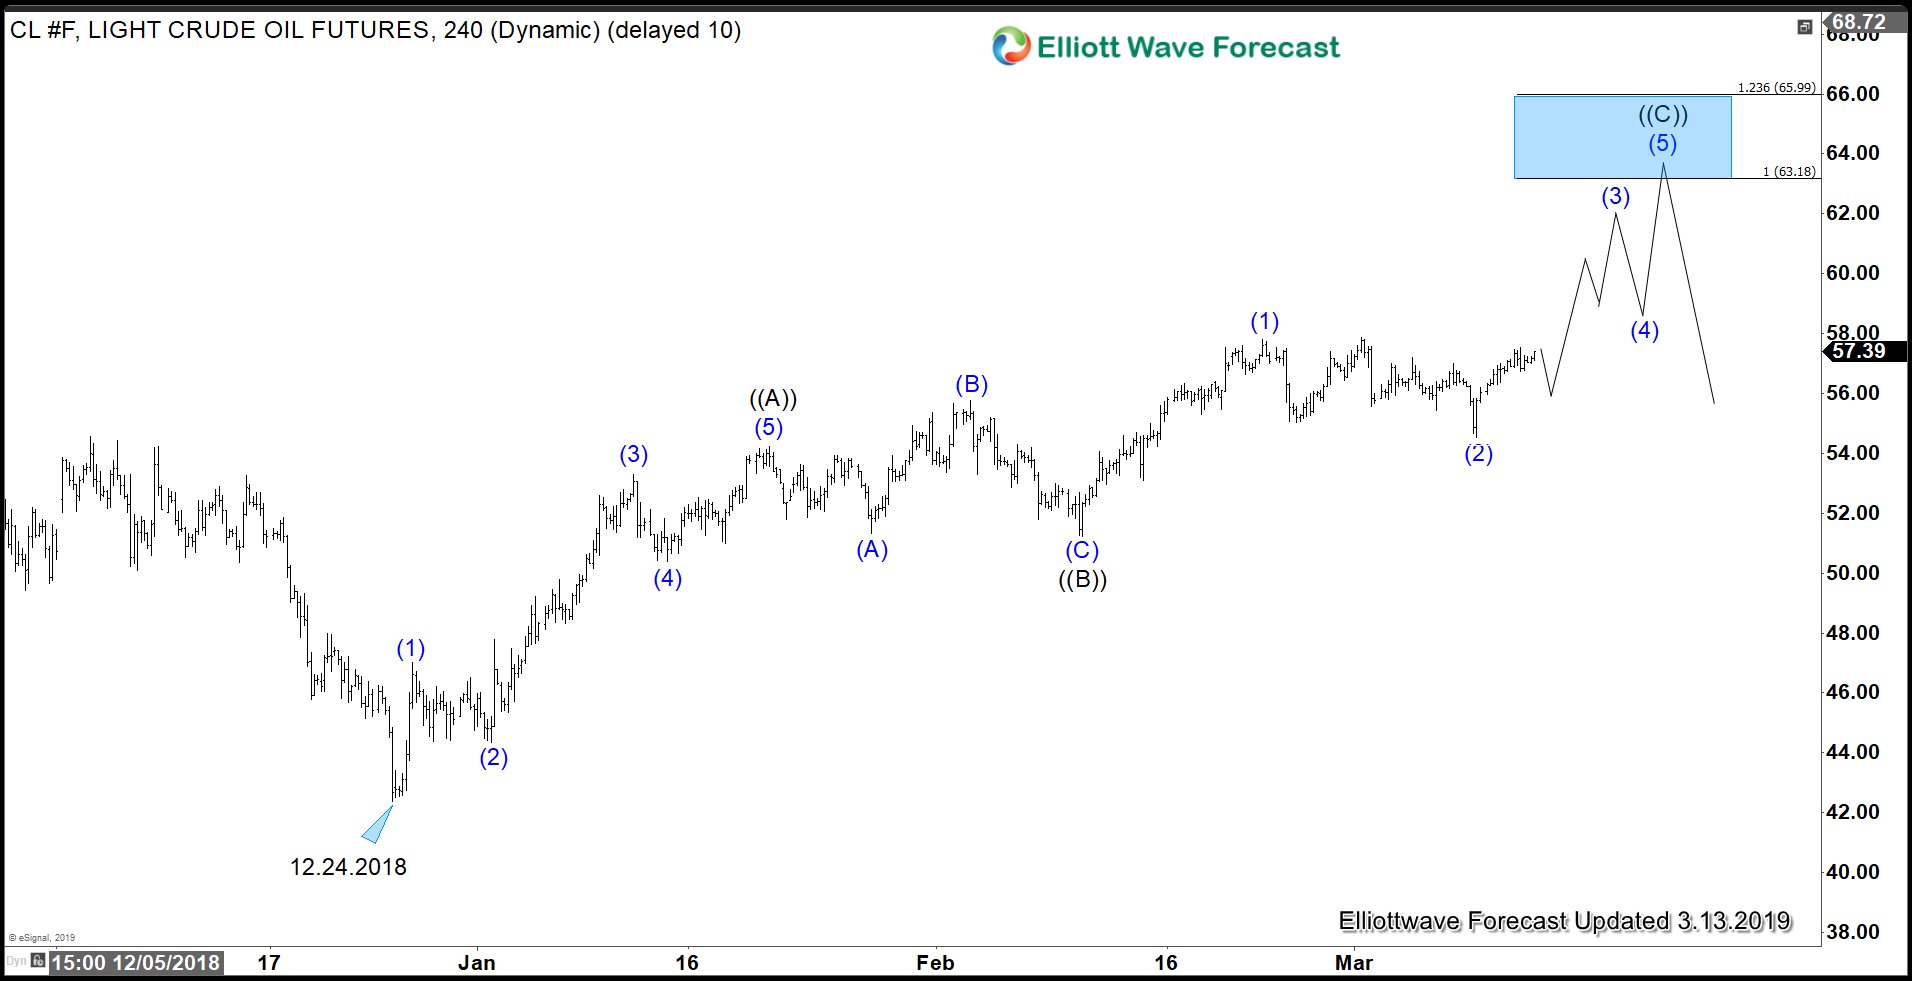
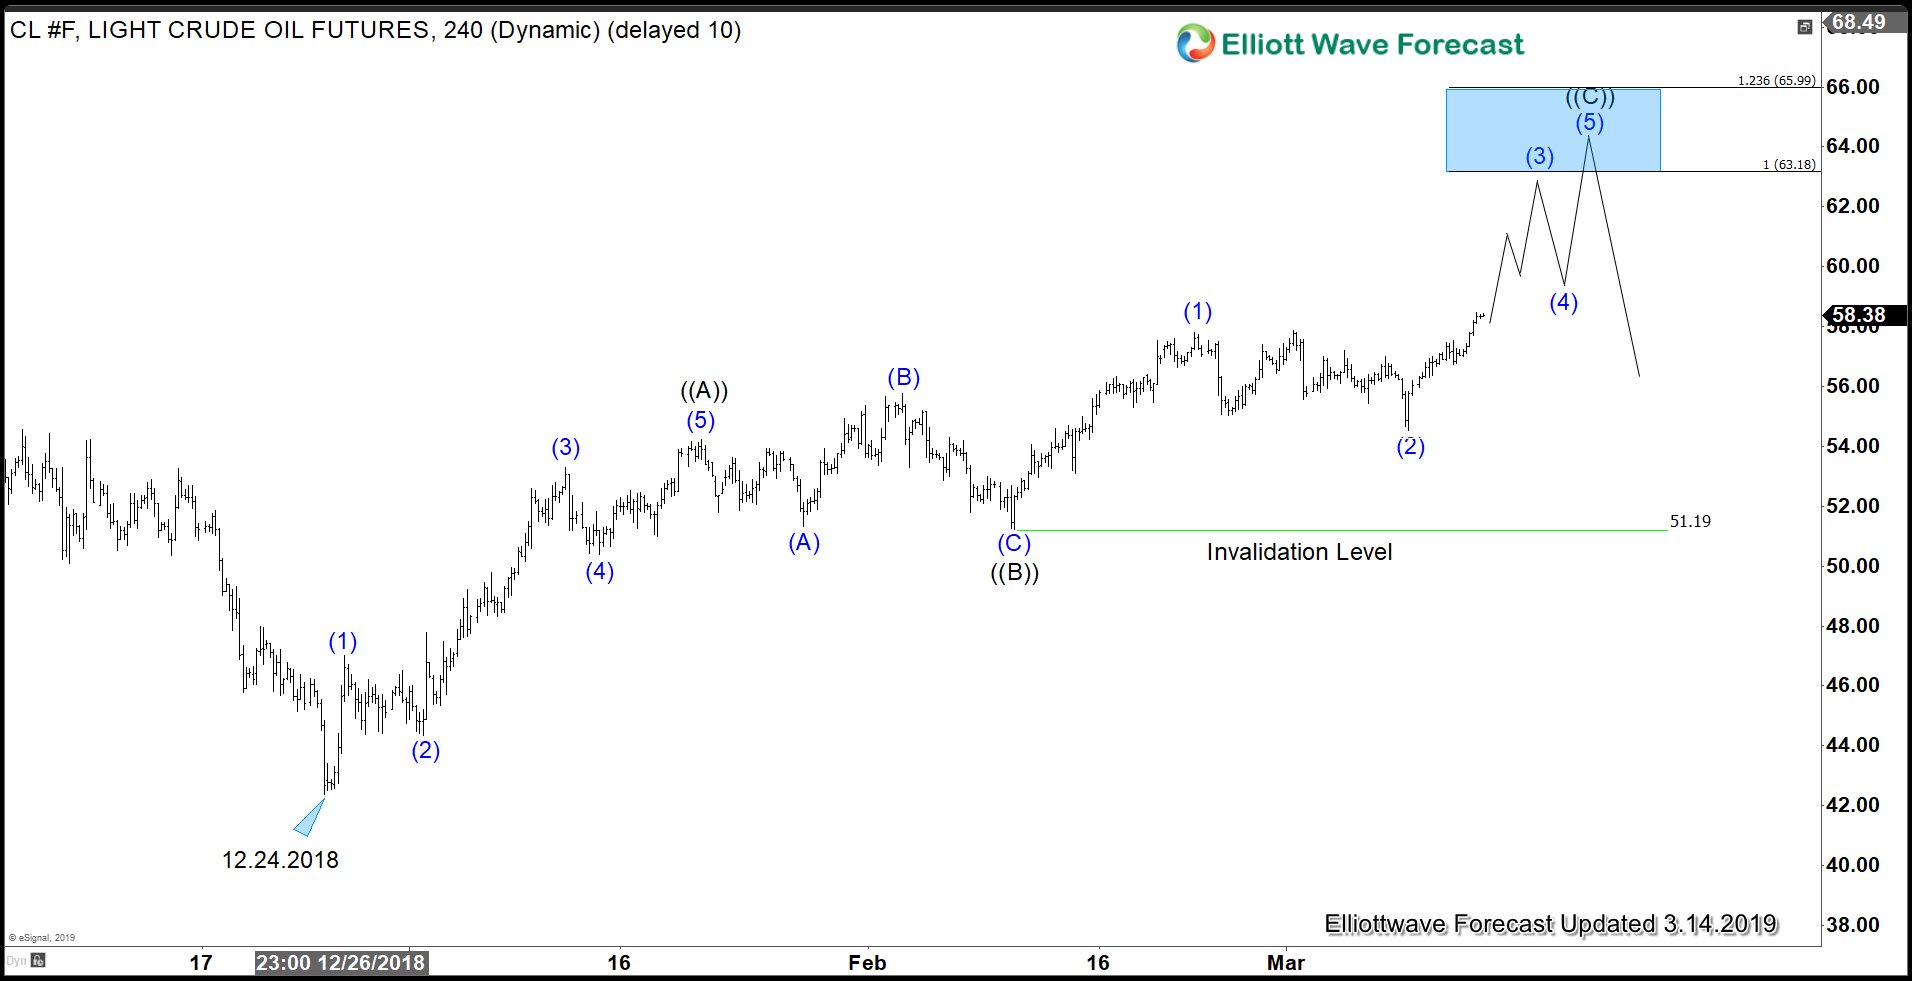
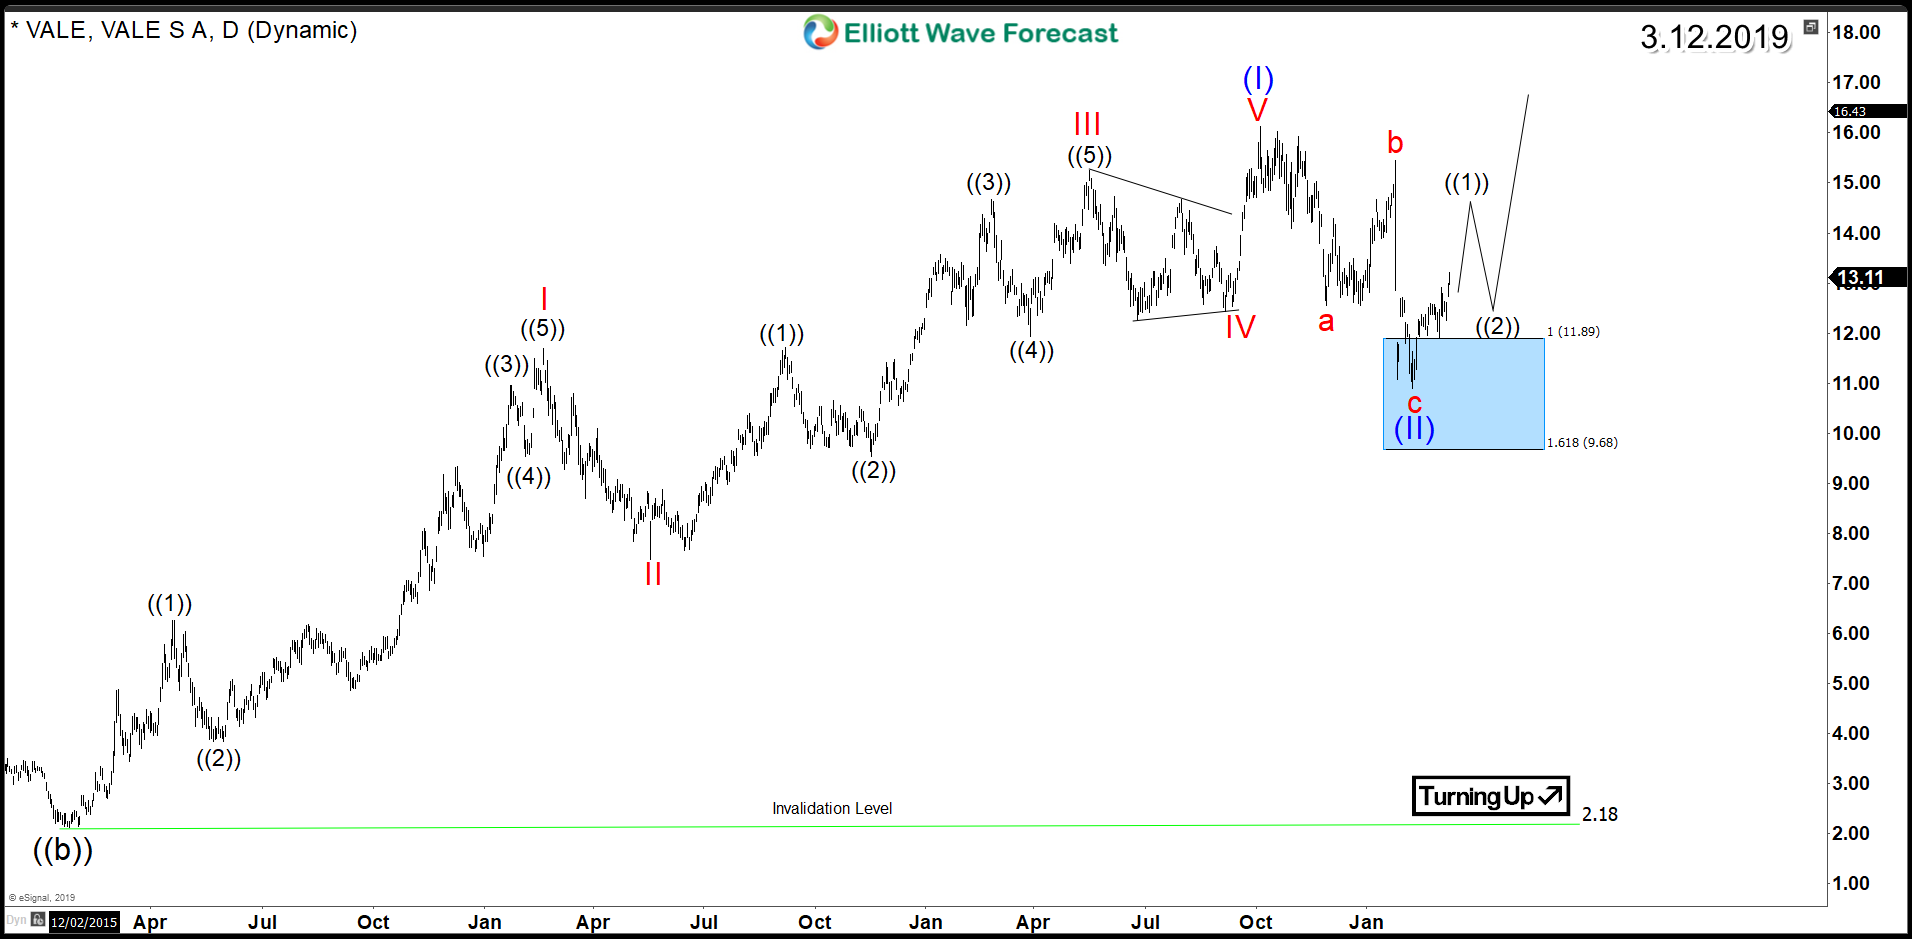
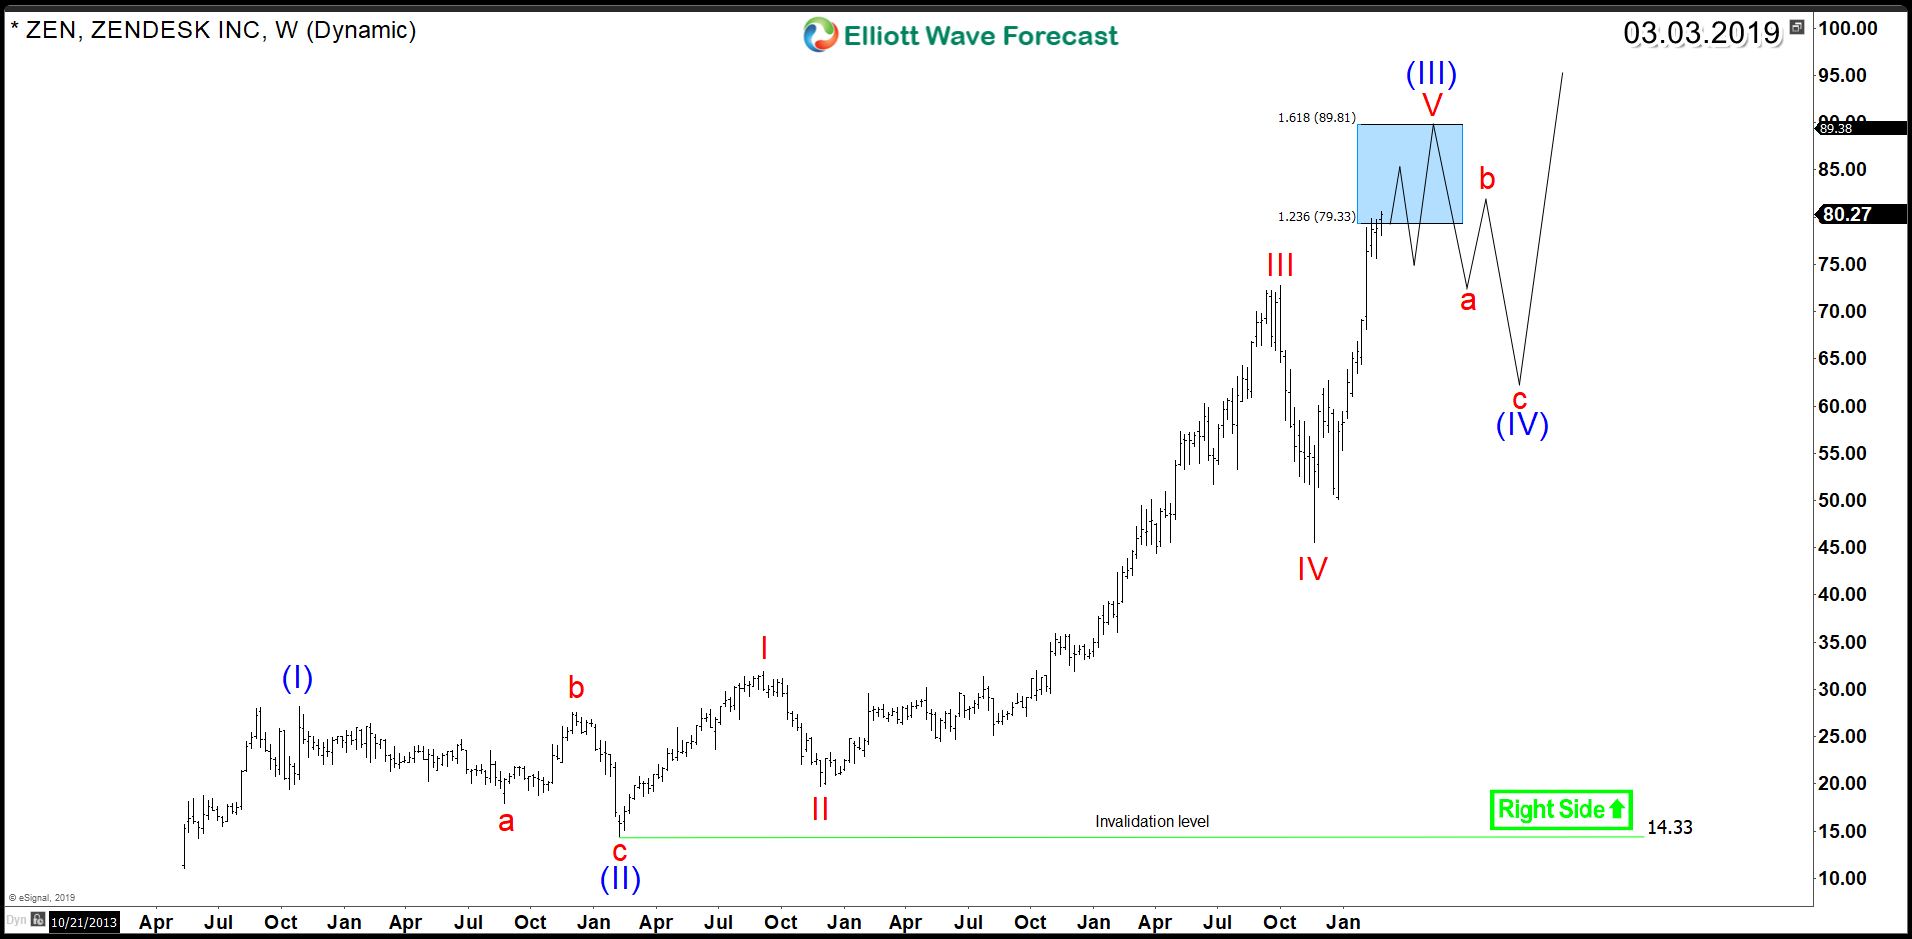
Since IPO, ZEN rallied higher in impulsive waves creating separation from 2014 & 2016 lows. The bullish trend taking place isn't mature yet as the stock is still trading within the strongest 3rd wave higher. In addition, after a larger correction in wave four, a fifth wave to the upside is expected to take place later on.

ZEN Weekly Elliott Wave Chart


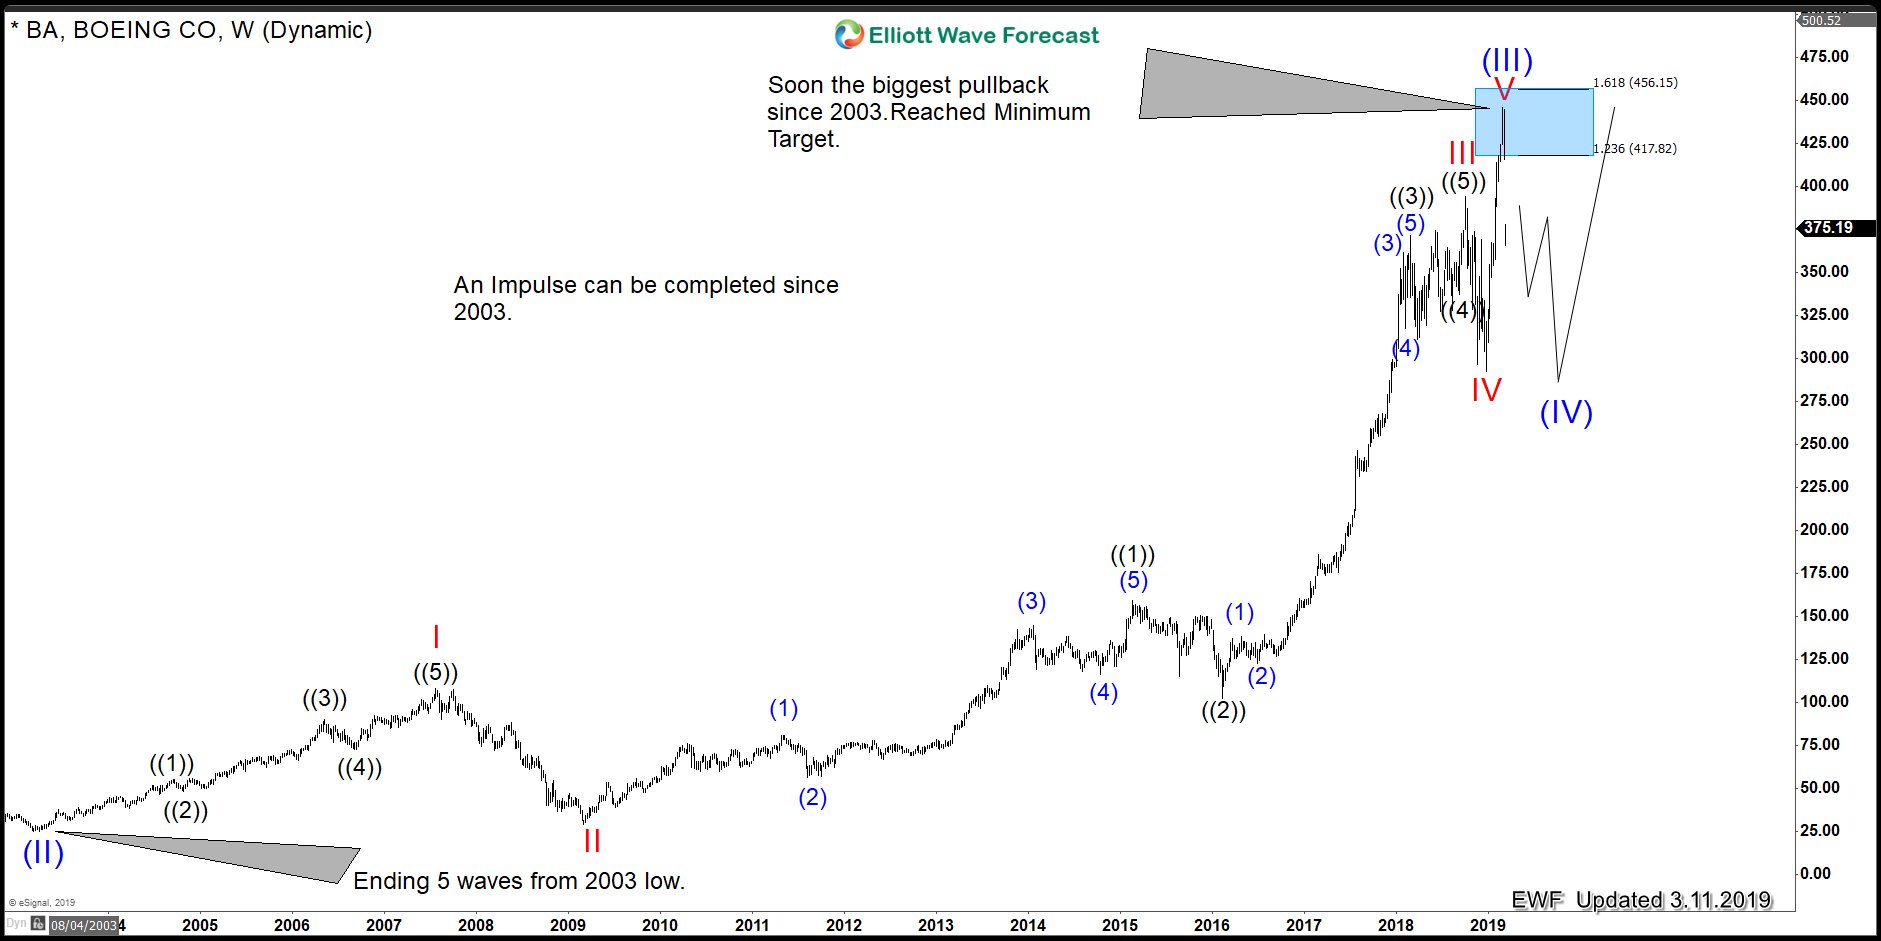
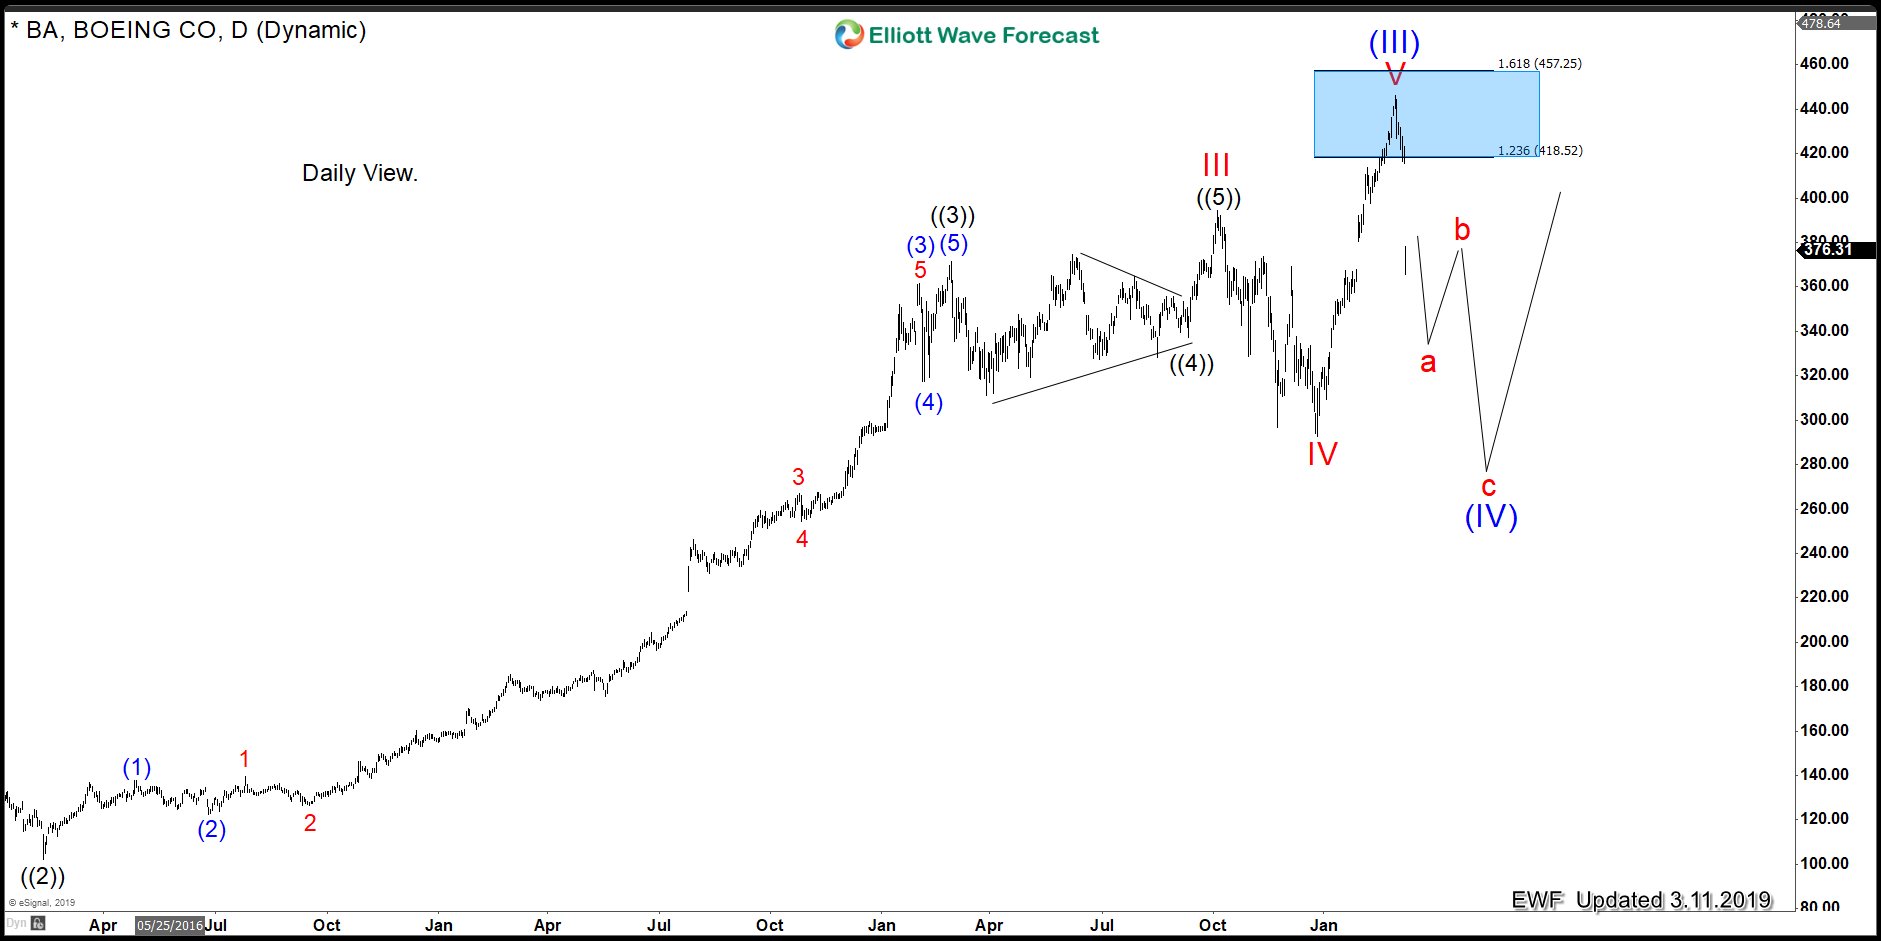
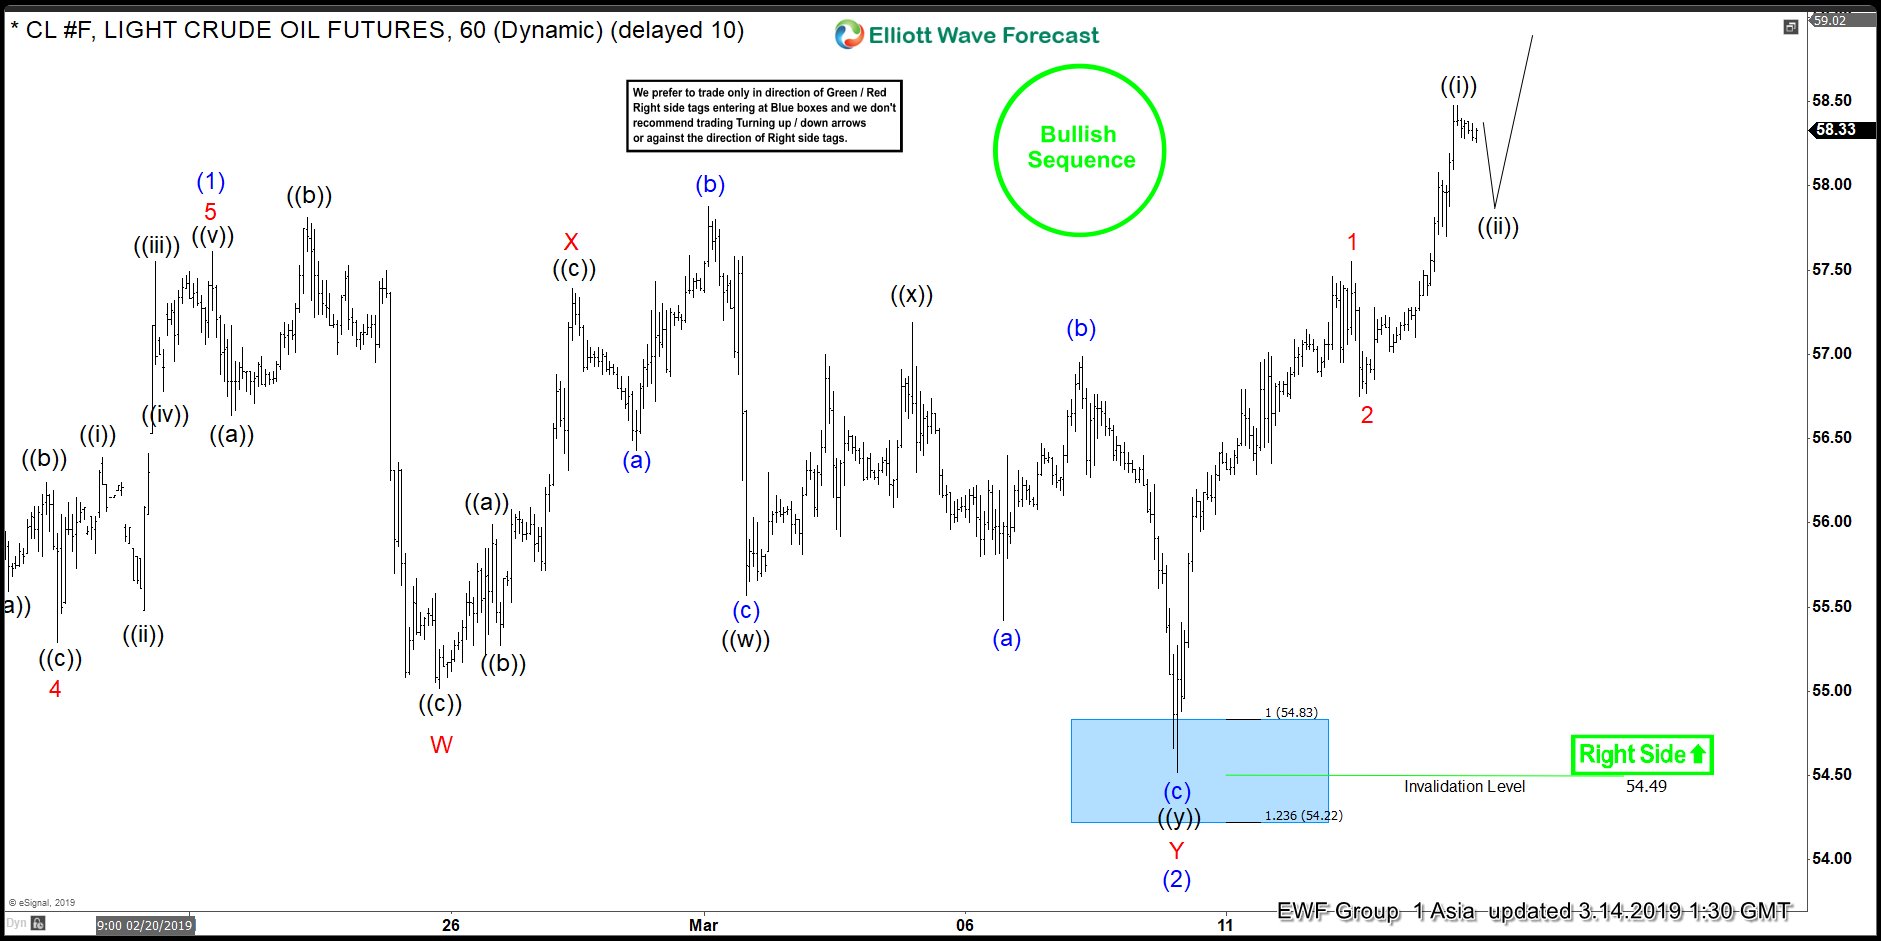
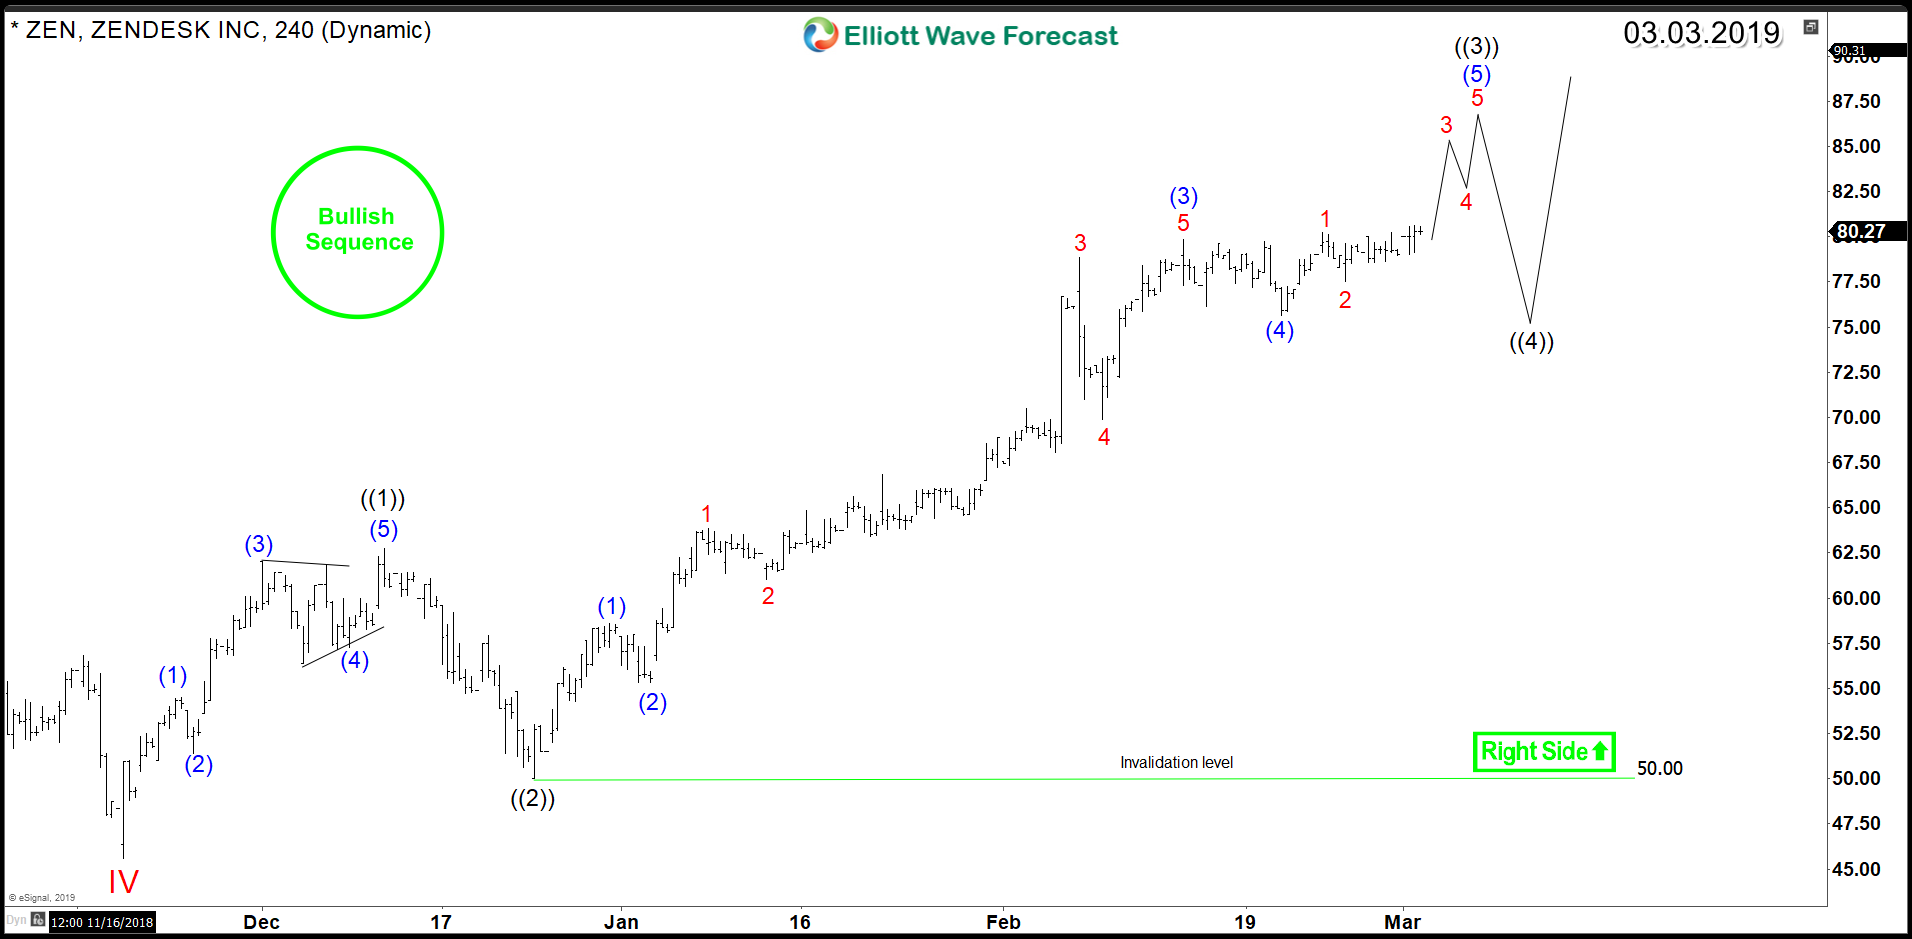
Technically, ZEN reached the minimum target area $79.33 - $89.81 for wave V of (III) presented in the above chart. However, the 4H cycle from December 2018 low is still suggesting further upside to be seen before ending another 5 waves rally. Consequently, short term pullbacks will remain supported and find buyers in 3 , 7 or 11 swings pullback against $50 low.

ZEN 4H Elliott Wave Chart


In conclusion, Zendesk bulls are in total control at this stage as technical picture is supporting a higher price for the stock in both short and long term. So if you are interested in investing or trading ZEN then you should keep an eye on the next pullback which can provide you with a good entry to join the rally.
 

Elliottwave-Forecast

Master Trader
Feb 17, 2017
2,453
9
84
www.elliottwave-forecast.com
Hello fellow traders. In this technical blog we’re going to take a quick look at the Elliott Wave charts of NASDAQ. As our members know recently we got pull back that was unfolding as Elliott Wave Double Three Pattern. We expected NASDAQ to find buyers again and trade higher due to incomplete bullish seqeuences in the December 26th 2018 low. In the following article, we’re going to explain the Elliott wave structure and Forecast.

NASDAQ 1 Hour Elliott Wave Analysis 2.27.2019
As we can see on the chart below , NASDAQ ended cycle from the 6841.79 low and now correcting it. Pull back is unfolding as Double Three - 7 swings structure, labeled as (W)(X)(Y) blue. As of right now pull back looks incomplete , missing equal legs from the peak. We're calling for more short term weakness in (Y) leg toward the blue box area : 7065.95-6998.04. As our members know, Blue Boxes are no enemy areas , giving us 85% chance to get a bounce. As NASDAQ is trading with the incomplete December's cycle , we expected buyers to appear there at the Blue Box for further rally or wave bounce alternatively. Consequently , we don’t recommend selling NASDAQ and favor the long side, buying the dips in the Blue Box area : 7056.95-6998.04.


NASDAQ 1 Hour Elliott Wave Analysis 3.3.2019
Eventually NASDAQ has reached Blue Box area at 7056.95-6998.04.and found buyers there. Short term pull back ended at 7048.25 low and we’re getting rally as expected. Now any longs from Blue Box areas are should be risk free. If not already long we would rather avoid chasing strength at this stage. Count has been change due to Market Correlation with other world indexes. This counts fits better at this stage as we have DAX, NIKKEI, STX now ending 5th swing in equivalent cycle from the December's 2018 low. More on that topic we explain in our Live Sessions and Chat Rooms .

Note: Market is dynamic and presented view could have changed in the mean time. Best instruments to trade are those having incomplete bullish or bearish swings sequences. We put them in Sequence Report and best among them are shown in the Live Trading Room.


Elliottwave-Forecast

Master Trader
Feb 17, 2017
2,453
9
84
www.elliottwave-forecast.com
Canada's Dollar slumped last Friday due to worse-than-expected gross domestic product data. Canada's economy practically grinds to a halt at the end of 2018. Real GDP grew by just 0.1 percent in the fourth quarter of 2018. This equals to 0.4% annualized rate, which is significantly lower than analyst expectations of around 1%. This is the worst quarterly performance in two and a half years. For the full year, Canada's economy grew by 1.8%, compared to the U.S. which grew by 2.9%. In December, Canada's economy actually contracted by 0.1%.


Statistics of Canada says the decline in crude oil prices hit the exports during the period, which contributes to reduce Canada's quarterly growth. The Loonie responded by weakening more than a full cent to 1.33 against the US Dollar. The Pound-to-Canadian-Dollar rallied more than 2 full cents as Poundsterling continues to be G10's best performing currency in 2019. Following the release, the market has started to reprice the odds of a Bank of Canada's rate hike lower. The report should reinforce the expectation of a prolonged rate hike pause by Bank of Canada.

GBPCAD 1 Hour Elliott Wave Forecast


Pair shows an incomplete bullish sequence from Aug 30, 2018 low and Jan 11, 2019 low, favoring further upside. The chart above shows right side stamp higher in green which suggests we don't like selling the pair. The rally from 1.6976 low is unfolding as a double three Elliott Wave structure where wave ((w)) ended at 1.755 and wave ((x)) ended at 1.735. Near term, while pullback stays above 1.735, and more importantly above 1.697, expect pair to extend higher. Potential target to the upside is 1.773 - 1.791 which is the 100 - 123.6% Fibonacci extension from January 14 low.
 

Elliottwave-Forecast

Master Trader
Feb 17, 2017
2,453
9
84
www.elliottwave-forecast.com
EURJPY SELL/SHORT Trade : Elliott Wave count for EURJPY shows wave ((a)) completed starting from the March 1/2019 highs and has since corrected higher to terminate possibly the wave ((b)) at the March 5/2019 high. Using Market Patterns together with a working Elliott Wave count allows traders to get more confirmation on which side to trade. In the chart below, there was a clear bearish Market Pattern (purple Head and Shoulders Bearish pattern) that had triggered SELLS on the break below the Neck Line which has pushed EURJPY lower. A possible Elliott Wave bearish Zig Zag 5-3-5 pattern, starting from the March 1/2019 high, can be forming so wavers should watch to see another 5 waves lower on the current wave ((c)) lower. There is still a possibility of an Elliott Wave expanded flat pattern where price can push higher above the March 5/2019 high but for now as long the March 1/2019 high holds the wave count remains valid for EURJPY to continue lower. We remain bearish EURJPY expecting to hit targets at lower prices.

EURJPY 15 Minute Chart 3.5.2019


Of course, like any strategy/technique, there will be times when the strategy/technique fails so proper money/risk management should always be used on every trade. Hope you enjoyed this article.
 

Elliottwave-Forecast

Master Trader
Feb 17, 2017
2,453
9
84
www.elliottwave-forecast.com
Short Term Elliott Wave view in S&P 500 (SPX) suggests the rally from December 26, 2018 low (2348.50) is unfolding as an impulse. Index has ended wave ((3)) of this impulse move at 2816.88. In the chart below, we can see wave (5) of ((3)) move from 2612.42 low subdivides in 5 waves impulse of a lesser degree. Up from 2612.42 low, wave 1 ended at 2738.98 and pullback to 2681.83 ended wave 2. Index then rallied again and ended wave 3 at 2813.49. Wave 4 pullback ended at 2775.13, and wave 5 of ((3)) ended at 2816.88.

Wave ((4)) pullback of the larger degree is currently in progress before Index resumes the rally higher in wave ((5)). The internal of wave ((4)) is unfolding as a zigzag where the first leg down to 2767.66 ended wave (A). While wave (B) bounce stays below wave ((3)) at 2816.88, expect Index to turn lower to continue the zigzag correction within wave ((4)). We believe dips in the Index still can see buyers in 3, 7, or 11 swing for 1 more leg higher in wave ((5)) before cycle from December 20, 2018 low ends. We don't like selling the Index.

1 Hour S&P 500 (SPX) Elliott Wave Chart
 

Elliottwave-Forecast

Master Trader
Feb 17, 2017
2,453
9
84
www.elliottwave-forecast.com
Short Term Elliott Wave view in EURAUD suggests the rally from February 21, 2019 low (1.5736) is unfolding as a 5 waves diagonal. Up from 1.5736, wave 1 ended at 1.6019 and the decline to 1.5803 ended wave 2. Pair then continues the rally in wave 3 to 1.6072 and pullback to 1.5935 ended wave 4. In the 1 hour chart below, we can see the internal of wave 3 unfolded as a 5 waves in lesser degree. Up from wave 2 at 1.58, wave ((i)) ended at 1.5963, wave ((ii)) ended at 1.5876, wave ((iii)) ended at 1.6046, wave ((iv)) ended at 1.5976, and wave ((v)) of 3 ended at 1.607.

Wave 4 pullback has ended as a double three Elliott Wave structure at 1.5935. Down from 1.607, wave ((w)) ended at 1.5965, wave ((x)) ended at 1.6038, and wave ((y)) of 4 ended at 1.5935. Near term, while pullback stays above 1.5935, but more importantly above 1.5803, expect pair to extend higher. We don't like selling the pair and expect further strength in the pair. Possible upside target wave 5 equal to wave 1 comes at 1.621 - 1.627 area.

1 Hour EURAUD Elliott Wave Chart
 

Elliottwave-Forecast

Master Trader
Feb 17, 2017
2,453
9
84
www.elliottwave-forecast.com
Short Term Elliott Wave view in DAX shows a bullish sequence structure from December 28, 2018 low, favoring further upside. The Index has potential to reach 100% extension towards 11912 - 12157 before ending cycle from December 2018 low. The rally from December 28, 2018 low is unfolding as a double three Elliott Wave structure where wave ((W)) ended at 11321.62 and wave ((X)) ended at 10865.31.

Wave ((Y)) rally is unfolding as a zigzag Elliott Wave structure. The first leg wave (A) of this zigzag ended at 11676.86 as 5 waves impulse. Up from 10865.31, wave 1 ended at 11217.3, wave 2 ended at 11018.95, wave 3 ended at 11556.87, wave 4 ended at 11416.08, and wave 5 of (A) ended at 11676.86. Wave (B) pullback is now in progress to correct cycle from Feb 9, 2019 low (10865.31) before Index resumes the rally higher.

Wave (B) pullback should unfold in 3, 7, or 11 swing. Down from 11676.86, wave W ended at 11551.45, and wave X ended at 11652.77. The next wave Y extreme area in 7 swing comes at 11442 - 11523 where buyers can appear for further upside or a 3 waves bounce at least. Alternatively, Index can also do a Flat correction in which case it can turn lower in 5 waves within wave C of (B) before buyers appear. As far as pivot at 10865.31 low stays intact in the pullback, expect Index to resume higher.

1 Hour DAX Elliott Wave Chart


[UPDATE] DAX 1 Hour Elliott Wave Analysis 3.7.2019

DAX found buyers in blue box in the chart above and bounced to reach 50% of the decline from red X peak (11652.77) and then it made a new low so we are now looking for 7 swings lower to complete wave (B) in 11445 - 11341 area where buyers should appear to resume the rally for new highs or produce a 3 waves bounce at least.


Elliottwave-Forecast

Master Trader
Feb 17, 2017
2,453
9
84
www.elliottwave-forecast.com
In this blog, we take a look at US Dollar Index correlation with USDPLN and we also look at the updated Elliott wave charts of USDPLN which have been working very nicely since we highlighted the bullish sequence in USDPLN back in February 2019. USDPLN had broken above the October 2018 peak and was showing 5 swings up from 9.26.2018 low which created a 5 swings bullish Elliott wave sequence and called for more upside after a pull back. We made it clear that our strategy was to look for buying opportunities in the dips.

Right after we published our blog, US Dollar started pulling back against PLN and retraced 50% of the rally from 1.31.2019 low. It also reached 100% Fibonacci extension of ((a))-((b)) down from the peak before bouncing again. Let's take a look at the updated Elliott wave charts of USDPLN forex pair.

US Dollar (USDPLN) Daily Elliott Wave Analysis 3.7.2019
USDPLN closed just below February 14 peak, rally from February 28 low appears impulsive as we will see on the 1 hour charts below which makes the break higher a very likely scenario. Break above February 14 peak exposes 3.9275 area which is 100% Fibonacci extension of blue (1)-(2) cycles where as 100% Fibonacci extension of red A-B lies just below at 3.92.


USDPLN 1 Hour Elliott Wave Analysis 3.7.2019
Rally from February 28 low appears to be unfolding as an Elliott wave impulse and it could be counted in two different ways as shown below. Once February 14 at 3.8594 is broken, expect buyers to appear again in the pull backs in 3, 7 or 11 swings for extension higher. Chart below shows the pair to be already within wave (iii) of ((iii)) which means pull backs would be shallow going forward until we reach 3.92 target area. Wave (iv) blue and wave ((iv)) black pull back later should offer short-term buying opportunities under this scenario.


This scenario suggests we are still in wave ((i)) and calls for a relatively larger pull back in wave ((ii)) once wave ((i)) completes before pair continues higher in wave ((iii)) of C. Wave ((ii)) pull back should see buyers appear in the pull backs after 3, 7 or 11 swings.


Elliottwave-Forecast

Master Trader
Feb 17, 2017
2,453
9
84
www.elliottwave-forecast.com
In today's blog we will look at Bank of America's chart (BAC) which shows a blue box. This blue box represents the inflection area where a reaction in 3 waves at least can happen. Below, you see the 1-hour updated chart presented to our clients on the 02/28/19.

From 02/08/19 low (27.88) the stock ended the cycle at 01/27/19 peak (29.68) in blue wave (1). Below from there, we advised members that it should see the equal legs from that peak towards the areas of the 100 - 1.618 Fibonacci extension of red wave W-X which came around 29.07-28.77 and unfolded as an Elliott Wave Double Three structure. Therefore, we expect buyers to appear in the sequences of 3, 7 or 11 swings. The blue box which you can see below was the first area for buyers to appear to take prices to a new high above 02/02/19 (920.16) peak. Or a larger 3 waves reaction at least.

Bank of America 1 Hour Chart Elliott Wave Analysis 02/28/2019


In the subsequent Elliott Wave chart update below, you can see that BAC reached the blue box area nearly perfectly. Then it showed a reaction higher. Any long from the blue boxes should be risk-free as it reached the 50% back of the decline from the wave ((x)). In this chart, you can see that we can't control whether it makes a new high or just reacts higher. For any long position taken in the first blue box, the stop should be moved to break even. Which means even when it makes another new low you won't lose any money on that trade. And in case it makes another new low, the market should find buyers again in 7 swings lower (second blue box) for a 3 waves reaction higher again. This shows how our Trading strategy at Elliottwave-Forecast allows us to create fast risk-free positions. Do please keep in mind that the 1-hour chart which I presented have changed already. The blue boxes you see in our charts are our so-called High-Frequency boxes. Where the market ideally shows us a reaction either lower or higher.

Bank of America 1 Hour Chart Elliott Wave Analysis 03/04/2019


[UPDATE] BAC 1 Hour Elliott Wave Analysis 3.8.2019

BAC found buyers in the blue box in the chart above and bounced, and made again a new low. During the new low the pivot at 27.86 in our distribution system gave up suggesting that the higher degree cycle from 12/24/18 low has ended at 01/25/19 peak (29.73). Looking now for extension lower towards the first equal legs of red A-B which comes at around 27.92-26.83 where a reaction higher can be seen. As long as the bounces stay below 29.67 peak it is now expected to extend lower.


Elliottwave-Forecast

Master Trader
Feb 17, 2017
2,453
9
84
www.elliottwave-forecast.com
The Stock is trading within a very technical area and it is showing a very clear 5 waves advance Elliott wave structure from its 2013 lows. When a 5 waves structure can be seen we always should be careful and pay attention to the direction of the 5 waves. Accordingly, to the Elliott Wave Theory after a 5 waves move there should be a pullback in 3 waves coming soon. The Boeing Company has been in the news lately because of an unfortunate accident related to their top-selling Aircraft which is the 737 MAX 8 jet. An Ethiopian Airlines flight crashed on Sunday only five months after the Lion Air Boeing crash in Indonesia killing 189 people.

These bad news came inline with ending the 5th wave accordingly to the Elliott Wave Theory. Consequently, a bigger pullback was expected against the main trend. In the charts below you can see the Boeing stock in the Monthly, Weekly and Daily Time frame. And when we related the price action in Boeing to other World Indices and stocks it is very possible that the blue degree wave (IV) can be around the corner. Boeing is part of the Dow Jones Industrial Average and takes the biggest percentage Weight in the Index. Which translates that a decline in Boeing will have a greater impact on the Dow Jones Industrial Average then other stocks.

The Following chart shows the Monthly view of the stock showing the idea that blue wave (III) can be ending within the Grand Supercycle. We see a nesting structure at lower levels. And from its all-time low it is unfolding as a very clear 5 waves Elliott Wave impulse. The alternative view, however, is that the stock is just correcting the cycle from 12/26/18 cycle and can still extend within wave V.


Boeing Monthly Elliott Wave Chart 03/11/2019

The following chart is showing the weekly view and its impulsive structure from 2009 lows. The move is clearly defined and very technical and the pullback can reach the levels of previous red wave IV at around 275 area.


Boeing Weekly Elliott Wave Chart 03/11/2019

The next chart is showing the daily Elliott Wave view. You can see that the stock reached the blue box area and ended red wave V of blue wave (III). And clearly ended the cycle from 12/26/18 low.


Boeing Daily Elliott Wave Chart 03/11/2019

As we always say to our members at Elliott Wave Forecast. The Elliott wave Theory can warn traders about future moves but more importantly, it can show the map of the Market.
 

Elliottwave-Forecast

Master Trader
Feb 17, 2017
2,453
9
84
www.elliottwave-forecast.com
Hello fellow traders. In this technical blog we’re going to take a quick look at the charts of AUDNZD published in members area of the website. As our members know, AUDNZD has incomplete sequences in the cycle from the January 21st (1.0673) peak. Break of 02/06 low made January cycle incomplete to the downside, which suggesting the pair is now bearish against the 1.05478 peak . Consequently , we advised clients to avoid buing AUDNZD and keep on selling the rallies when given the opportunity. In the charts below, we’re going to explain the Elliott Wave structure, forecast and trading strategy.

AUDNZD Elliott Wave 1 Hour Chart 2.20.2019
As we can see at the charts below, AUDNZD is bearish against the 1.05478 peak . Proposed short term bounce seems to be unfolding as a Elliott Wave Double Three pattern. Recovery has scope to make another leg up toward Blue Box area , where we would like to be sellers against the 1.05478 peak. We recommended members to sell AUDNZD at the blue box ( 1.04563-1.04973 ) for further downside. As we have incomplete bearish sequences in August cycles, we expect sellers to appear at that area for further delcine ideally or 3 wave pull back alternatively. Stop Loss of the trade is a break above 1.618 Fibonacci extension (1.04973 )


AUDNZD Elliott Wave 1 Hour Chart 2.21.2019
The pair has made proposed leg up and found sellers right at the blue box : 1.04563-1.04973 . We have already got decent reaction from the selling zone and calling recovery completed at 1.04853 as (b) blue . As a result members who took short trades are now enjoying profits with risk free positions. While below current short term high and more importantly while pivot at 1.05478 high holds we expect further weakness.


AUDNZD Elliott Wave 1 Hour Chart 2.25.2019
In the mean time we got another marginal high, which has throw out many sellers out the trades. Count has changed little bit, when now most recent high is end of (b) blue recovery. Anyway pivot at 1.05478 high has held all the time, and we are calling for further weakness ideally due to incomplete bearish sequences we have in January cycle. Now we would like to see break of 02/14 low to confirm next leg down is in progress.

Keep in mind marked is very dynamic and proposed view could have ended in the mean time.
Best instruments to trade are those having incomplete bullish or bearish swings sequences. We put them in Sequence Report and best among them are shown in the Live Trading Room.


Elliottwave-Forecast

Master Trader
Feb 17, 2017
2,453
9
84
www.elliottwave-forecast.com
In this blog, I want to share with you some Elliott Wave charts of EURGBP which we presented to our members recently. You see the 1-hour updated chart presented to our clients on the 03/09/19. The higher degree trend of the pair is to the downside. So our members know that the right side is to the downside. Consequently, we advised members that we do like the selling of the EURGBP.

EURGBP ended the cycle from 02/14/19 peak in black wave ((w)) at 02/27/19 low (98.96). Above from there, we expected a bounce to occur in black wave ((x)). The bounce unfolded in an Elliott Wave Zig Zag correction structure. We advised members that EURGBP should continue lower and that we wanted to sell the pair. Therefore, we expected sellers to appear in the sequences of 3, 7 or 11 swings. At the 100 - 1.618 Fibonacci extension of blue (a)-(b) which came at around 0.86531-0.87263 area and that was the first area for selling the EURGBP for us with a potential stop loss above 0.87274 invalidation level.


EURGBP 03.09.2019 1 Hour Chart Elliott Wave Analysis


In the last Elliott Wave chart. You can see that the EURGBP reached the blue box area. So we opened a short position at the blue box (0.86531). The pair extended a little bit into the blue box but then it reacted nicely lower. Any trades from our blue box area shown in the chart above were risk-free, which means the stop-loss should be moved to break even, looking now for another extension lower. Please keep in mind that the 1-hour chart which I presented has changed. This blog should just illustrate how accurate our blue boxes are, and how our members trade our 3-7 or 11 swings strategy.

If you are interested in how to trade our blue box areas and want to understand how Elliott Wave works. Then I recommend you to get a shot on our special promotion which we are currently running below. We present a lot of trading setups in our 3 Live Trading Rooms.


EURGBP 03.11.2019 1 Hour Chart Elliott Wave Analysis


I hope you liked this blog and I wish you all good trades. Hope to see you soon again.
 

Elliottwave-Forecast

Master Trader
Feb 17, 2017
2,453
9
84
www.elliottwave-forecast.com
Gold has ended the cycle from August 16, 2018 low at $1347.18 as wave (A). The yellow metal is in the process of correcting the cycle from August 16, 2018 low in 3, 7, or 11 swing within wave (B). Near term, the decline from $1347.18 looks impulsive and ended wave A at $1280.49. The internal of wave A unfolded as a 5 waves impulse Elliott Wave structure. Down from $1347.18, wave ((i)) ended at $1320.79 and rally to $1333.13 ended wave ((ii)). Gold then resumed lower in wave ((iii)) at $1282.7, bounce to $1288.53 ended wave ((iv)), and finally wave ((v)) of A ended at $1280.49.

Wave B bounce is in progress to correct cycle from Feb 20, 2019 peak in 3, 7, or 11 swing. Current structure of wave B bounce is unfolding as a zigzag Elliott Wave structure. Up from $1280.49, wave ((a)) ended at $1300.8 and wave ((b)) ended at $1290.2. Expect Gold to see profit taking and sellers at $1310.67 - $1323.36. From this area, the yellow metal can either extend lower below wave A or at least pullback in 3 waves. As far as the current rally fails below $1347.18, we can't rule out another leg lower to continue the correction from August 16, 2018 low.

1 Hour Gold Elliott Wave Chart
 

Elliottwave-Forecast

Master Trader
Feb 17, 2017
2,453
9
84
www.elliottwave-forecast.com
In this technical blog, we are going to take a look at the past performance of XLE Elliott Wave 1-Hour Charts that we presented to our members. In which, the cycle from 12/24/2018 low took place as a zigzag structure where wave (C) in intermediate degree unfolded as an ending diagonal structure. While a rally to $65.27 high ended wave 1 and a pullback to 2/08/2019 low $61.87 ended wave 2.

Up from there, the ETF rallied higher in 5 waves structure & made new high above the prior peak at $65.27 high confirming the next leg higher. It's important to note here that with this rally higher the cycle from 12/24/2018 became bullish & right side turned green against $61.87 low. Therefore, our strategy remains buying the dips in 3, 7 or 11 swings as far as a pivot from $61.87 low stays intact. Now let's take a quick look at past charts below.

XLE 1 Hour Elliott Wave Chart From 2/21/2019


Above is the 1 hour updated Chart from 2/21/2019 Midday update, in which XLE the rally to $66.93 high ended wave ((a)) of a zigzag structure within wave 3. Down from there, ETF corrected the cycle from 2/08/2019 low $61.87 in wave ((b)) pullback & our strategy remain to buy those dips in 3, 7 or 11 swings looking for 3 wave reaction higher at least.

XLE 1 Hour Elliott Wave Chart From 2/28/2019


XLE 1 hour Chart from 2/28/2019 Pre-Market update, in which ETF is doing a 3 wave pullback in wave ((b)). The internals of that pullback unfolded as Elliott wave zigzag structure where lesser degree wave (a) at $65.33. Wave (b) bounce ended at $66.59 high and wave (c) of ((b)) was expected to reach 100%-161.8% Fibonacci extension area of (a)-(b) at $64.98-$63.99 blue box area before next leg higher starts. Therefore, we advised our members to buy that blue box area looking for another extension higher or for 3 wave reaction higher at least to allow them to go risk-free position.

XLE 1 Hour Elliott Wave Chart From 3/05/2019


XLE 1 Hour Chart from 3/05/2019 Pre-Market update, showing ETF reaction higher taking place from the blue box area at $64.98-$63.99 allowing members to create a risk-free position in that bounce. Blue boxes on our charts are high-frequency trading areas and are expected to produce reaction higher in 3 swings at least. The blue boxes are often referred to no-enemy areas as they have 85% probability to give us a reaction into the direction of right side tags (either Green/Red).

XLE 1 hour Elliott Wave Chart From 3/10/2019


1 Hour Chart from 3/10/2019 weekend update, showing ETF doing double correction lower & reaching another blue box area at $63.83-$62.83. Expecting ETF to make a reaction higher in 3 swings at least. Note, we have adjusted the count slightly based on distribution & pivot system.
 

Elliottwave-Forecast

Master Trader
Feb 17, 2017
2,453
9
84
www.elliottwave-forecast.com
Patience is Paying Off for Traders that are Long XLP
After consolidating sideways for over two weeks XLP appears to be rewarding longs for their patience. Since 12/26/2018, XLP has risen from a low of $48.33 to its most recent high of $54.84 on 2/19/2019. This represents a 13.47% gain trough to peak. During that time the ETF developed a bullish sequence on the 1 hour time frame. Subscriber traders were then on alert for a trade with regards to our proprietary 1 hour cycle analysis.

Subscribers of ElliottWave-Forecast know this sequence analysis is an integral part of the process to recognize when and in what direction to initiate trades. This gives our traders the highest probability that they are entering not only on the right side in relation to the time frame but also entering at the extreme measurements. Entering at the extreme allows the best reward vs. risk. This plotting, mapping, and ultimately patience allows for more successful trading. We find the system paramount in executing a consistent repeatable process.

The Near Term Setup in XLP


The plotting of the Elliott wave structure from the 2/19/2018 high suggests a corrective double-three structure in play. The labeling is (W) - (X) - (Y) in blue. A common relationship is that the length of (W) from the start of the correction ($54.84-$53.75 in this case) equals the projections for (Y) from the origin of (X). In more simpler terms, $54.84 - $53.75 or $1.09 = $54.55 - $1.09 or $53.46. Consequently the target for the end of (Y) and to complete the double-three correction from the above measurement is $53.46.

During our daily Group 3 Live Session on 3/8/2019 we were keen to suggest longs just above the $53.46 level at $53.50. As long as the invalidation level at $52.79 held the right side to trade was bullish. With a print of $53.45 on 3/8/2019 the trade is now live. Hence the follow up was how to manage the long in XLP going forward.

The Reaction
 

Elliottwave-Forecast

Master Trader
Feb 17, 2017
2,453
9
84
www.elliottwave-forecast.com
Oil prices rose 1 percent on Monday after Saudi Arabia reiterated that OPEC will continue to maintain the production curb. Riyadh plans to keep output well below 10 million barrels per day and reduces export to below 7 million barrels a day. Saudi's Minister has said it's too early to change the policy until at least June when OPEC will meet again. The oil market has received broad support this year due to the 1.2 million barrels per day supply cut by OPEC members. Other major non-OPEC producers like Russia has also agreed to limit the production output, helping to support prices.


In addition, the political and economic uncertainty in Venezuela further reduces the oil output. Venezuela is an OPEC member with the world's largest oil reserves. The output from Venezuela has collapsed due to the US sanction and the recent 4 day power outages causing the shutdown in oil export terminal and crude processing complex.


Oil (CL_F) 4 Hour Elliott Wave Chart


Since bottoming at $42.36 on December 24, 2018, Oil shows a sequence of higher high and higher low. The entire rally can be counted as a zigzag Elliott Wave structure where the first leg wave ((A)) ended at $54.24 as 5 waves. Wave ((B)) pullback then ended at $51.23 as a Flat Elliot Wave structure. Current rally can still extend higher within wave ((C)) towards $63 - $66 area where wave ((A)) is equal to wave ((C)) in length. This view will gain more validation if price is able to break to new high above March 1, 2019 high ($57.88). Look for continuation in Oil's strength in the second quarter of 2019 once $57.88 breaks.
 

Elliottwave-Forecast

Master Trader
Feb 17, 2017
2,453
9
84
www.elliottwave-forecast.com
In our previous Chart of The Day on February 28, we suggested that Crude Oil (CL_F) is on the verge of a breakout. It has now confirmed our view as price extends higher and breaks above March 1 high at $57.88. The production output's curb by the OPEC members as well as the political upheaval in Venezuela have contributed to the strength in Oil. Technical wise, the sequence remains bullish from both Dec 24, 2018 low and Feb 11, 2019 low. In the chart below, we can see a bullish sequence stamp and right side up to clearly show the direction that we prefer.

Since forming intermediate high on February 21 at $57.61, Oil has been in sideways and complex correction. The rally to $57.61 ended wave (1), and wave (2) pullback has ended at $54.49. The internal of wave (2) unfolded as a double three Elliott Wave structure. Down from $57.61, wave W ended at $55.02, wave X ended at $57.39, and wave Y of (2) ended at $54.52. Oil has since rallied and broken to new high above March 1 high ($57.88). This confirms the view that the next leg higher has started. Near term, while dips stay above $54.49, expect Oil to resume higher. A 100% extension from December 24, 2018 low can see Oil reaching $63.2 -$66 area next. The 4 hour chart below shows the sequence of higher high and higher low since December 2018 low.

1 Hour CL_F Elliott Wave Chart


4 Hour CL_F Elliott Wave Chart


Elliottwave-Forecast

Master Trader
Feb 17, 2017
2,453
9
84
www.elliottwave-forecast.com
Vale is a Brazilian multinational mining corporation and also is the largest producer of iron ore and nickel in the world.

In 2016, many commodities saw significant moves to the upside with the rise of Oil and Gold prices. The move helped metal & mining sector to recover after 5 years of decline and many stocks started a new cycle higher.

Vale was one of the outperforming stocks during that period rallying higher for 2 years from $2 to $16. However, on October 2018, the stock hit the 10 years descending trend-line from 2008 and ended the cycle from 2016 low.

Despite failing to break above the trend-line, Vale ended the bearish cycle from 2008 as the pivot around 2011 peak has gave up in our system. We use our proprietary pivot system to tell us when a cycle has ended and when an instrument need to switch to a different degree. Therefor, Vale will be looking to either start a new bullish cycle to the upside or at least correct in a big 3 waves bounce toward the 50% - 61.8% area ($23 - $28).

Vale Weekly Chart 3.12.2019


Based on the Elliott Wave Theory, Vale rally from 2016 low was an impulsive 5 waves move which was followed by a 3 waves pullback into blue box $11.89 - $9.68 that represents a high-frequency area where the markets are likely to end cycles and make a turn.

Up from there, the stock started bouncing higher again aiming for a break above 2018 peak to start the next cycle to the upside. However, until it breaks that peak, Vale could still make a double correction lower toward $9.13 - $7.47 area before buyers show up again for another bounce.

Vale Daily Chart 3.12.2019


Recap

Vale is looking for a larger recovery after ending a 10 years bearish cycle and a break above the descending trend-line will trigger the move to the upside. Consequently, investors should keep a close eye on the stock as a break higher would provide a tradable bullish sequence.
 

Elliottwave-Forecast

Master Trader
Feb 17, 2017
2,453
9
84
www.elliottwave-forecast.com
Is There a Bottom for SNAP ?
On March 3, 2017 shares of Snap Inc ( NYSE: SNAP ) printed a now all-time high of $29.44. Ever since then the social media/ camera company has seen very little positive sentiment. Just a couple of short months ago now SNAP hit its lowest price since its 2017 IPO printing $4.82/share on December 21, 2018. After a near 84% drop in share prices peak-to-trough we contend that we are starting to see green shoots of positivity appearing for the company with regards to the share price.

Sentiment
At the present SNAP represents one of the top 6 shorted stocks on the NYSE. As of 3/12/2019 nearly 17.8 % of the stock's float are shares that are short. That's quite a number no doubt. Considering the daily average trading volume, it would take approximately 4 days for investor's to cover their short. This produces both a problem and an opportunity. Stocks with such a heavy short interest are sometimes hidden jewels from an investment point of view. They also could be junk. After all they're being shorted heavily for a reason.

On one side you have a crowd. A heavily shorted stock says there are a LOT of people that are betting against SNAP. Consequently, logic would lead one to purport a strong case that the stock heads lower. On the other side though, being such a heavily shorted stock, also represents a TON of money betting on the stock going down. As most of you know when seemingly everyone is running the same direction it usually doesn't end well for the crowd. And so, one little piece of "good news" could ignite a rally as investors whom are short rush to cover. As most of you know this is a classic short squeeze and it happens all the time. But, is it happening (or about to happen) in SNAP?

Blindly going long SNAP just because the price seems "low" relative to its all-time high is not the best investment strategy. Nor is buying a stock that is heavily shorted just to be contrarian. So, let's look at a Daily chart for one interpretation of the Elliott wave count for SNAP.

The Wave Count
A very simple yet powerful aspect of the wave principle is the fact that it gives the practitioner perspective. There is perhaps nothing more paramount to wave practitioners than extremes in mass sentiment. As stated above there appears to be an extreme negative sentiment in SNAP. At extremes there are opportunities.

Before we get into any wave analysis I want to introduce that we are granting 2 assumptions here. One being the progress from inception of Snap Inc, to the IPO high is indeed a fist wave up. And, two that SNAP isn't going to zero.

So, if the $29.44 is the top of wave I the rules of Elliott wave state that there will be a corrective sequence against that high in the same degree. In this case it is to the downside as shown in the chart below for SNAP. I believe we are seeing evidence now that that correction is complete at the $4.82 low.


Green Shoots ?
The chart above proposes a simple double three corrective structure for wave II. If we have indeed ended the wave II there then we would look for a smaller degree motive wave up to set the stage for a confirmation of a bottom. In the chart you can see the break of a downward trendline that has contained SNAP prices since August of 2018. Also, there is an acceleration gap consistent with separation seen in third waves in the February price action. We haven't see any acceleration gaps to the upside since February of 2018 (and even that one was part of a upward correction) as most of the gaps have been to the downside.
 

Elliottwave-Forecast

Master Trader
Feb 17, 2017
2,453
9
84
www.elliottwave-forecast.com
Lockheed Martin Corp (NYSE: LMT) is the largest defense, aerospace and advanced technologies company based in the United States employs approximately 105000 people worldwide. The company operates mainly on four business segments i.e Aeronautics, Missiles & Fire control, Rotary & Mission system and Space systems. It's the world's largest defense contractor based on revenues in the fiscal year of 2014.

So far the stock that has seen a price change of 16.25% so far this year. Currently paying a dividend of $2.2 per share, the company has a dividend yield of 2.89%. In comparison, the Aerospace defense industry's yield is 0.96%, while the S&P 500's yield is 1.96%. The company's current annualized dividend of $8.80 is up 7.3% from last year. In the past five-year period, Lockheed Martin has increased its dividend 5 times on a YOY basis for an average annual increase of 10.57%. Indicating a highly optimistic Future ahead which could attract more investors.

However, in this blog, we will be taking a look at the technical picture of the stock using the Elliott wave theory to identify future price action in the stock below.

LMT Weekly Elliott Wave Chart


Looking at Weekly chart, the cycle from all-time lows is unfolding in powerful impulse Elliott wave structure in Grand Super Cycle degree. Looking to extend higher towards $391.06-$437.50 in 5 waves structure to end the cycle from Oct 1999 low in wave ((III)). And then from there, the stock is expected to see a bigger 3 wave pullback in Grand Super Cycle degree wave ((IV)) before next round of rally starts.

LMT Daily Elliott Wave Chart


Now looking at Daily Chart, the cycle from 2/16/2018 peak ended the correction against March 2009 low in Super Cycle degree wave (IV) at $241.21 low as double three structure. While dips remain above $241.21 low, the stock is expected to resume the upside in Super Cycle degree wave (V) before completion of wave ((III)) can take place. However, a break above 2/16/2018 peak ( $363) still needed to confirm the next move higher towards $391.06-$437.50 area & avoid double correction lower from the peak.

LMT 4 Hour Elliott Wave Chart


In conclusion, the cycle from all-time lows is showing incomplete impulse structure in Grand Super Cycle degree in longer-term view. Suggesting that the bulls should remain in control looking for more upside either against $241.21 low or against $58.54 March 2009 low. While in short-term price action the stock still needs to clear & see a break above 2/16/2018 peak ($363) peak to confirm the next extension higher.

LMT Elliott Wave Alternative View


Above is the alternative view in Weekly time frame, in which instead of making new highs the stock can fail below 2/16/2018 peak ($363) peak. It may do a double correction lower and end up correcting bigger cycle from November 1999 low in Grand Super Cycle degree wave ((IV)) before resuming higher again.

Keep in mind that the market is dynamic and the view could change in the meantime. Success in trading requires proper risk and money management as well as an understanding of Elliott Wave theory, cycle analysis, and correlation. We have developed a very good trading strategy that defines the entry. Stop loss and take profit levels with high accuracy and allows you to take a risk-free position, shortly after taking it by protecting your wallet.