Elliottwave-Forecast

Master Trader
Feb 17, 2017
2,460
9
84
www.elliottwave-forecast.com
Hello fellow traders. In this technical blog we’re going to take a quick look at the Elliott Wave charts of SPX, published in members area of the website. Back in December 2018 we were calling cycle from the 21st September 2018 peak still unfinshed to the downside. Our Elliott Wave analysis were calling for more weakness toward extreme zone 2478.23-2270.42 ( Blue Box). As our members know, Blue Boxes are no enemy areas , giving us 85% chance to get a bounce. Consequently we expected larger bounce to happen to correct the cycle from the September's peak at least. In further text we're going to explain Ellott Wave Analysis

SPX Daily Elliott Wave Analysis 12.8.2018
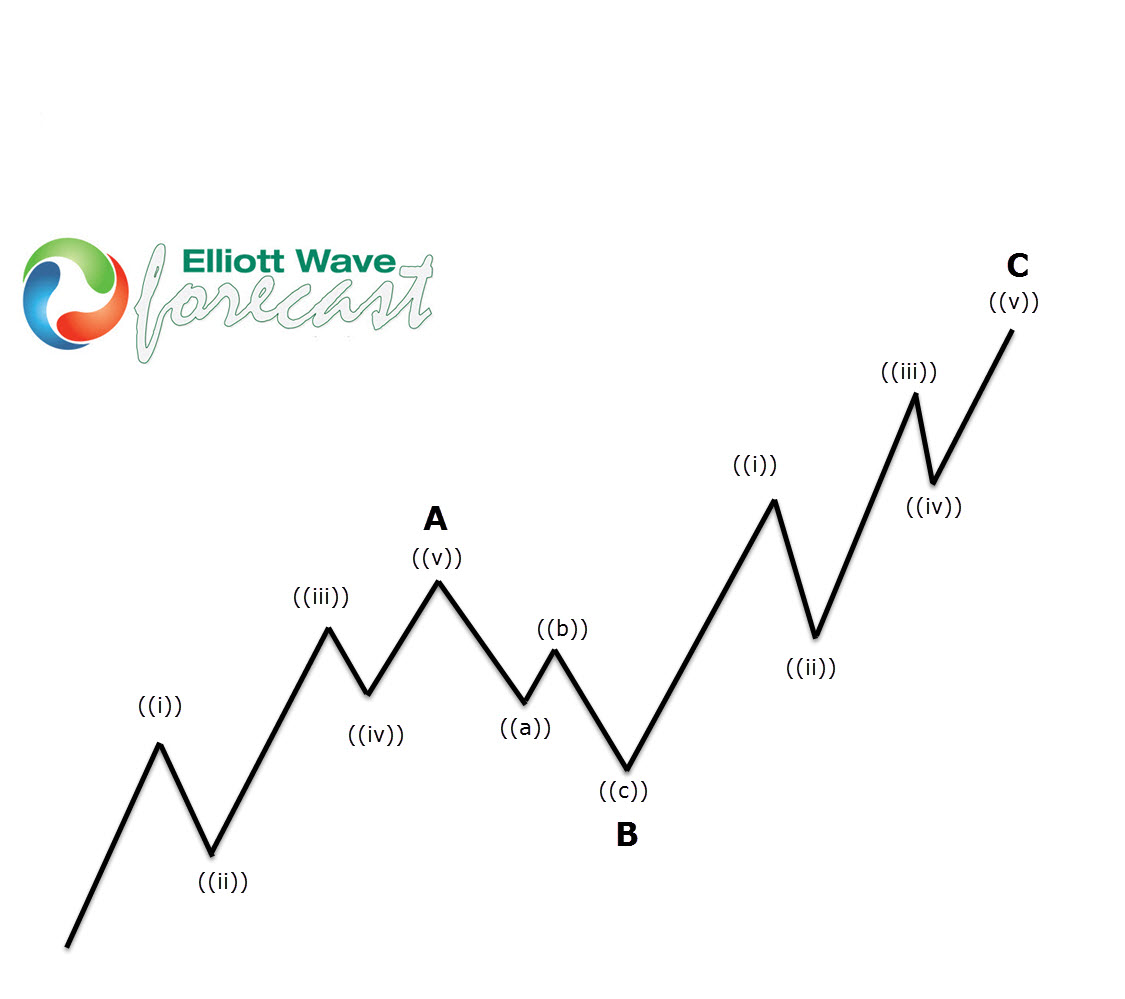
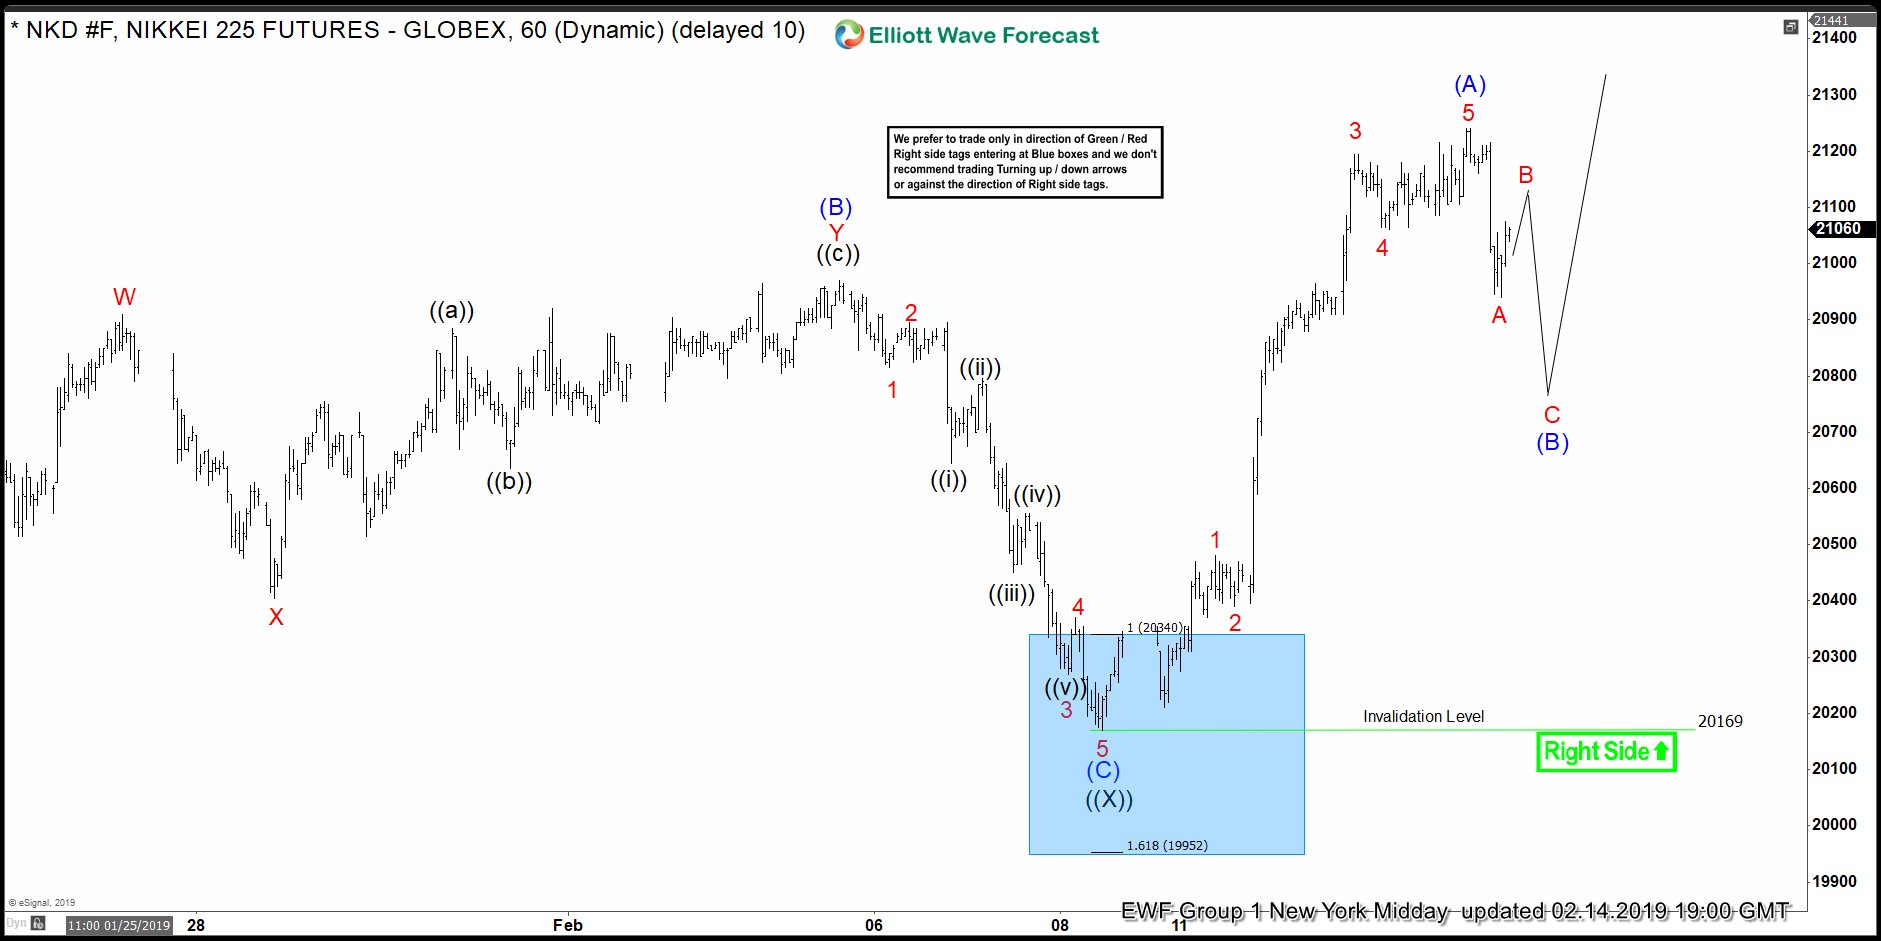
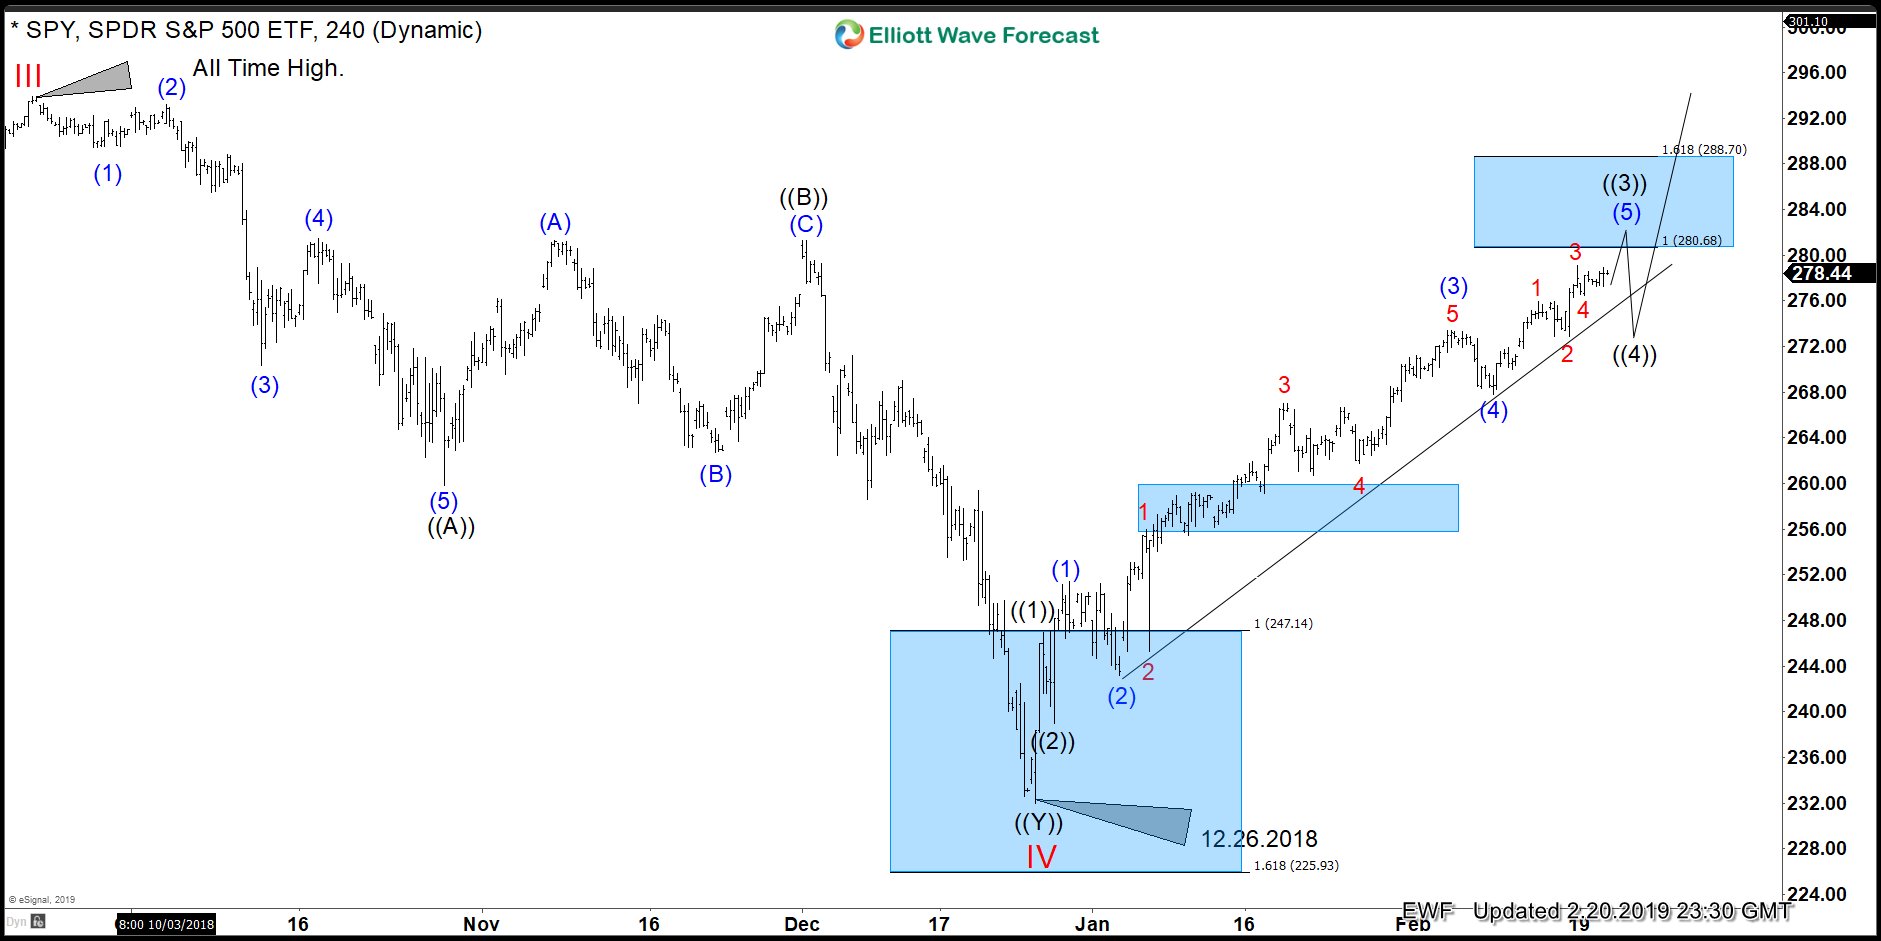
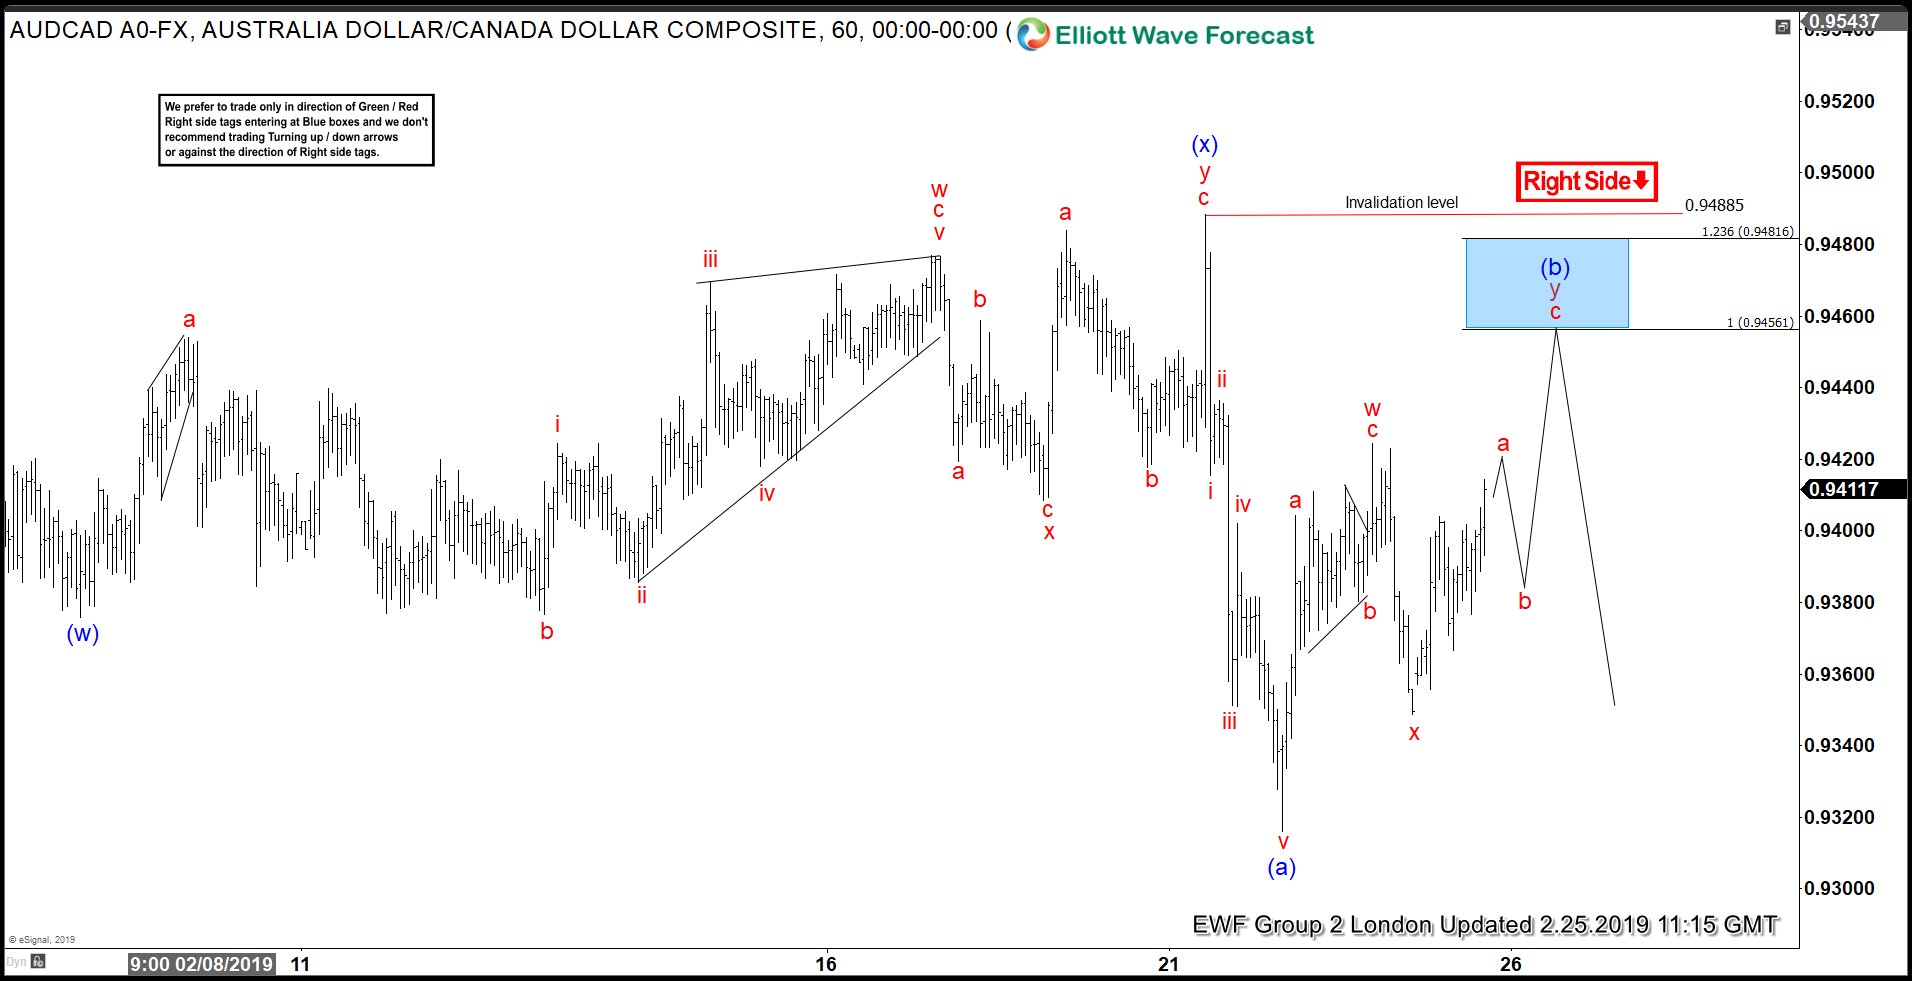
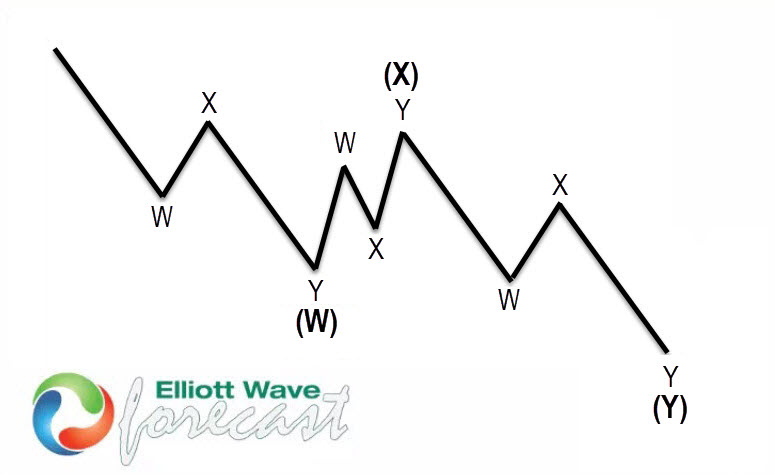
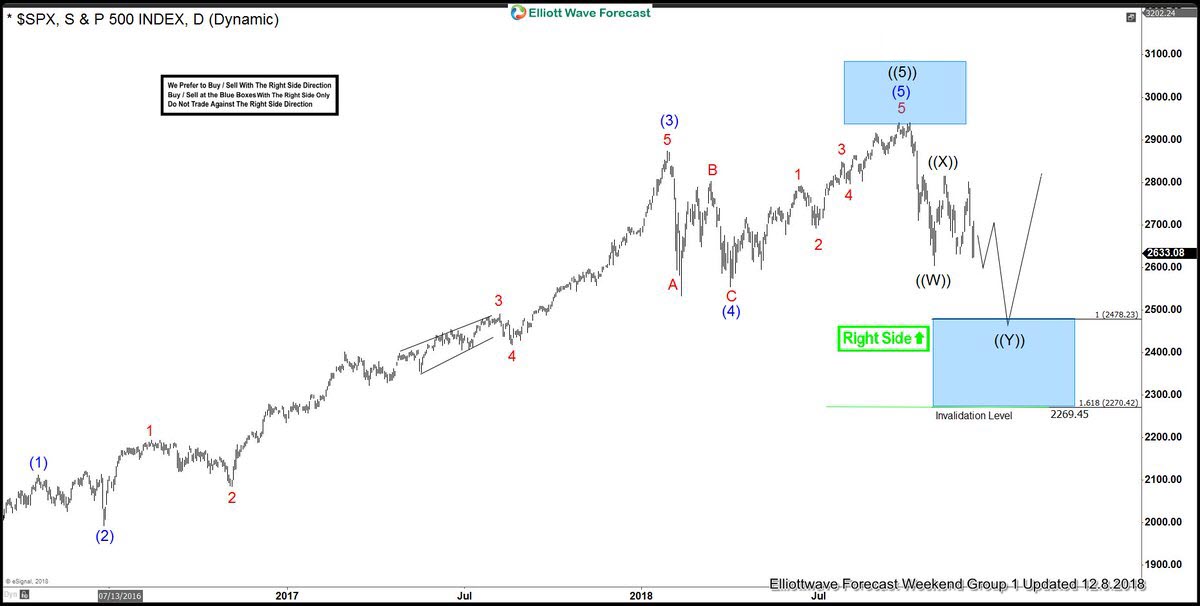
The cycle from the peak has been unfolding as Elliott Wave Double Three Pattern. We're now in third leg down from the September's peak that has scope to reach Blue Box area at 2478.23. As far as pivot at ((X)) high holds, proposed extension down should follow. Once the indexe reaches 2478.23-2270.4 Blue Box area, sellers will be taking profits and buyers should appear for larger 3 wave bounce at least.


SPX Daily Elliott Wave Analysis 1.15.2018
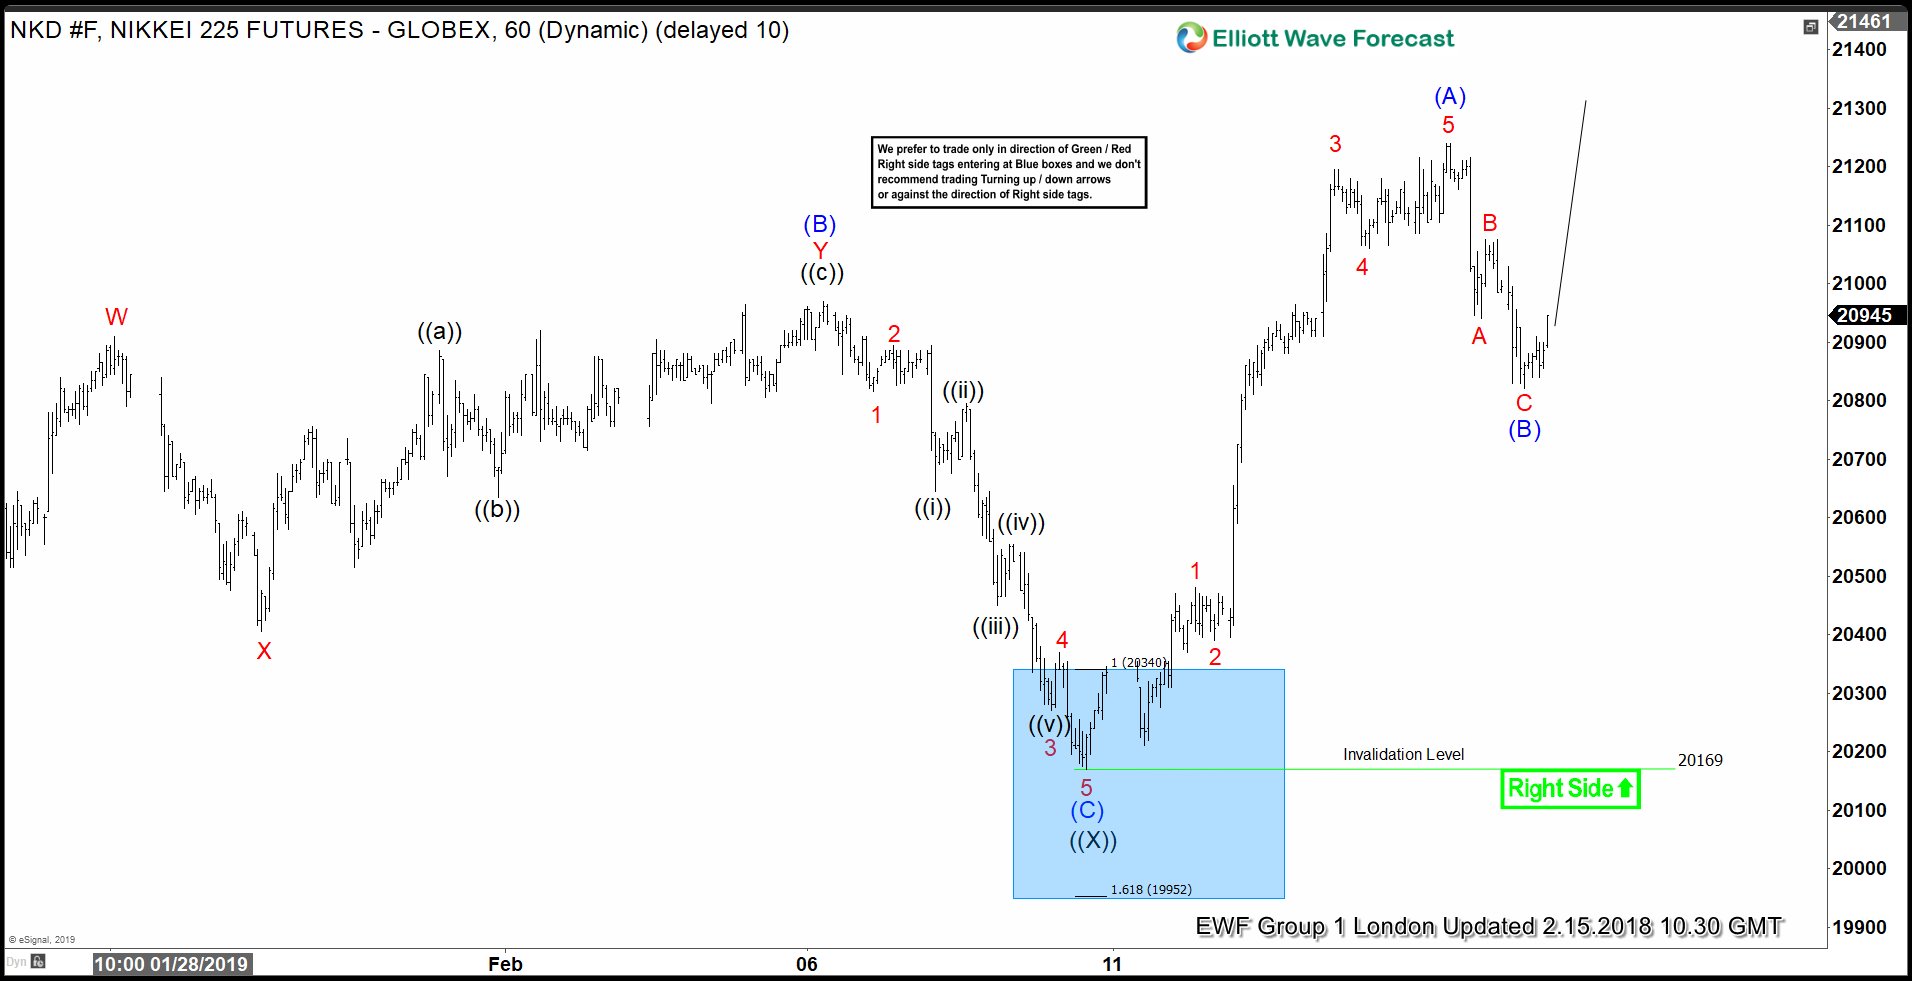
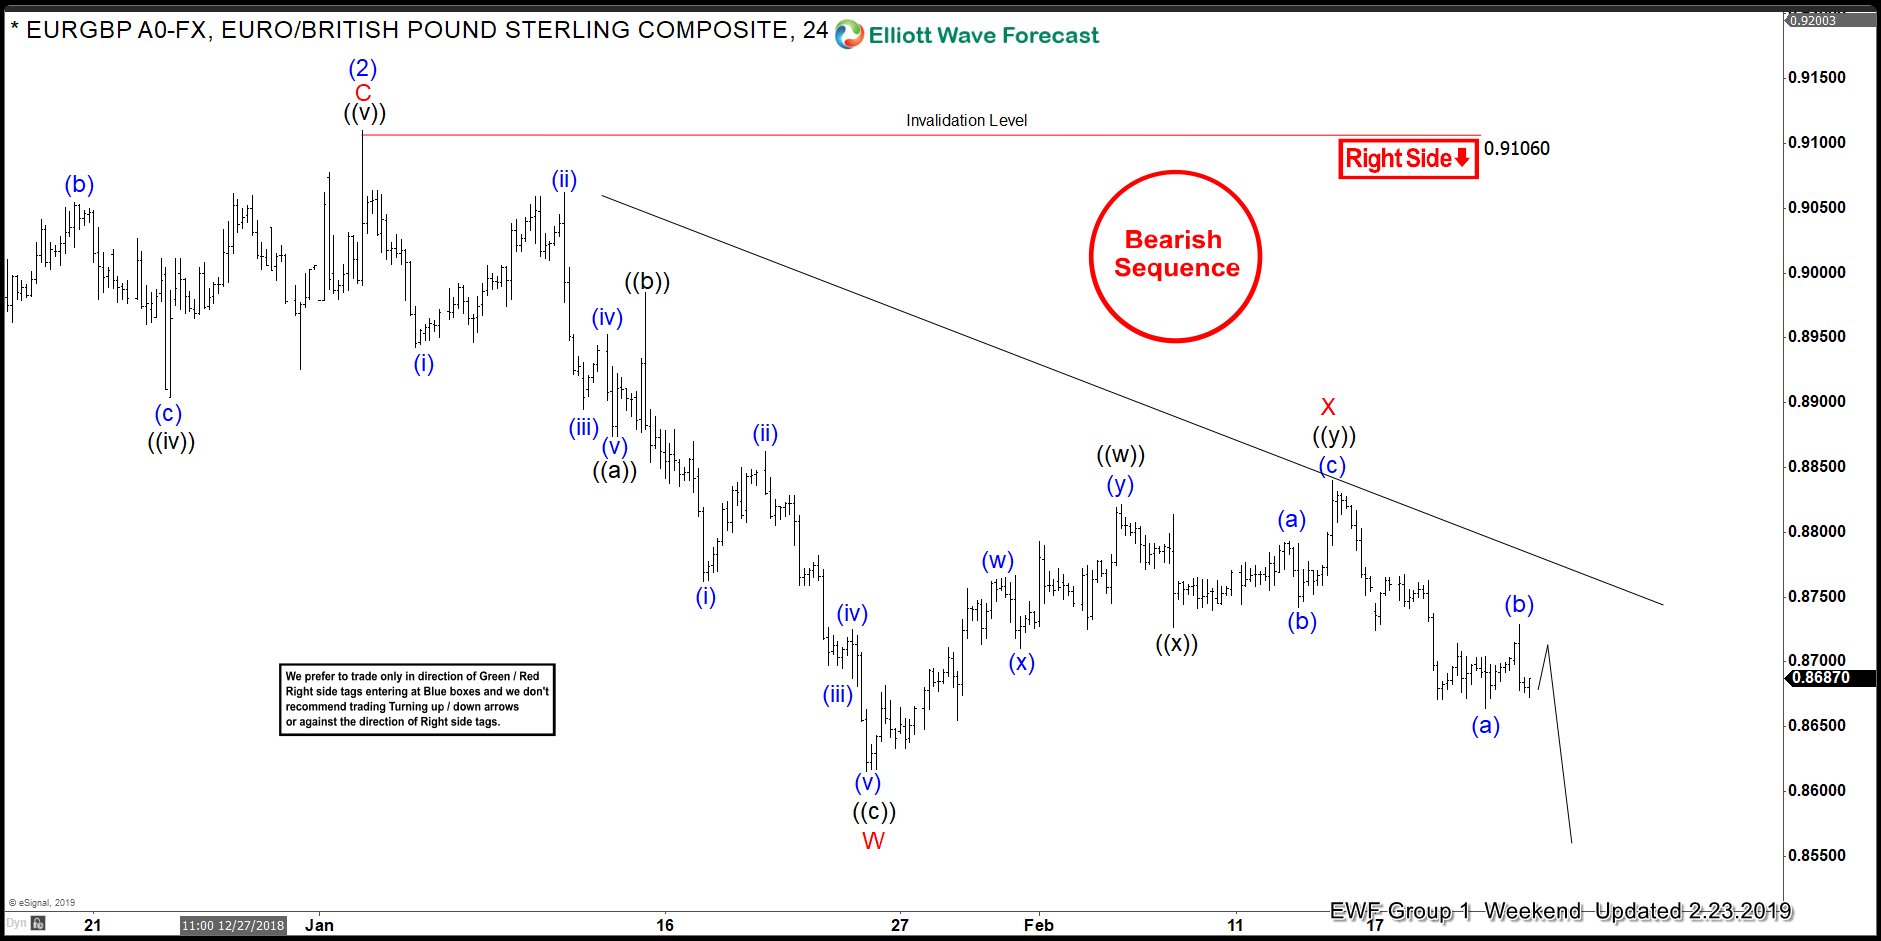
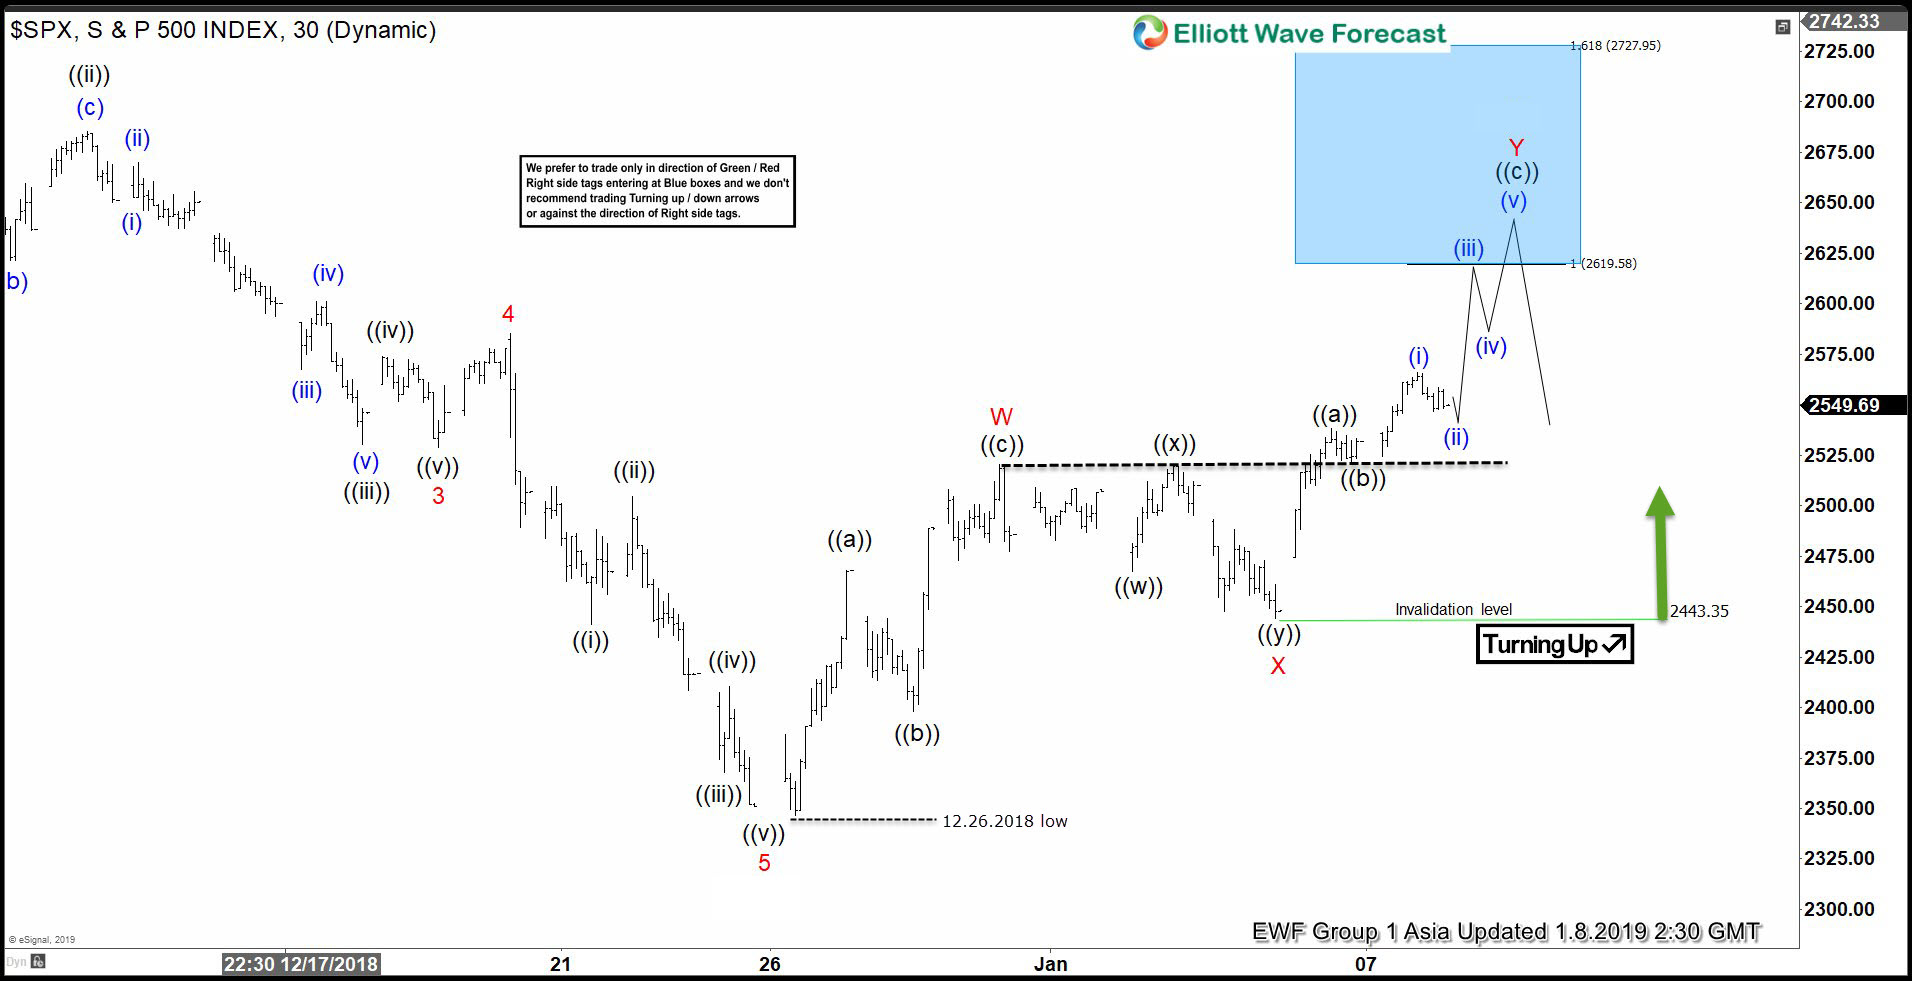
Eventually SPX has reached Blue Box area at 2478.23-2270.4 and found buyers there. Cycle from the September's peak ended at 12.26.2018 low and we're getting rally as expected. Now structure from that low looks incomplete to the upside. The price is showing higher high , suggesting further strength toward blue box area 2619.58-2727.95 as far as pivot at 2443.35 low holds.


SPX Daily Elliott Wave Analysis 1.15.2018
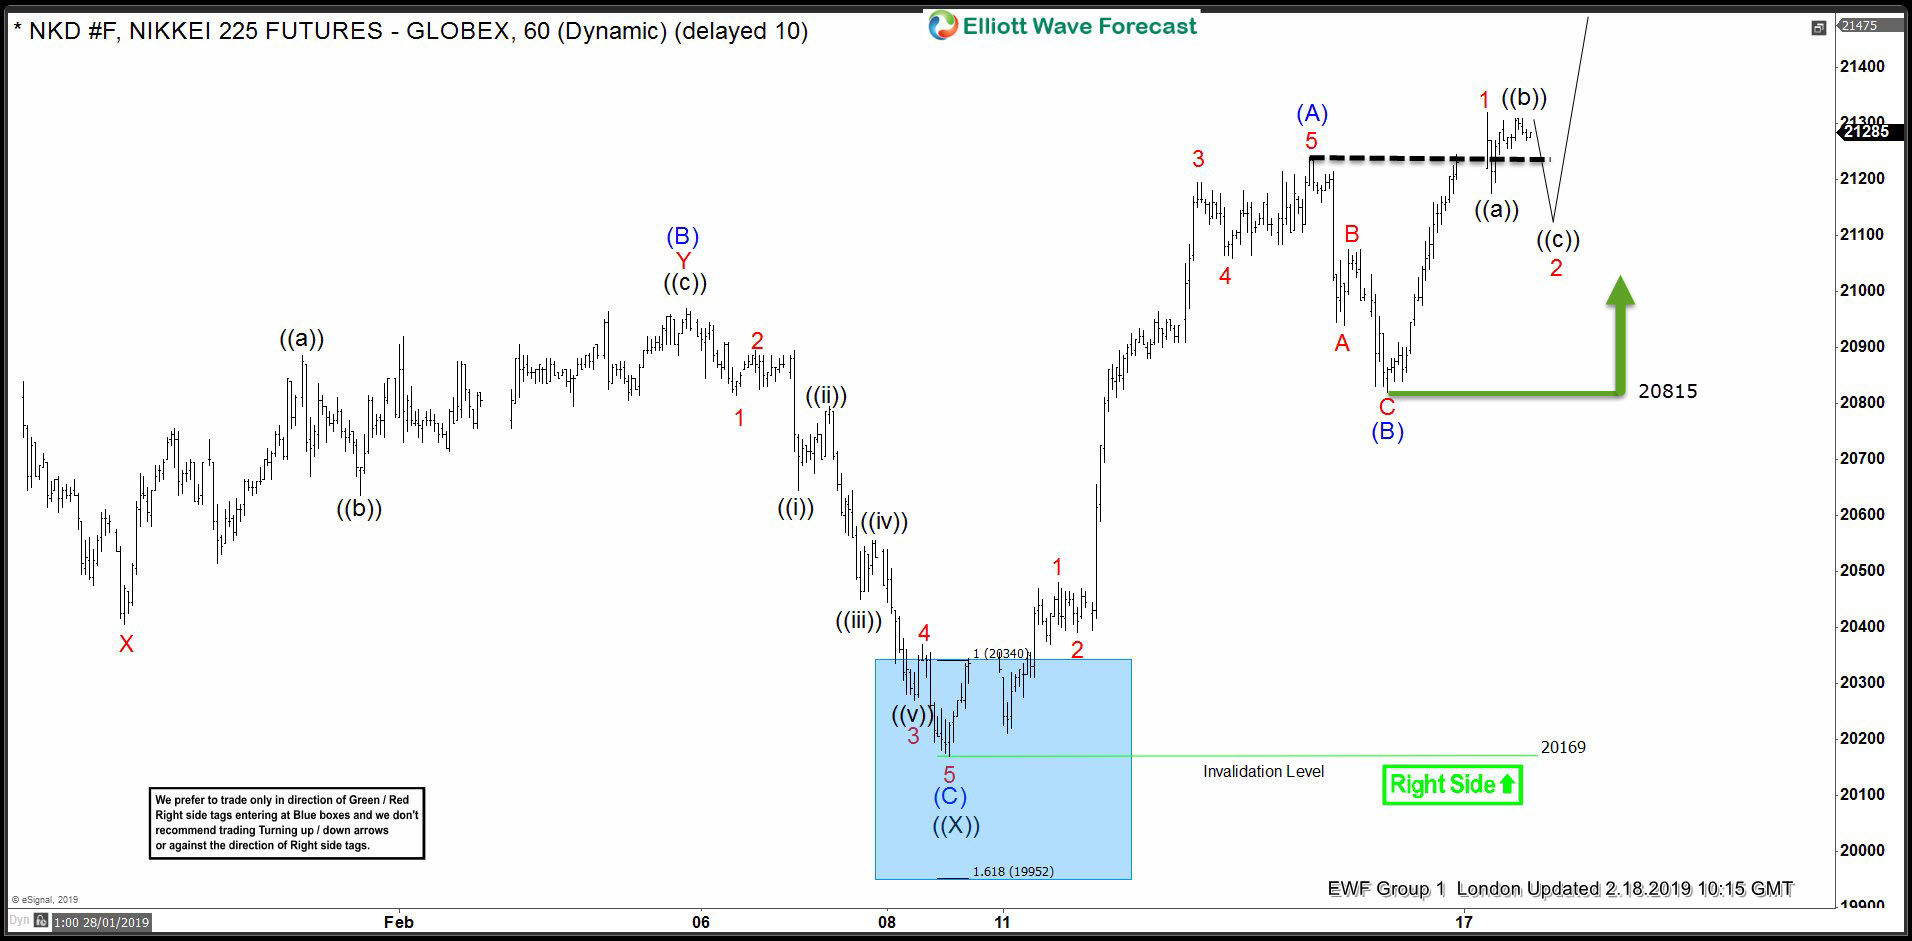
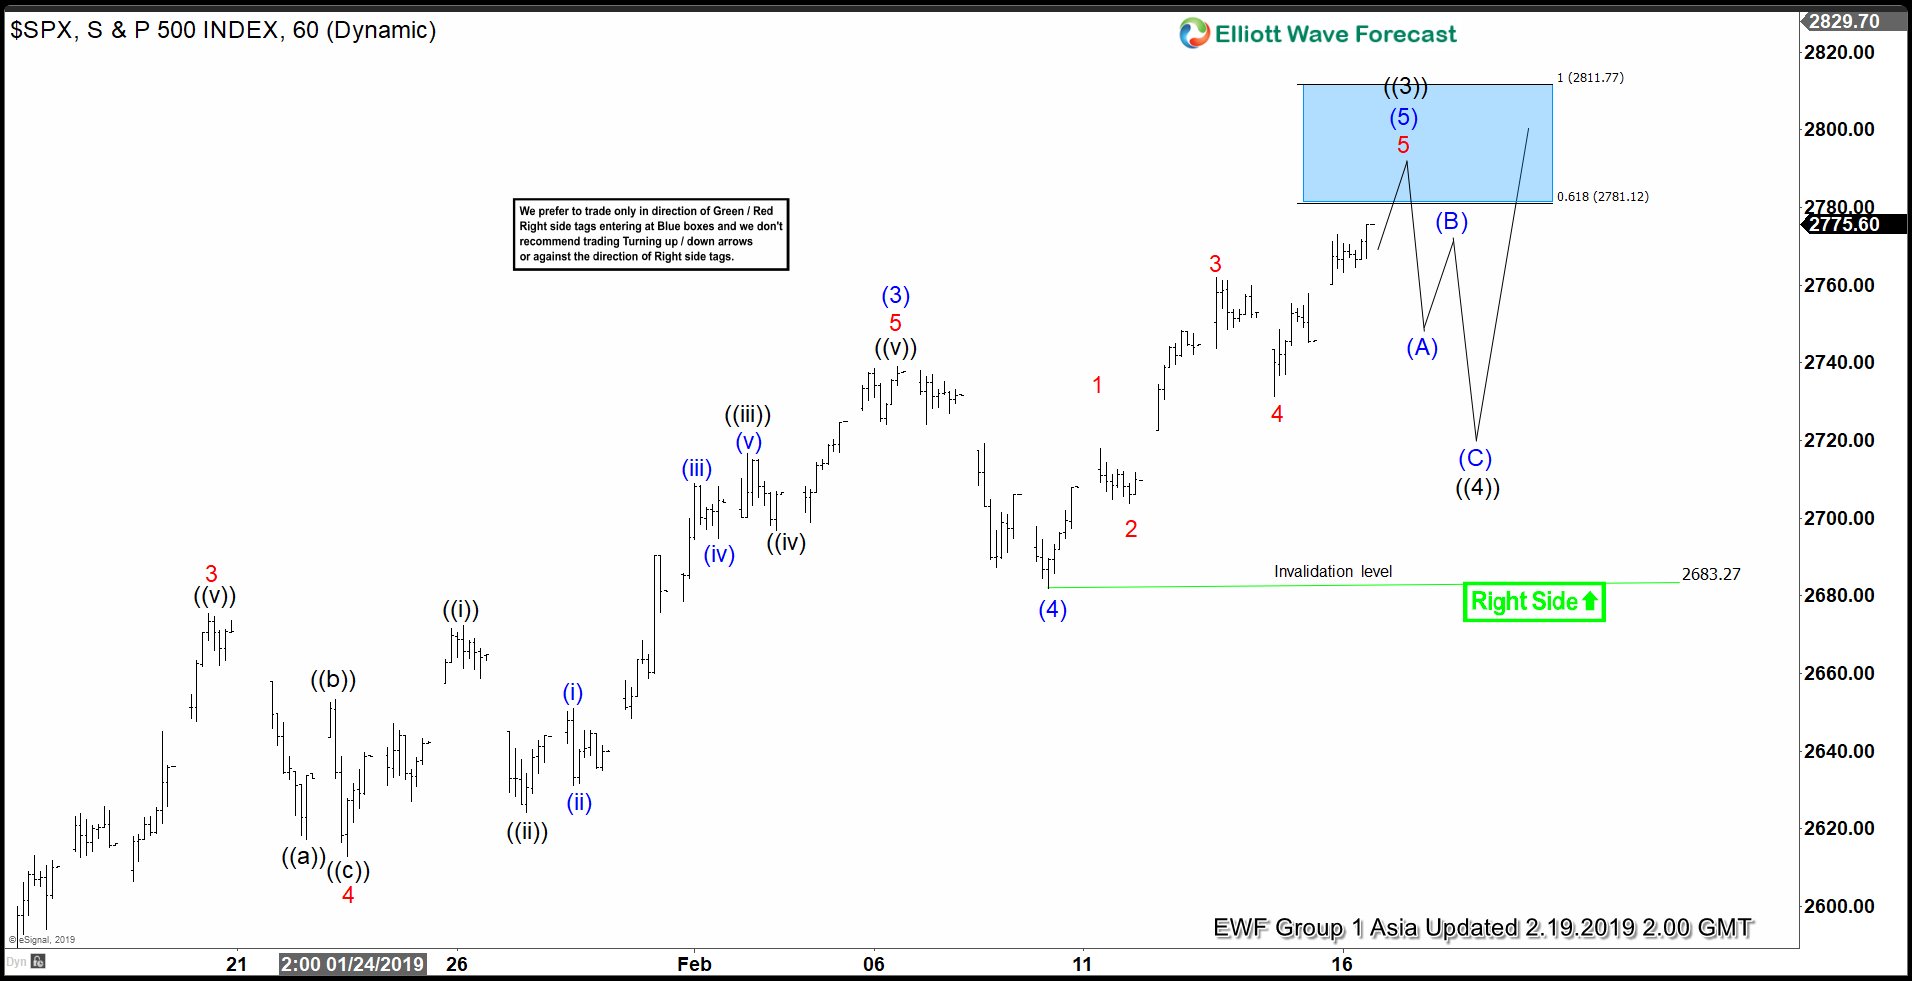
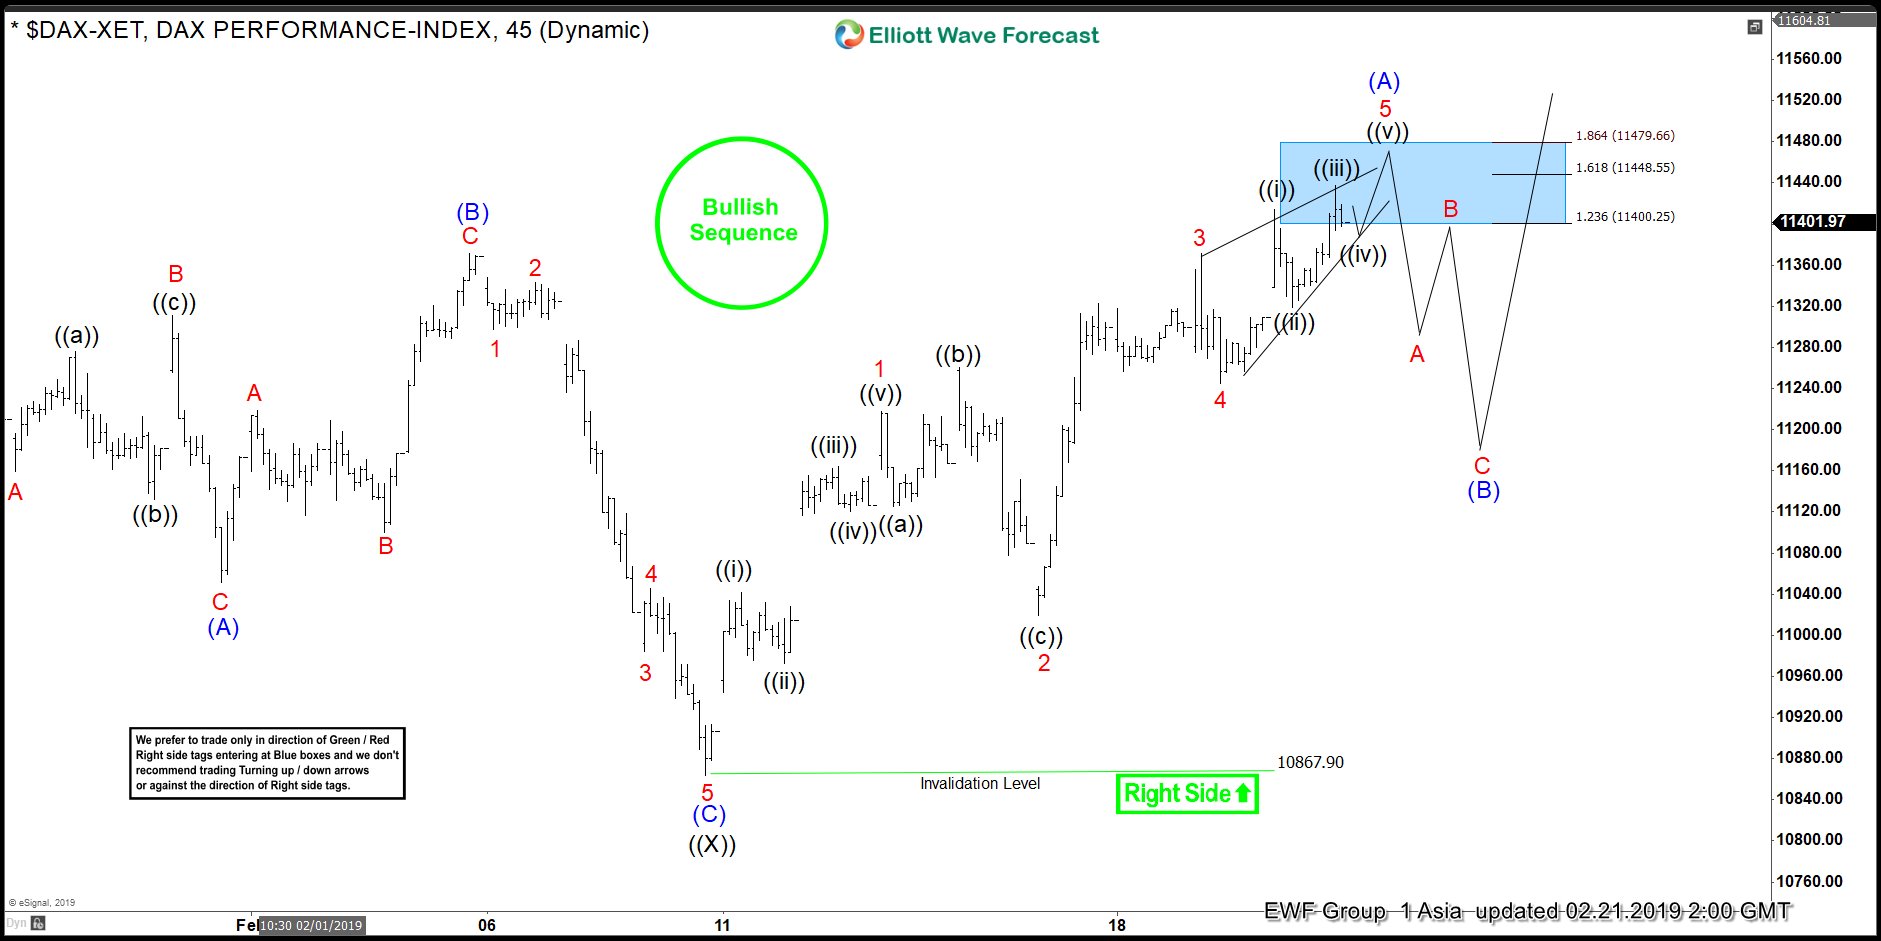
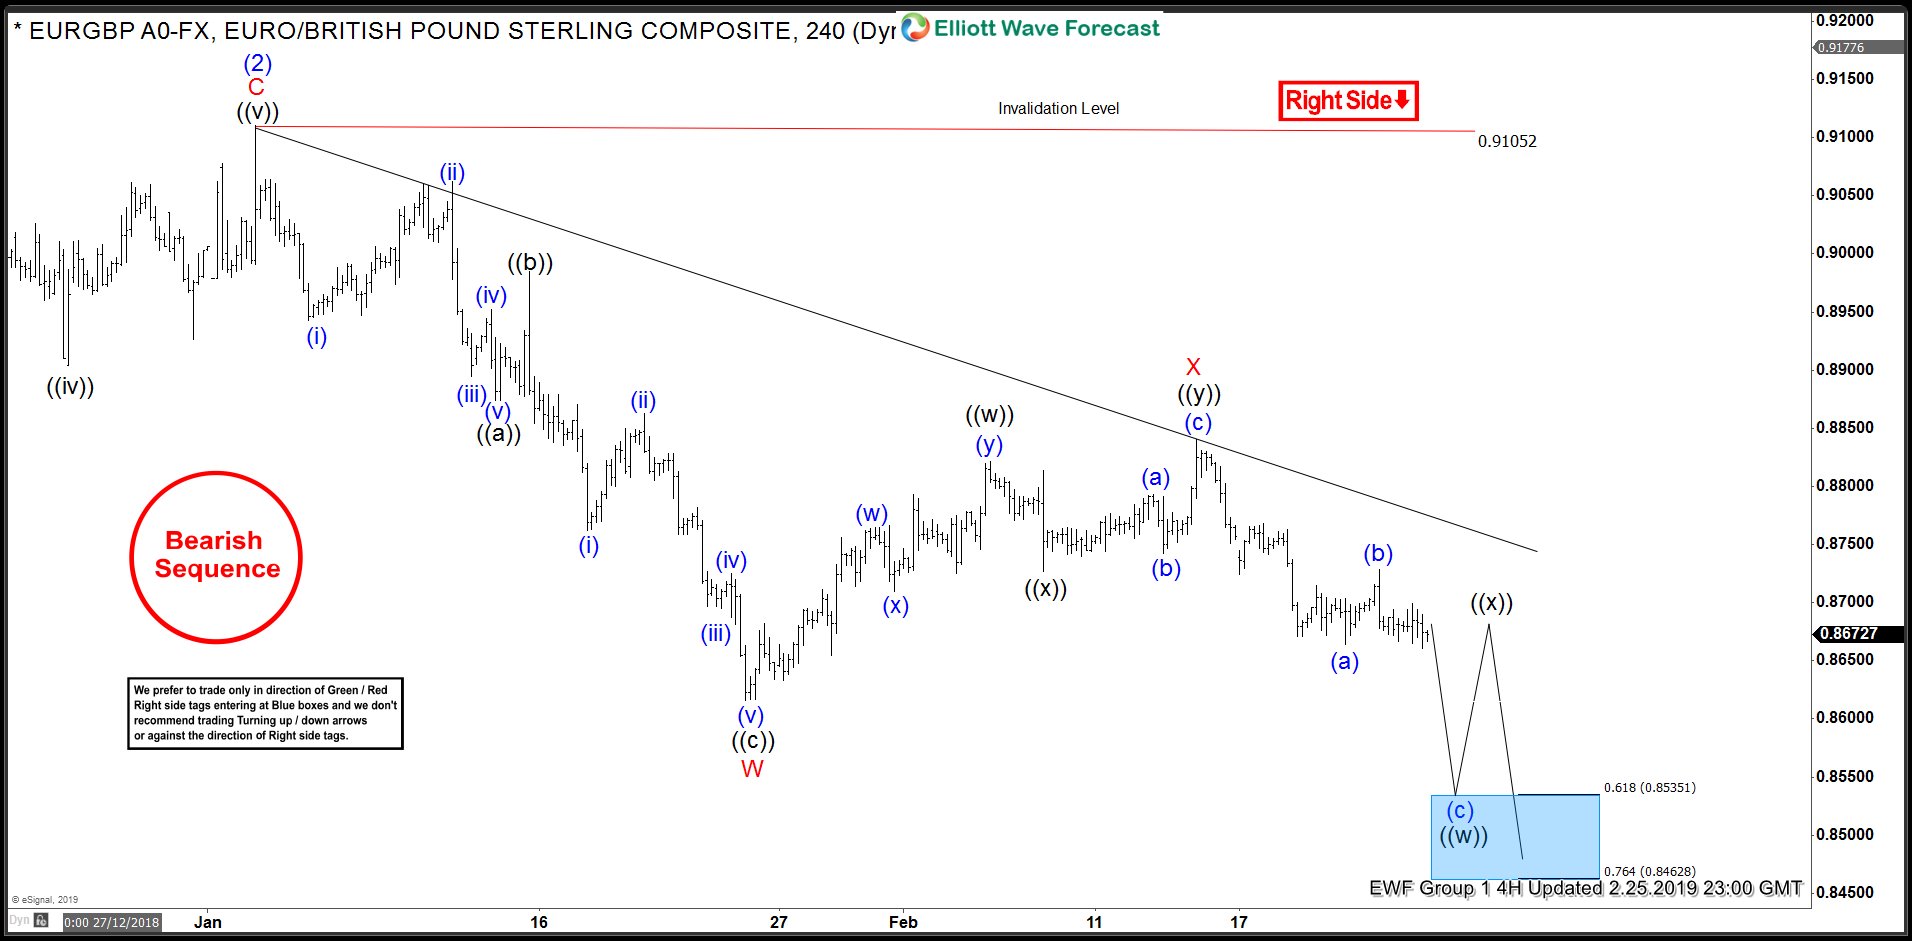
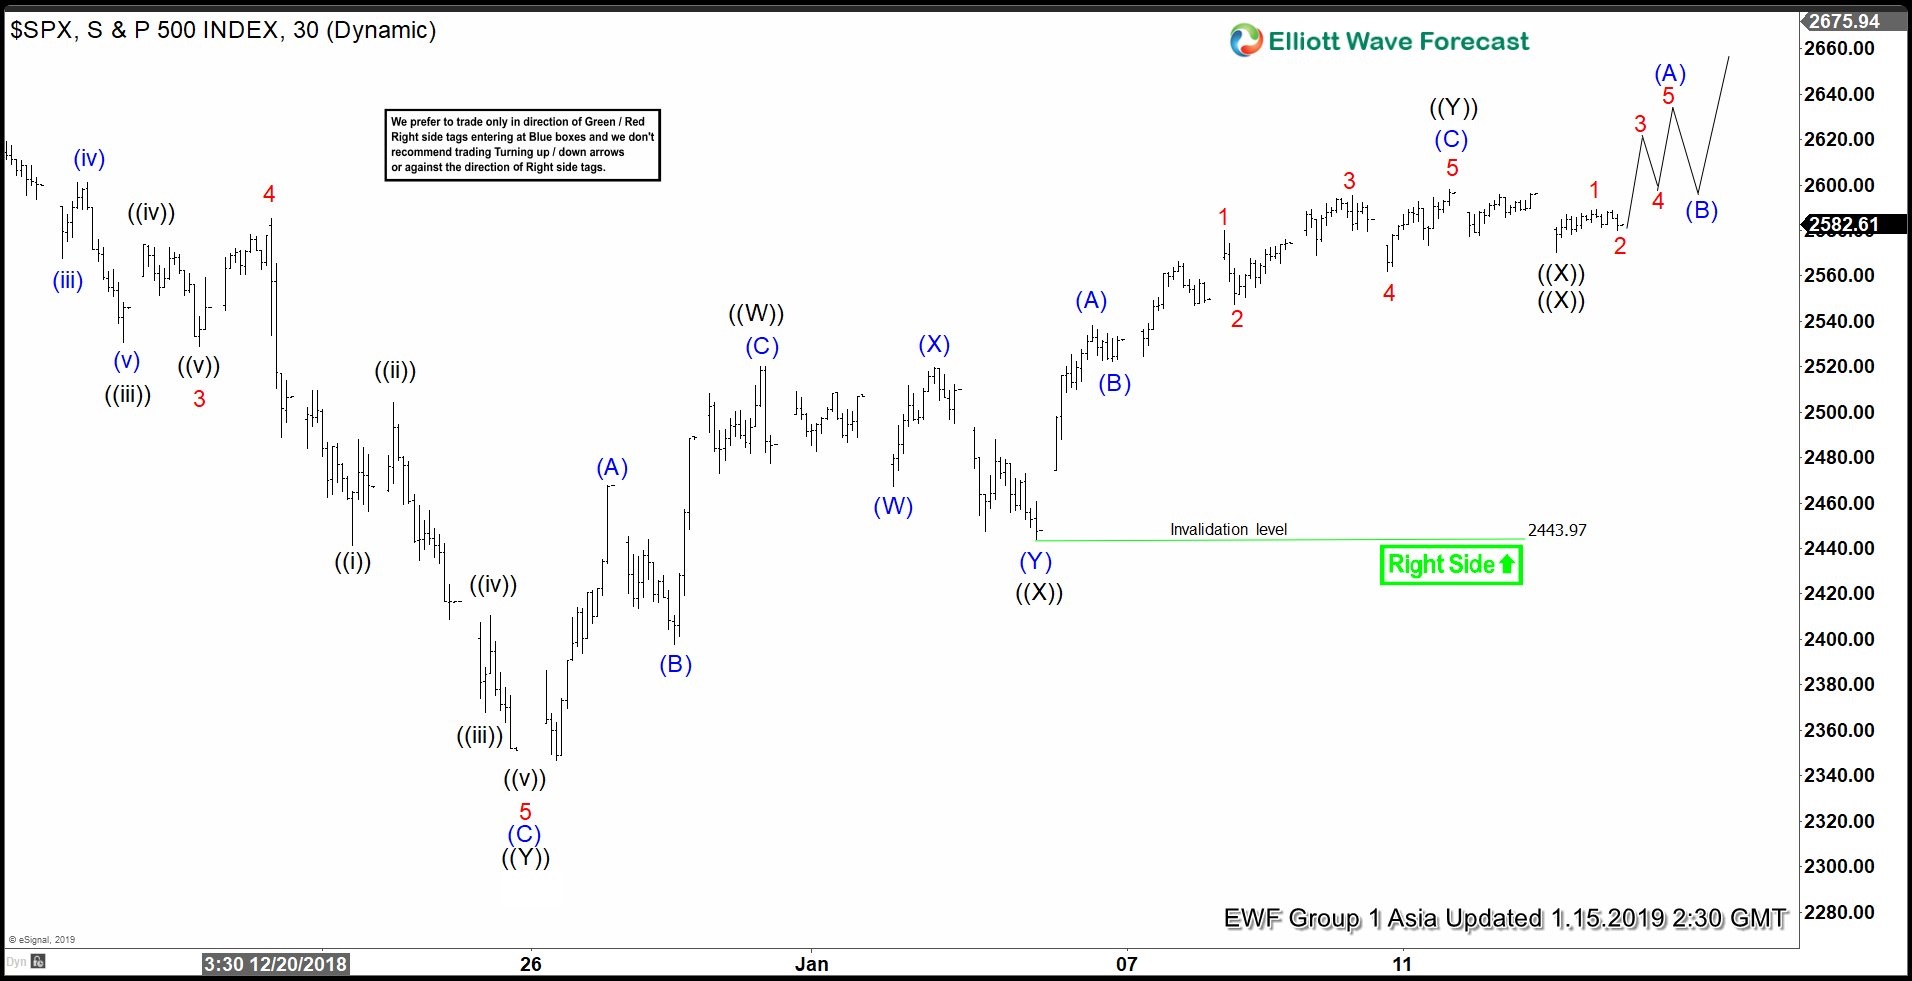
At this stage SPX is reacing blue box from the previous charts, however cycle from the December's low can still remain in progress as Triple Three. We expect more short term strength due to incomplete incomplete bullish sequences in DAX, IBEX and JPY pairs.


Note : Some labelings have been removed from the chart in order to protect. At this stage we see possibility that SPX has ended the cycle from the December's low and SPX is not recommended for buying at the moment. Keep in mind that market is dynamic and presented view could have changed in the mean time. You can check most recent charts in the membership area of the site.
 

Elliottwave-Forecast

Master Trader
Feb 17, 2017
2,460
9
84
www.elliottwave-forecast.com
USDPLN has rallied strongly over the past 2 weeks which resulted in a break of October 2018 peak. In this blog, we will take a look at the mid-term and short-term Elliott wave structure of this Forex pair and what we can expect going forward. We have also overlaid DXY (US Dollar Index) chart with USDPLN for the readers that we would be presenting towards the end of the article.

USDPLN Elliott Wave Analysis - Daily Chart
Chart below shows rally from 1.25.2018 low to August 2018 peak labelled as wave ((A)) was in an Elliott Wave Impulse with an extended wave (3). This was followed by a 3 waves pull back 3.631 which completed wave ((B)). Following this wave ((B)) pull back, pair rallied to a new high in October 2018 but the rally was in 3 waves which left the door open for further sideways consolidation in the form of a triangle or an Elliott Wave FLAT in wave ((B)) with the other possibility that being of an Elliott Wave Diagonal ((C)) wave which sub-divides in 3-3-3-3-3. Following a 3 waves pull back to 3.7063, pair has broken above October 2018 peak which supports the idea of ((C)) wave diagonal.

Now there are two ways in which this ((C)) wave diagonal could unfold. Near-term (as we will show in the 1 hour chart below) dips are expected to hold above 3.7063 low for extension higher toward 3.9257 - 4.0630 area which is 100 - 161.8 Fibonacci extension of the initial 3 waves rally from September 2018 low to October 2018 peak. Depending on how high we go within the blue box, we should end wave (3) of ((C)) or just wave (1) of ((C)) but in either case, we should be expecting more upside as far as prices stay above 3.7063 and more importantly above 3.631.


USDPLN Impulsive Elliott Wave Rally from 1/31 low
Chart below is a 1 Hour chart of USDPLN Forex pair and we can see a clear Elliott Wave Impulse with an extended wave ((iii)) and wave (iii) of ((iii)) was also extended. Pivot at black wave ((iv)) low has given up which supports the view that Impulsive rally in the form of wave A has completed at 3.8594 and a pull back in wave B should now be in progress. As pair has got 5 swings up from 3.631 low (see daily chart above), wave B pull back is expected to see buyers and then pair should turn higher as far as dips hold above 3.7063 low.


USDPLN and DXY Overlay
Chart below is an overlay of US Dollar Index with USDPLN and we can see both made a low in January 2018 and then a secondary low in September 2018. USDPLN has already broken above August and October peaks and appears to be leading the rally in US Dollar Index.


Elliottwave-Forecast

Master Trader
Feb 17, 2017
2,460
9
84
www.elliottwave-forecast.com
USDCAD BUY/LONG Trade Setup: USDCAD is forming a bullish inverted Head and Shoulders market breakout pattern. Price has already broke above the neck line which can be a signal that possibly more bulls will be entering LONGS and will start pushing the pair higher. Traders should watch for a good strong break above the green BUY breakout trend line. A good break above this level can send USDCAD higher and possibly extend to newer highs above the December 2018 high. If looking to BUY USDCAD look to buy on a good break above the green BUY entry trend line with Stop Loss at the low of the right shoulder and watching for price to hit the target levels as shown in the chart below. As long as the low of the right shoulder holds then a rally higher can be strongly possible. A break above the January 24/2019 high will confirm bulls are in control. Only time will tell what the pair will do but as for now I remain bullish until otherwise. Trade what you see and squeeze the trigger if and when you see USDCAD start to move higher. Trade safe.

USDCAD 4 Hour Chart 2.14.2019


Of course, like any strategy/technique, there will be times when the strategy/technique fails so proper money/risk management should always be used on every trade. Hope you enjoyed this article.
 

Elliottwave-Forecast

Master Trader
Feb 17, 2017
2,460
9
84
www.elliottwave-forecast.com
Hello fellow traders. In this technical blog we’re going to take a quick look at the Elliott Wave charts of NIKKEI . Break of February 5th peak has made the cycle from the 12.26 low incomplete to the upside. The price structure is calling for more strength toward 22214-23476 area. At this stage short term cycle from the 02/08 low is also showing incomplete sequences. We believe that February cycle can be unfolding as Elliott Wave Zigzag structure, when now doing 3rd leg up (C) of Zigzag. In the following article, we’re going to explain the Elliott wave Pattern and Forecast.

Before we take a look at the real market example, let’s explain Elliott Wave Zigzag pattern.

Elliott Wave Zigzag is the most popular corrective pattern in Elliott Wave theory . It’s made of 3 swings which have 5-3-5 inner structure. Inner swings are labelled as A,B,C where A =5 waves, B=3 waves and C=5 waves. That means A and C can be either impulsive waves or diagonals. (Leading Diagonal in case of wave A or Ending in case of wave C) . Waves A and C must meet all conditions of being 5 wave structure, such as: having RSI divergency between wave subdivisions, ideal Fibonacci extensions and ideal retracements.

At the graphic below, we can see what Elliott Wave Zigzag structure looks like. 5 waves up in A, 3 wave pull back in B and another 5 waves up in C.


Now, lets’ take a look what Elliott Wave Zigzag looks like in the real market.

NIKKEI 1 Hour Elliott Wave Analysis 02.14.2019
Short term cycle from the 20169 (02/08 ) low ended as 5 waves structure. It's labelled as wave (A) blue. We believe wave (B) pull back is correcting cycle from the 02/08 low, unfolding as another ABC Zigzag. We got 5 waves from the peak, and current bounce can be only wave B of (B). Another leg down C red is expected to complete proposed pull back. Once (B) pull back completes we should ideally get more strength in wave (C) red due to incomplete bullish sequences we have in the December's cycle.


NIKKEI 1 Hour Elliott Wave Analysis 02.18.2019
Eventually we got another short term leg down, and wave (B) pull back can be done with ABC red inner structure. As far as the price stays above last short term low, next leg up (C) blue can be already in progress. At this stage we need to see further separation from the current low and more importantly would like to see break above wave (A) blue high. That would confirmed next leg up is in progress.


NIKKEI 1 Hour Elliott Wave Analysis 02.18.2019
Recently we got new short term high. Break above the 02/14 peak- (A) blue confirmed next leg up is in progress. Now as far as the price stays above last short term low 20815, we expect to see more strength in (C) leg up. Proposed leg up should also have 5 waves structure.
Alternatively, if 20815 pivot gives up, we can get more complex structure in (B) blue pull back. In that case (B) pull back would be unfolding as Elliott Wave Flat Pattern.

Keep in mind that market is dynamic and presented view could have changed in the mean time. Best instruments to trade are those having incomplete bullish or bearish swings sequences. We put them in Sequence Report and best among them are shown in the Live Trading Room.


Elliottwave-Forecast

Master Trader
Feb 17, 2017
2,460
9
84
www.elliottwave-forecast.com
The S&P 500 ($SPX) had the worst December in history as the market got nervous. Many started to guess the possible reasons and came up with many different arguments. There were several reasons like the trade wars with China and the political environment in the US, among others. One particular reason about President Trump got the most attention. The president started to lash out again at the FED because of their decision to raise interest rates probably because President Trump believes that raising interest rates would cause Stock Markets to drop which won't be good for his term. The chairman of FED is appointed by the President, but the FED is designed to operate without a political bias. Many headlines crossed the wires like “ Trump lashes out at Fed — again: 'They're raising interest rates too fast", " Did the Fed just cave to Trump?" when they raised rate in December.

The Fed can be right if they look at the $SPX Grand Super Cycle Blue Box. Raising Interest rates will be a way to defend themselves against a sell off in case we need cheap money again. The Blue Box in the $SPX together with the $ZN#F Blue Box from the cycle since 2012 high will create a concern that any technical trader can see. We did a blog back in 2017 forecasting both to reach into a Blue Box and a possible large correction across the Market by 2020.

The blog we did in 2017 explained the relationship between the instruments and how it can affect the World Indices and the market in general. We always believe the market is purely technical and reaching these big areas are a HUGE warning. We also believe market makers trade by looking into these areas. Our daily forecasts prove it everyday. The $SPX and $ZN_F (10 Years) are important parts of the market of course. We think the FED is raising rates too fast because of this. However, we will side with President Trump because we believe Market sequence still favours more upside in Stock Markets regardless of what FED does.

Secondly, we look at a series of instruments from around the world. We see how the YEN has been strong since 2015. The Yen is soon expected to see a huge important low. There is not much of a way to see that the downside will win. Indices will have no other way than to extend higher and follow the sequences of the $UKX-FTSE in the Grand Super cycle and extend. The market needs to be seen as a whole in reality. As humans we have instincts. In this case President Trump does not have either the fundamental or technical knowledge that the FED has. However his instincts are right.

Here is the $SPX Grand Super cycle Blue Box that is showing an ABC from all time low. It will need to extend because YEN strength soon can be over and $FTSE Grand Super cycle sequences is also favouring the extension higher.

$SPX Grand Super Cycle
SPX-WEEKLY-The-big-long20190212154035.jpg


Here is the $AUDJPY bearish Weekly cycle that soon price will reach. A Blue Box in 2 degrees which will create a lot of Yen weakness and consequently higher Indices. It is a downward channel and a double three correction.

$AUDJPY Bearish Weekly Cycle since 2013 peak
AUDJPY-Weekly.png


Here is the $UKX-FTSE Grand Super cycle sequences that supports the Indices higher which means President Trump will end up winning regardless of what policy FED adopts as that's what this Grand Super cycle bullish sequence in $UKX-FTSE is suggesting.

$UKX-FTSE Grand Super Cycle Favours Trump and not the FED
UKX-FTSE-sequences-time-and-price20190212153655.jpg


$ZN_F (10 years) have reached the extreme Blue Box since the peak in 2012
ZN-and-SPX20190212161144.jpg

In conclusion. When we look at everything, we believe the indices will be involved in much volatility. This should last for the next few months. At the end another cycle like 2009 will happen and President Trump will be end up being right at the end regardless of what FED does.
 

Elliottwave-Forecast

Master Trader
Feb 17, 2017
2,460
9
84
www.elliottwave-forecast.com
Since bottoming at 2346.58 on December 26, 2018, S&P 500 (SPX) has rallied 18% in less than 2 months. The structure of the rally appears like an Impulse Elliott Wave structure. An Impulse structure is a 5 waves move. The Index is now within wave ((3)) of the possible 5 waves move from December 26 low. Subdivision of wave ((3)) unfolded as another 5 waves of lower degree where wave (3) ended at 2738.98 and wave (4) ended at 2681.83.

Wave (5) of ((3)) is currently in progress towards a potential target of 2781.12 - 2811.77 (blue box). The Index should then pullback in wave ((4)) to correct wave ((3)) rally from December 28, 2018 low (2397.94). The pullback should later unfold and find buyers in the sequence of 3, 7, or 11 swing. In Elliott Wave Theory, wave 4 typically correct wave 3 at 23.6 - 38.2 Fibonacci retracement. We need to wait for wave ((3)) to complete before we can project a more accurate retracement area. If we assume wave ((3)) ends at 2781 (the blue box), then potential area for the Index to end the wave ((4)) correction is approximately 2635 - 2691.

Once the Index ends the correction, it still has a chance to extend higher 1 more leg in wave ((5)). Alternate view suggests that the Index ends wave ((5)) already in the current rally instead of wave ((3)). In the alternate view, Index should correct the entire rally from December 26, 2018 low in the next pullback.

S&P 500 (SPX) 1 Hour Elliott Wave Chart
 

Elliottwave-Forecast

Master Trader
Feb 17, 2017
2,460
9
84
www.elliottwave-forecast.com
The EOS token is the cryptocurrency of the EOS network which is using the blockchain technology architecture to enable vertical and horizontal scaling of decentralized applications.

2018 was the worst year for cryptocurrency investors as the market saw a significant price drop but despite that, ESO coin managed to make new all time highs during that period and reached a price of $23.

We'll take a look at the technical chart of the token using Elliott wave Theory to understand the structure:

EOS Daily Chart 02.09.2019


EOS first rally from July 2017 was in 3 waves higher which found sellers around blue box area $22 - $26. Down from there, the price declined in a corrective triple three structure before finally finding a low around the 100% Fibonacci extension area $2.8.

The nature of the bounce at this stage isn't yet defining the new cycle as it's only showing 3 swings from the low but it managed to end the decline from April 2018 peak. Therefore, EOS at this stage is either starting a new cycle to the upside or looking to correct the previous decline at least toward $9 - $14 area.

The cryptocurrency market witnessed it's longest bear market and there is no clear signal that it ended. However with the recovery in EOS and with further data later on, the situation could switch if the major coins like Bitcoin and Ethereum show a similar bounce.
 

Elliottwave-Forecast

Master Trader
Feb 17, 2017
2,460
9
84
www.elliottwave-forecast.com
We have highlighted the possibility that Gold can quickly retest the high in 2018. The chart below shows the yellow metal has broken above a long term bearish channel from Sept 5, 2011 high. In addition, it has successfully closed above the ascending trend support from December 3, 2015 low.


We mention that the next logical swing target for the yellow metal is to retest 2018 high at $1360 area. This level has provided resistance for the past 5 years and thus is a significant level to watch. A decisive break and close above $1360 suggests a more bullish implication with next swing target to as high as $1700. The chart below shows the 5 year rounding bottom formation in Gold


An Elliott Wave analysis of Gold against World Currency Unit (WOCU), a weighted basket of 20 fiat currency pairs covering top 20 world economies, also suggests a breakout


In the chart above, a break above 7.6.2016 high will create 5 swing bullish sequence from 12.30.2013 low and opens up more upside to $1021 - $1160 area.

Gold 1 Hour Elliott Wave Chart


In this article, we will look at the short term 1 hour chart for Gold. The rally from Aug 16, 2018 low is still in progress as an Elliott Wave Impulse structure. We propose the current rally is still within wave (3) from Aug 16, 2018 low as momentum remains strong. Focusing on the shorter cycle, the rally from 1/21/2019 low ($1276.40) is unfolding in 5 waves of lesser degree. Wave ((i)) ended at $1326.30 and wave ((ii)) ended at $1302.16. Wave ((iii)) remains in progress and while short term pullback stays above $1302.11, expect Gold still to extend higher. Caution is warranted once Gold does retest $1360 as this level provides resistance in the past 5 years. We expect the 5 waves up from Aug 16, 2018 low to end between $1360 - $1400.
 

Elliottwave-Forecast

Master Trader
Feb 17, 2017
2,460
9
84
www.elliottwave-forecast.com
The ETF is rallying from the blue box after forming the low on 12.26.2018, Blue box is an area where buyers and sellers agree in the next direction. We have developed a system in which we present the boxes to members on our charts and combine it with the right side to enter the market. The decline in $SPY from all-time high is in a classic ABC which is a set of 2 cycles. Each cycle has a subdivision of 5 waves and it's commonly called zigzag Elliott Wave structure.

After ending the zigzag, the ETF has reacted higher in what looks like an impulse. The Elliott Wave Theory describes an Impulse as a sequence of 5-3-5-3-5. The Impulse main rules are :

  • Wave 1, 3, and 5 subdivision are impulse. The subdivision in this case is ((i)), ((ii)), ((iii)), ((iv)), and ((v)) in minute degree.
  • Wave 2 can’t retrace more than the beginning of wave 1
  • The shortest wave of the three impulse waves, namely wave 1, 3, and 5, can not be wave 3
  • Wave 4 does not overlap with the price territory of wave 1
  • Wave 5 needs to end with momentum divergence
Looking at the following chart since the lows on 12.26.2019, most of the rules are in place. There is no overlap between wave (1) and (4), and we can also see extension in the move. We believe the Index is doing a wave ((3)) extension and it has a triple nest since the lows last year.


The Blue box at the top is the area we believe wave ((3)) will be ending. It is also where wave (5) is equal in length to wave (1) in Blue. The RSI (Relative Strength Index) is showing a momentum divergence and it is a signal that a reset needs to happen. We believe wave ((4)) pullback will be another buying opportunity because the correction in Indices like $DAX will need more upside.
 

Elliottwave-Forecast

Master Trader
Feb 17, 2017
2,460
9
84
www.elliottwave-forecast.com
Today, I want to share with you some Elliott Wave charts of the Bank of America stock ( BAC ), which we presented to our members at Elliott Wave Forecast. You see the 1-hour updated chart presented to our clients on the 02/13/19 below.

BAC ended the cycle from 01/25/19 peak at the low of 02/08/19 in red wave W. The internal structure of red wave W unfolded as an Elliott Wave ZigZag structure (5-3-5). The decline ended black wave ((a)) at 27.99 low. The stock then bounced in black wave ((b)) and ended at 29.02 high. Below from there it reached 27.92-27.67 areas which was the 0.618-0.764 extension of black wave ((a))-((b)). The stock truncated at that area and therefore, ended the cycle from 01/25/19 high in red wave W at 27.85.

Above from there, we expected a bounce to occur in the sequence of 3-7 or 11 swings to correct the cycle from 01/25/19 peak. In the first chart below you can see that BAC reached the first blue box area at 28.85-29.25. This is the area where we expect a reaction lower to take place. However, due to the fact that other stocks and some indices indicate more strength in short-term, BAC might continue the bounce in red wave X. Thus, this bounce can be just the first leg in black wave ((a)) which has ended at around 29 peak. Below from there a pullback in black wave ((b)) is in progress, after which black wave ((c)) rally should take place. This push higher will end the higher degree bounce in wave X.

BAC 02.13.2019 1 Hour Chart Elliott Wave Analysis

In the Elliott Wave chart update below. You can see that BAC reacted nicely lower from the first blue box area (28.85-29.25). Then it ended black wave ((b)) at 28.10 and rallied higher in wave ((c)) into the next blue box which came at 29.24-29.94. The box should see a reaction lower. In conclusion, our forecast is very accurate. Please keep in mind that the 1-hour chart which I presented have changed as the 1 hour chart is moving very dynamically.

The purpose of this blog is just to illustrate how accurate our blue boxes are. Furthermore, it shows you that the market respects our blue box. Our members can use the blue box and right side stamp to buy/sell correction in 3-7 or 11 swings.

BAC 02.15.2019 1 Hour Chart Elliott Wave Analysis


I hope you like this blog. We have developed a very good trading strategy that defines entry, stop loss and take profit levels with high accuracy. Our strategy allows members to get a high probability of getting a risk-free position shortly after entering in the trade to protect possible losses.
 

Elliottwave-Forecast

Master Trader
Feb 17, 2017
2,460
9
84
www.elliottwave-forecast.com
DAX has broken above February 6, 2019 high (11371.74) and shows a bullish sequence from December 28, 2018 low (10279.20). On the chart below, we put a bullish sequence stamp and right side higher to indicate the direction that we prefer to trade. The correction to 10867.9 low ended wave ((X)) as an Expanded Flat Elliott Wave. A Flat is a 3-3-5 structure with ABC label. The decline to 11051.11 ended wave (A), wave (B) bounce ended at 11371.74. Wave (C) of ((X)) ended at 10863.56.

After ending wave ((X)) at 10863.56, the Index has rallied and broken above the previous wave (B) high at 11371.74. This suggests that the next leg higher has likely started. The rally from 10867.9 low is unfolding as an Impulse Elliott Wave structure. Up from 10867.9, wave 1 ended at 11217.3, wave 2 ended at 11018.95, wave 3 ended at 11371.44, and wave 4 ended at 11244.52. Expect DAX to end the 5 waves move with 1 more leg higher at the blue box area of 11400.25 - 11479.66. Afterwards, the Index should pullback in wave (B) in the sequence of 3, 7, or 11 swing to correct the cycle from February 9, 2019 low. As far as the pullback stays above 10867.9, expect the Index to resume higher again. We do not like selling the proposed pullback.

1 hour DAX Elliott Wave chart
 

Elliottwave-Forecast

Master Trader
Feb 17, 2017
2,460
9
84
www.elliottwave-forecast.com
In this blog, we take a look at Elliott Wave structure of USDPLN forex pair since 1/31/2019 low and our main goal is to identify the blue box area within the pull back and what we could expect to happen from the blue box area. In our previous article about USDPLN we explained that pair is showing 5 swings up from 9/26/2018 low which makes it a bullish sequence against 1/31/2019 low and hence it should find buyers in the pull back after 3, 7 or 11 swings.

USDPLN 1 Hour Elliott Wave Analysis with Blue Box
Below is a 1 hour chart of USDPLN forex pair which shows the rally from 1/31/2019 (3.7063) low to be have unfolded as an Elliott Wave Impulse within which wave ((i)) completed at 3.7315, wave ((ii)) completed at 3.717, extended wave ((iii)) completed at 3.8392, wave ((iv)) completed at 3.8131 and wave ((v)) at 3.8594. We have labelled this as wave A and currently we are within wave B pull back to correct the 5 waves move up from 3.7063 low.

Wave B is proposed to be unfolding as a double three Elliott Wave Structure when wave ((w)) ended at 3.818, wave ((x)) ended at 3.8459, pair has already made a new low below wave ((w)) so there are enough number of swings in place to call wave ((y)) and B completed at 3.8071. However, pair failed to reach the blue box so far so while below the descending trend line, there is still scope for the pair to reach the blue box between 3.8047 - 3.7791 area to complete a double three Elliott wave structure down from 3.8594. As the right side is up and there is a bullish sequence, so we don't like selling the pair and expect buyers to appear in the blue box. Pair could either resume the rally in wave C from the blue box or bounce in 3 waves at least to allow longs to eliminate risk on the trade.

If the bounce from blue box fails and pair drops to new lows again, then we should be doing larger 7 swings structure within wave B pull back and pair should still see buyers at the next blue box area. If pair breaks above the descending trend line (currently at 3.8357), that would suggest cycle from 3.8594 high ended already at 3.8071 which could be wave B or just the first leg of wave B pull back. In either case, 3.7063 low remains to be key for the bulls and as far as we stay above this level, we should see more upside in the pair.


Elliottwave-Forecast

Master Trader
Feb 17, 2017
2,460
9
84
www.elliottwave-forecast.com
In this technical blog, we are going to take a look at the past performance of AUDCAD Elliott Wave 1-Hour Charts that we presented to our members. In which, the bounce to 1/31/2019 peak (0.9581) ended wave X bounce. Down from there, wave (w) ended in a lesser degree zigzag structure where wave (a) ended at 0.9450, wave (b) bounce ended at 0.9523 high. Wave (c) ended at 0.9375 low and finally completed wave (w) at 0.9375 low. Up from there, the pair corrected the decline from 0.9581 peak in wave (x) bounce. We will explain the structure of that bounce & forecast below.

AUDCAD Elliott Wave 1 Hour Chart From 2/20/2019


Above is the 1-hour Chart from 2/20/2019 New York update, in which the pair is correcting the short-term cycle from 1/31/2019 peak (0.9581) in wave (x) bounce. The internal of that bounce unfolded as Elliott wave double three structure. Also known as 7 swings structure where lesser degree wave w ended in 3 swings as a Flat correction at 0.9476 high. Down from there, wave x ended in lesser degree zigzag structure at 0.9408 low. Above from there, wave y of (x) higher was expected to take place as Elliott wave zigzag structure before downside resume.

AUDCAD Elliott Wave 1 Hour Chart from 2/21/2019


AUDCAD 1 Hour Elliott wave Chart from 2/21/2019 Asia update, in which the pair made the last push higher as expected and ended wave y of (x) at 0.9488 high. Down from there, the pair has made a new low below 0.9375 low confirming the next move lower in wave (y) towards 0.9280-0.9153 100%-161.8% Fibonacci extension area of (w)-(x) before a 3 wave bounce takes place. Near-term, as far as bounces fail below 0.9488 high expect pair to extend lower.

AUDCAD Elliott Wave Latest 1 Hour Chart From 2/25/2019


Double three is most common patterns in New Elliott Wave theory is 7 swings structure (double three). We spot it in the market every day in many instruments. It’s a very reliable structure by which we can make a good analysis and what is most important it’s giving us good trading entries with clearly defined invalidation levels and target areas. The picture below presents what Elliott Wave Double Three pattern looks like. It has (W),(X),(Y) labeling and 3,3,3 inner structure, which means all of these 3 legs are corrective sequences. Each (W) and (Y) are made of 3 swings, they’re having W,X,Y structure in a lower degree.


Keep in mind that the market is dynamic and the view could change in the meantime. Success in trading requires proper risk and money management as well as an understanding of Elliott Wave theory, cycle analysis, and correlation. We have developed a very good trading strategy that defines the entry. Stop loss and take profit levels with high accuracy and allows you to take a risk-free position, shortly after taking it by protecting your wallet.
 

Elliottwave-Forecast

Master Trader
Feb 17, 2017
2,460
9
84
www.elliottwave-forecast.com
British Pound Sterling is the best performing major currency last week. The Pound Sterling shows strength as the market senses progress towards a Brexit deal. This follows news pointing to progress in Brexit negotiations. Last week UK Prime Minister Theresa May and EU President Jean-Claude Juncker met in Brussels to secure a deal. Both have suggested that progress was taking place. The Euro-to-Pound (EURGBP) exchange rate dropped to 0.869 while Pound-to-Dollar (GBPUSD) rallied to 1.3109.

Negotiations revolve around securing a legal guarantee to ensure that Irish backstop in the Brexit agreement is not indefinite. This should help the deal to gain approval in UK parliament and satisfy those ministers who voted down the Brexit deal. Reuters reports that Chancellor of Exchequer Phillip Hammond says there can be a meaningful vote on the Brexit deal as early as this week as talks have been good and constructive. This suggests we could have a new agreement between the EU and UK over coming days. The UK is set to leave the EU at March 29 and the two sides will try to avoid causing damages to each other until then.

EURGBP 4 Hour Elliott Wave chart


EURGBP cycle from August 29, 2017 high shows a bearish sequence favoring further downside. As the chart above shows, we label the bounce to 0.9106 as wave (2). Decline from there is unfolding as a double three Elliott Wave structure. Down from 0.9106, wave W ended at 0.8615 and wave X ended at 0.884. Pair still needs to break below wave W at 0.8615 to validate this view. Until then, a double correction in wave X still can not be ruled out. Either way, as far as pair stays below 0.9106, expect pair to extend lower.

Keep in mind that the market is dynamic and the structure may have changed since the writing time of the article.
 

Elliottwave-Forecast

Master Trader
Feb 17, 2017
2,460
9
84
www.elliottwave-forecast.com
EURGBP shows a sequence of lower low from August 29, 2017 high, suggesting further downside is likely. The bounce to 0.9105 on January 3, 2019 high ended wave (2). From there, pair declines as a double three Elliott Wave structure where wave W ended at 0.8615 and wave X ended at 0.884. Pair still needs to break below wave W at 0.8615 to confirm that the next leg lower in wave Y has started. Until then, a double correction in wave X still can not be ruled out.

The internal of wave W unfolded as a zigzag Elliot Wave structure. Down from 0.9105, wave ((a)) of W ended at 0.8874, wave ((b)) of W ended at 0.8985 and wave ((c)) of W ended at 0.8615. The bounce in wave X unfolded as a double three structure in lesser degree where wave ((w)) ended at 0.8821, wave ((x)) ended at 0.8727, and wave ((y)) ended at 0.884. Wave Y is currently in progress as a double three structure. Near term, expect pair to extend lower towards 0.846 - 0.853 area to end wave ((w)) of Y, then it should bounce in wave ((x)) of Y before the decline resumes.

4 Hour EURGBP Elliott Wave Chart
 

Elliottwave-Forecast

Master Trader
Feb 17, 2017
2,460
9
84
www.elliottwave-forecast.com
Hello fellow traders. In this technical blog we’re going to take a quick look at the Elliott Wave charts of OIL. As our members know we were calling for further strength in OIL lately. Pull back against the December's 26th low ended at 51.24 low as Irregular Elliott Wave Pattern and we're now in the next leg higher. In the following article, we’re going to explain the Elliott wave Pattern and Forecast.

OIL 1 Hour Elliott Wave Asia Analysis 02.14.2019
Short term cycle from the 51.24 seems to be unfolding as Elliott Wave Leading Diagonal Pattern, when wave 1 was extended. We're looking for another short term high - wave 5 red to complete proposed pattern as wave (1) blue. Then pull back (2) should ideally correct the short term rally from the 51.24 low . As soon as wave (2) completes we expect more strength in OIL and further separation from the 51.24 low.


OIL 1 Hour Elliott Wave London Analysis 02.15.2019
In the meantime OIL has ended Leading Diagonal as expected. We got pull back in wave (2) against the 51.24 low, and then rally which has made new short term high. Now the price structure from the 51.24 low is showing Higher- High sequences. That break has made OIL is bullish against the 53.1 low. We got confirmation next leg up is in progress and calling for further rally within the cycle from the 51.24 low.


OIL 1 Hour Elliott Wave London Analysis 02.22.2019
53.08 short term low has held nicely and we got proposed rally. As far as we're getting shallow pull backs wave (3) blue can remain in progress as shown on the chart. We don't recommend selling and expect more strength in OIL.
Keep in mind that market is dynamic and presented view could have changed in the mean time. You can check most recent charts in the membership area of the site. Best instruments to trade are those having incomplete bullish or bearish swings sequences. We put them in Sequence Report and best among them are shown in the Live Trading Room.


Elliottwave-Forecast

Master Trader
Feb 17, 2017
2,460
9
84
www.elliottwave-forecast.com
Hello fellow traders. Today, I want to share some Elliott Wave charts of Soybean (ZS_F) which we presented to our members in the past. Below, you see the 1-hour updated chart presented to our clients on the 02/20/19. showing that ZS has a 1 Hour right side tag against 882 low.

From 12/27/18 low (867.2) ZS ended that cycle at 01/02/19 peak (920.16) in black wave ((w)). Below from there, we advised members that it should see the equal legs from that peak towards the areas of the 100 - 1.618 Fibonacci extension of blue wave (a)-(b) which came around 896.4-882.0 and unfolded as an Elliott Wave Zig Zag structure. Therefore, we expected buyers to appear in the sequences of 3, 7 or 11 swings. Due to the right side tag which you can see in the chart below, we issued a long position at the blue box area. As that was the first area for buyers to appear to take prices to new high above 02/02/19 (920.16) peak. Or a larger 3 waves reaction at least.

Soybean (ZS_F) 1 Hour Chart Elliott Wave Analysis 02/20/2019


In the last Elliott Wave chart, you can see that ZS reached the blue box area and extend a bit into the blue box buying area. Then it showed a nice reaction higher. Due to the right side tag. We advised members to buy the blue box like said above. And if traded our blue box. Any trades from that area have been risk-free, which means the stop-loss was moved to break-even, targeting higher levels. Do please keep in mind that the 1-hour chart which I presented have changed already. The blue boxes you see in our charts are our so-called High-Frequency boxes. Where the market ideally shows us a reaction either lower or higher to allow us to move our stop loss quickly to break-even.


Soybean 1 Hour Chart Elliott Wave Analysis 02/21/2019


I hope you enjoyed this blog. I wish you all good trades and if you interested in learning more about our unique blue box areas and also want to trade profitably.
 

Elliottwave-Forecast

Master Trader
Feb 17, 2017
2,460
9
84
www.elliottwave-forecast.com
Union Pacific Railroad (NYSE:UNP) is a publicly-traded railroad holding company that was established in 1969. Last year, revenues grew to $22.8 billion, while earnings was up in mid-single-digits to $10.8 billion. Revenue growth was led by strong gains in Intermodal, amid capacity constraints in the trucking industry and a higher industrial production for commodities shipments.

Union Pacific's year on year earnings growth rate has been positive over the past 5 years and it outperformed the Transportation industry. Its earnings are expected to grow by 7.1% yearly and revenue is expected to grow by 4% yearly.

UNP Future Revenue and Net Income Expectation


Moving on to the technical picture of the stock using weekly and daily Elliott wave chart :

From January 2016 low, UNP rallied higher in an impulsive 5 waves advance breaking 2015 peak which opened a new bigger cycle to the upside. The 5 waves rally ended as a wave I in September 2018 then did a 3 waves pullback Zigzag Structure in wave II which reacted higher from the blue box area $129 - $122.

Up from there, the stock resumed the rally breaking to new all time highs and opening a new bullish sequence to the upside calling for a move toward target area $226 - $287. Therefore, UNP pullbacks are expected to remain supported above December 2018 low $127 and find buyers in 3 , 7 or 11 swings.

UNP Elliott Wave Daily Chart


UNP Elliott Wave Weekly Chart


Conclusion
UNP bulls are looking to stay in charge as the stock has a bullish sequence from 2016 and 2018 lows so Investors may be looking ahead to the next couple of weeks for buying opportunities during the coming pullbacks
 

Elliottwave-Forecast

Master Trader
Feb 17, 2017
2,460
9
84
www.elliottwave-forecast.com
Since bottoming at $42.36 on December 24, 2018, Crude Oil (CL_F) has rallied more than 30%. The initial rally to $55.75 on February 4, 2019 took the form of an Impulse Elliott Wave structure. We label this 5 waves rally as wave ((A)) of a zigzag Elliott Wave structure in higher degree. Then the pullback to $51.27 ended wave ((B)) as the chart below shows. From there, Oil has broken above wave ((A)), suggesting that the next leg higher in wave ((C)) has started.

Internal of wave ((C)) is unfolding as a 5 waves impulse where wave (1) ended at $57.61 and wave (2) ended at $55.02. As is typical of an impulse, we can see the fractal nature with wave (1) further subdivides into 5 waves impulse in lesser degree. Wave (2) unfolded as an Expanded Flat Elliott Wave structure where wave A ended at $56.64, wave B ended at $57.81, and wave C ended at 55.02. Oil is now within wave (3) of ((C)) and should continue higher while dips stay above $55.02, but more importantly above $51.27. This view will gain validity if Oil starts to break above February 22 peak at $57.81. We don't like selling Oil

1 Hour Crude Oil (CL_F) Elliott Wave Chart
 

Elliottwave-Forecast

Master Trader
Feb 17, 2017
2,460
9
84
www.elliottwave-forecast.com
XLI Set to Make New Highs
The Industrial Sector ETF, XLI, is set to make new all-time highs above the January 2018 high at 80.96. From 80.96 Elliott wave analysis suggests XLI corrected lower on the daily chart in 7 swings to the 12/26/2018 low of 59.92. Within the final 3 waves of y (red label) we see a near perfect measurement of equality amongst the subwaves. From the red x high of 80.41 on 9/20/2018 the ETF dropped lower in 3 swings into the blue box range producing a reaction higher. We are labeling the 59.92 low as wave (IV) suggesting wave (V) of ((III)) is now progressing above 80.96. The Blue Box highlighted below in the daily chart are measured areas with a high probability of reaction in the next projected direction.


The 4 hour Chart Progression is Incomplete
From the December 2018 low we observe 7 swings in the chart. In our system of analysis we suspect XLI to be impulsive to the upside. Consequently this observation dictates that to be impulsive the ETF must complete a derivative of a 5 swing move from 59.92. So far we have 7 swings which is a derivative of a corrective 3 wave sequence. Corrections unfold in swings of 3,7,11,15, etc. Impulses unfold in derivatives of a 5 swing sequence. Hence the count from 59.92 in XLI should have a clear 5, 9, 13 and so on number of waves. Since we only have 7 the cycle from the low is incomplete thus calling for new highs.