Elliott Wave Analysis by EWF

Hewlett Packard Enterprise (NYSE: HPE) maintains a bullish long-term Elliott Wave outlook despite its recent decline. The weekly chart suggests that an impulsive rally from the $11.61 low has completed wave ((3)), leaving the stock vulnerable to a corrective wave ((4)) before another potential advance.

HPE Elliott Wave Structure​

Following the major wave II bottom at $11.61, HPE is showing an incomplete bullish sequence in three swings which appears to have completed the larger-degree wave ((3)) near the recent highs. The latest weekly candle shows a sharp pullback, consistent with the possibility that wave ((4)) is beginning. Corrections often unfold through multiple swings rather than a straight decline. Consequently, an initial bounce would not necessarily mean the correction has finished. The projected chart path illustrates a rebound followed by another dip before the larger uptrend resumes.

HPE_2026-10-16_07-12-26-scaled.png

HPE Stock Forecast: Support Levels​

The key area to monitor is $52.85–$40.11, corresponding to the 38.2% and 61.8% Fibonacci retracement levels of wave ((3)) marked on the chart. This zone may attract buyers as wave ((4)) develops. Price could react near $52.85 initially, while a deeper correction toward $40.11 remains possible.

The chart identifies $11.61 as the long-term Elliott Wave invalidation level. However, this distant level should not be confused with a practical stop-loss for short-term positions.

What's Next for HPE?​

If wave ((4)) completes above the structural invalidation level, HPE could begin another bullish sequence and eventually challenge the wave ((3)) high. Confirmation would require evidence that the correction has ended and upward momentum is returning.

Overall, our HPE Elliott Wave analysis favors buying opportunities after a corrective structure completes rather than selling into the broader trend. The $52.85–$40.11 region remains the principal area to watch, although projected support and upside targets are not guaranteed. The weekly trend continues to favor buyers over sellers.

Source: https://elliottwave-forecast.com/stock-market/hpe-stock-elliott-wave-forecast-bullish-support/
 
Autodesk Inc. (NASDAQ: ADSK) maintains a bullish long-term Elliott Wave outlook despite the ongoing corrective price action. The monthly chart suggests that ADSK completed a major impulsive advance in wave (I) near the 2021 highs and is currently developing a larger corrective structure in wave (II). Once this correction completes, the stock could resume its broader bullish trend.

Autodesk Elliott Wave Analysis: Corrective Structure​

The monthly chart shows that Autodesk completed a significant five-wave advance from the 2009 low at $11.70, eventually reaching the wave (I) peak in 2021. Since then, the stock has been developing a corrective structure labeled a-b-c within the larger wave (II). Wave a completed following the initial decline from the 2021 peak, while wave b represents the subsequent recovery toward the 2025 highs. The current Elliott Wave interpretation suggests that wave c could develop lower before completing the larger corrective sequence.

Corrections commonly unfold in three, seven, or eleven swings. Therefore, the anticipated decline should be viewed within the context of the broader bullish structure rather than as confirmation of a long-term bearish reversal.

ADSK_2026-10-16_07-45-18-scaled.png

ADSK Stock Forecast: Key Support at $147.09​

The preferred Elliott Wave outlook suggests that Autodesk could extend its corrective decline toward $147.09, representing the 100% Fibonacci extension of wave a measured from wave b. This area could attract buyers and potentially mark the completion of wave (II). A deeper correction remains possible, although the larger bullish structure continues to favor an eventual recovery.

The chart identifies $11.70 as the long-term invalidation level, while the next Fibonacci extension target comes in near $34.41. However, reaching that level appears less likely at this stage, as it would require a significantly deeper pullback. Instead, we expect the correction to find support around the equal legs area, where buyers could re-emerge and resume the broader bullish trend.

What's Next for Autodesk?​

Once wave (II) completes, ADSK could begin a new impulsive advance in wave (III), potentially challenging previous highs and extending toward the $360 region or higher.

Overall, our Autodesk Elliott Wave forecast remains bullish, with $147.09 representing the key area to monitor for potential buying opportunities. We prefer the bullish side after the corrective structure completes rather than selling against the larger trend.

Source: https://elliottwave-forecast.com/stock-market/autodesk-adsk-elliott-wave-forecast-bullish-support/
 
Hello Traders ! In this article, we’ll look at the price action of the GBPCAD and the potential near-term outlook. As our members know, the pair completed a three-wave pullback into the Equal Legs area. Buyers stepped in and triggered a decent rally.

Let’s examine the Elliott Wave structure and the key levels to watch for the next move in GBPCAD.

GBPCAD Elliott Wave 1 Hour Chart 10.14.2026​

GBPCAD had been forming a three-wave correction. The price structure suggested that the pullback was incomplete, with another leg down expected to complete the pattern. As our members know, we use the Equal Legs zone to identify the buyers’ area where a correction will complete. We calculate this zone using the Fibonacci Extension tool, projecting the 1.0–1.236 extension of wave W red relative to wave X red.

In this case, our Elliott Wave analysis identified a buyers’ zone around 1.8766–1.8685. We recommended that our members avoid selling , while favoring the long side from the mentioned Equal Legs area.

Official trading strategy on How to trade 3, 7, or 11 swing and equal leg is explained in details in Educational Video, available for members viewing inside the membership area.


GBPCAD Elliott Wave 1 Hour Chart 10.14.2026​

GBPCAD reached the Equal Legs zone at 1.8766–1.8685 and found buyers as expected. The pair delivered a solid reaction from the buying zone, with the corrective cycle completing at the 1.8749. low and triggering a bounce.

Note: some labels have been removed from the chart in order to protect clients’ privileges.

Keep in mind that market is dynamic and presented view could have changed in the mean time. You can check most recent charts with target levels in the membership area of the site. Best instruments to trade are those having incomplete bullish or bearish swings sequences. We put them in Sequence Report and best among them are shown in the Live Trading Room


Source: https://elliottwave-forecast.com/forex/gbpcad-elliott-wave-buyers-step-in-at-the-equal-legs-area/
 
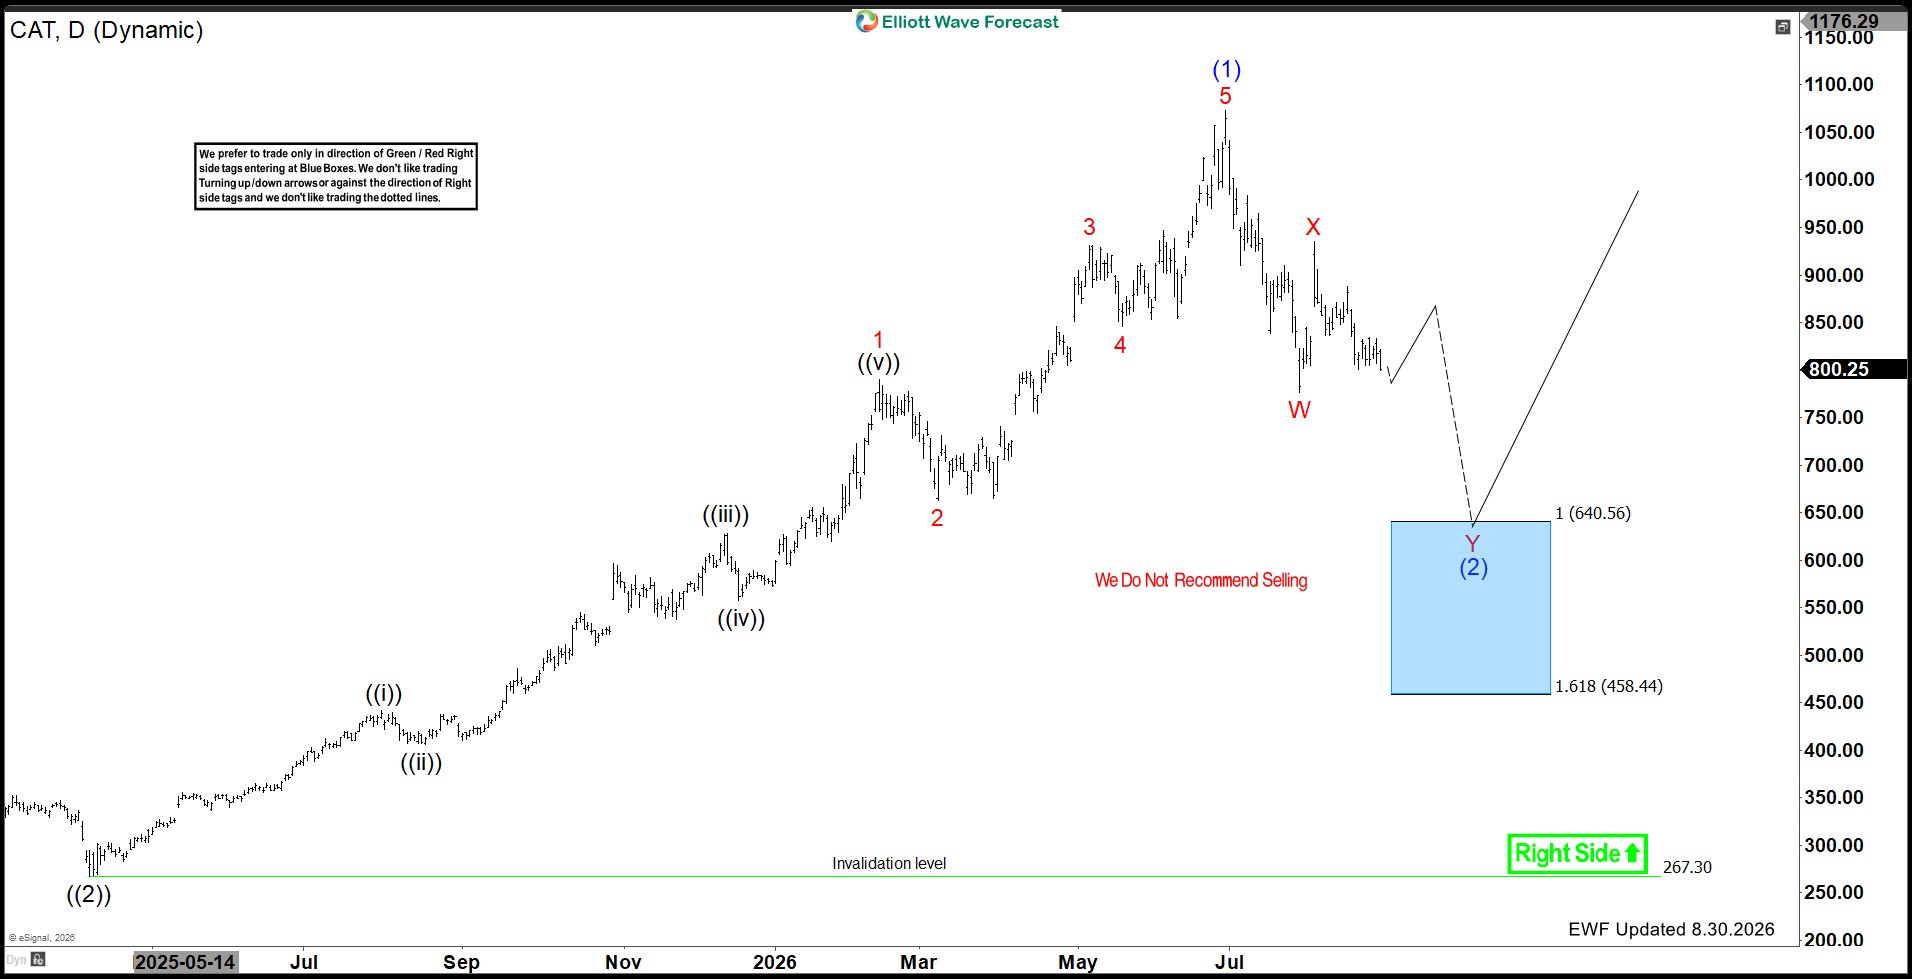
In our previous Elliott Wave update on Caterpillar Inc. ($CAT), we explained that the 5-wave advance from the April 2025 low had ended and that the stock had entered a larger corrective phase.

$CAT

The preferred view called for the decline to unfold in a 7-swing W-X-Y structure toward the 640.56–458.44 Blue Box Area, where the next long opportunity could develop.

Since then, the correction has continued to unfold as expected. $CAT has extended lower and is now getting closer to the projected Blue Box support zone. As a result, attention is increasingly shifting away from the downside and toward the area where buyers can begin looking for a reaction higher.

$CAT​

Looking at the latest daily chart, the larger 5-wave bullish cycle from the April 2025 low remains complete.

After that cycle ended, $CAT started to correct the entire advance. The first decline formed wave W, followed by a recovery in wave X. Since then, the stock has turned lower again and is now progressing through the next leg of the correction.

Therefore, the broader structure continues to favor a W-X-Y correction in wave (2).

The recent weakness does not represent a surprise within this Elliott Wave count. Instead, it continues to follow the path that was outlined previously.

Wave Y Is Moving Toward the Blue Box​

The latest decline is expected to form wave Y of the larger correction.

As price continues lower, the next important area comes between 640.56 and 458.44. This Blue Box represents the 100%–161.8% Fibonacci extension of the corrective sequence and remains the key support area for the current structure.

With $CAT already trading considerably below its prior peak, the ETF is now moving closer to the region where the correction can begin to mature.

Blue Box Area Offers the Next Buying Opportunity​

The most important part of the current setup is the 640.56–458.44 Blue Box Area.

Blue Boxes are used to identify high-frequency reversal zones where a corrective sequence reaches an extreme. Once price enters the area, sellers can begin to lose momentum while buyers start looking for a reaction in the opposite direction.

In this case, the preferred approach is not to chase the downside as $CAT approaches the Blue Box. Instead, the focus should shift toward looking for long opportunities inside the zone.

A reaction from the area can produce at least a three-wave bounce and potentially mark the completion of the entire wave (2) correction.

Buyers Can Enter for a Reaction Higher​

As $CAT reaches the Blue Box, buyers can begin to enter with the expectation of a reaction higher.

Initially, that reaction does not need to confirm that a major long-term bottom has formed. A three-wave bounce from the zone would already allow buyers to manage risk and potentially move positions toward a risk-free setup.

However, if the structure completes wave (2) inside the Blue Box, the reaction could develop into something much larger and eventually start the next major bullish cycle.

That is why the area becomes increasingly important as price approaches it.

Larger Bullish Structure Remains Intact​

Despite the ongoing correction, the larger Elliott Wave structure remains bullish.

The decline is correcting the powerful 5-wave advance from April 2025 rather than invalidating the entire longer-term trend. Once the W-X-Y structure completes, $CAT can resume the larger bullish sequence.

The broader bullish outlook remains valid above the 267.30 invalidation level.

Therefore, the current decline should continue to be viewed as a correction within a larger bullish trend until the structure proves otherwise.

Technical Summary​

To summarize, $CAT continues to follow the expected corrective path after completing 5 waves higher from the April 2025 low.

The pullback remains favored to unfold as a 7-swing W-X-Y correction, and wave Y is now pushing price closer to the 640.56–458.44 Blue Box Area.

As $CAT approaches this zone, the focus should increasingly shift toward the long side. Buyers can begin looking to enter inside the Blue Box for a reaction higher, while the larger bullish structure remains intact.

The closer price gets to the projected support area, the more important it becomes to avoid chasing the downside and instead prepare for the next potential reversal opportunity.

Source: https://elliottwave-forecast.com/st...ues-as-blue-box-buying-area-comes-into-focus/
 
Hello fellow traders. In this technical article, we’ll take a look at the GBPUSD Elliott Wave charts published in our members’ area. As our members know, GBPUSD has completed a textbook 5-wave pattern within a cycle that started at the 1.3677 peak. In this article, we’ll break down the Elliott Wave structure and examine the near-term outlook for GBPUSD.

For those who are not familiar with the most common Elliott Wave structures, we recommend checking out our Free Educational Page to learn more.

GBPUSD Elliott Wave 4 Hour Chart 10.10.2026​

GBPUSD is forming a 5-wave pattern in the cycle from the 1.3677 peak. The current structure suggests an Elliott Wave Double Three pattern, with one more move down needed to complete the 5 waves. At this stage, we see ((iv)) as completed. However, we are aware that the structure could remain sideways and alternatively still develop into a Triangle pattern or even form an Expanded Flat before breaking toward new lows. Anyway, the target for wave ((v)) is obtained by measuring the inverse 123.6%–161.8% extension of wave ((iv)). In this case, the target for wave ((v)) comes in at the 1.3180–1.3140 area.

Official trading strategy on How to trade 3, 7, or 11 swing and equal leg is explained in details in Educational Video, available for members viewing inside the membership area.


GBPUSD Elliott Wave 4 Hour Chart 10.16.2026​

GBPUSD remained sideways and made another leg down after completing a Triangle pattern in wave ((iv)). Wave ((v)) reached our target zone and triggered a sharp rally that looks impulsive. The current view suggests that the rally could be the first leg of a larger bounce.

Note: Some labels have been removed from the chart to protect our clients' privacy.

Your membership starts with just a few clicks.

Regular 14-Day Trial:
$9.99
Limited-Time Price: Only $0.99

Start Your 14-Day Trial for Only $0.99

Keep in mind that market is dynamic and presented view could have changed in the mean time. You can check most recent charts with target levels in the membership area of the site. Best instruments to trade are those having incomplete bullish or bearish swings sequences. We put them in Sequence Report and best among them are shown in the Live Trading Room

​

Source: https://elliottwave-forecast.com/el...letes-a-textbook-elliott-wave-5-wave-pattern/
 
Hello fellow traders. In this technical article, we’ll look at the Soybean Futures (ZS_F) Elliott Wave charts published in our members’ area. As our members know, ZS_F continues to show incomplete bearish sequences from the September 11 peak, pointing to further downside in the near term. Let’s break down the Elliott Wave structure and explore the latest outlook for ZS_F.

For those who are not familiar with the most common Elliott Wave structures, we recommend checking out our Free Educational Page to learn more.

ZS_F Elliott Wave 1 Hour Chart 10.13.2026​

ZS_F is forming a 3-wave correction against the 1309'1 peak, with the recovery taking the shape of an Elliott Wave Zigzag. The first leg, wave (a) red, appears to be a clear 5-wave impulsive move, followed by a 3-wave pullback in wave (b) red. We are now looking for another leg higher in wave (c) red, which should also unfold in 5 waves to complete the wave (x) blue recovery.

The target area for wave (x) blue to complete is 1308'6–1315'4, where we expect the recovery to end and the downside to resume.

Official trading strategy on How to trade 3, 7, or 11 swing and equal leg is explained in details in Educational Video, available for members viewing inside the membership area.


ZS_F Elliott Wave 1 Hour Chart 10.13.2026​

ZS_F made another leg higher within the (x) blue recovery, as expected. Wave c red delivered a sharp rally unfolding in a clear 5-wave structure. The commodity then completed the Elliott Wave Zigzag pattern and turned lower, in line with our forecast. As long as the bearish sequence remains intact, ZS_F is targeting the 1247'0 area.

Keep in mind that market is dynamic and presented view could have changed in the mean time. You can check most recent charts with target levels in the membership area of the site. Best instruments to trade are those having incomplete bullish or bearish swings sequences. We put them in Sequence Report and best among them are shown in the Live Trading Room


Source: https://elliottwave-forecast.com/co...reak-lower-after-elliott-wave-zigzag-pattern/
 
Travelers (TRV) enters Q4 with a solid business profile, supported by disciplined underwriting and consistent execution across its insurance operations. The company continues to benefit from strong pricing, resilient demand, and a favorable investment environment. Moreover, management has maintained a balanced approach between growth, profitability, and capital returns.

Looking ahead, the main focus will be whether Travelers can sustain its underwriting strength as catastrophe risk and competitive pressures remain elevated. However, the company’s scale, pricing discipline, and strong balance sheet provide important support. Overall, Travelers remains well positioned to continue growing through the cycle, while maintaining a constructive long-term outlook.

Elliott Wave Outlook: TRV Weekly Chart August​

Elliott Wave Outlook: TRV Weekly Chart August 2026
​

In August, our outlook favored a continuation of TRV’s larger bullish cycle. At that time, the diagonal suggested a possible correction before another advance. However, a breakout above the diagonal would confirm a stronger bullish extension. That development would transform the structure into a leading diagonal and place TRV inside wave III from March 2020.

From there, the structure called for additional waves three and four before wave III could complete. Therefore, we anticipated periods of consolidation rather than a major bearish reversal. Once wave III finished, a larger wave IV pullback toward the 360 area remained possible. Still, that decline should stay corrective within the broader bullish sequence.

A long-term perspective, the August outlook remained constructive. TRV continued to preserve its higher-timeframe bullish structure despite temporary pullbacks. Consequently, patience remained important while the wave sequence developed. A future wave IV correction could create another opportunity before the next major advance.

(If you want to learn more about Elliott Wave Principle, please follow these links: Elliott Wave Education and Elliott Wave Theory.)

​

Elliott Wave Principle Behind the Market Structure​

Impulse​

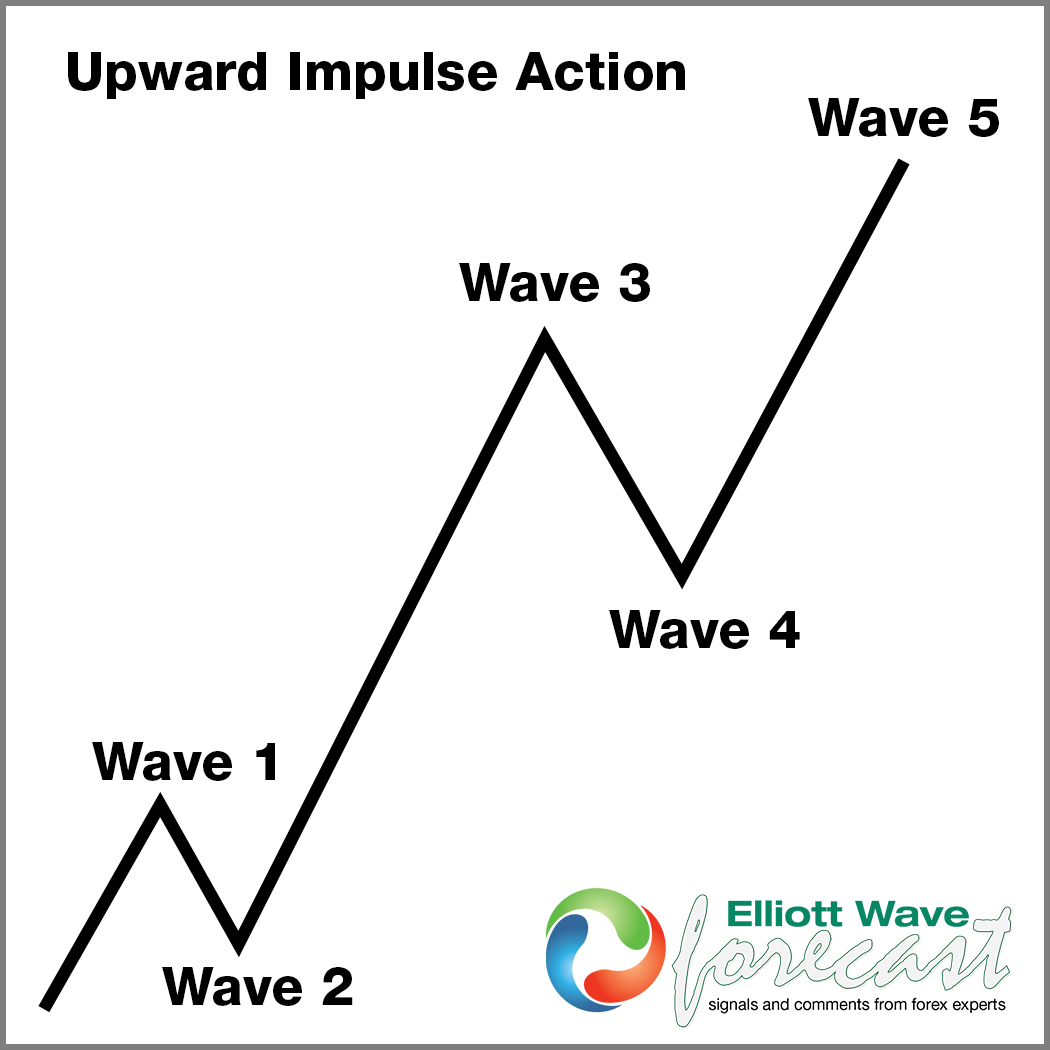
An impulse is a clean 5‑wave pattern that drives the trend forward.

  • Waves 1‑3‑5 are strong and directional.
  • No overlap between waves 1 and 4.
  • Wave 3 is usually the strongest.
  • Structure is clear, with increasing momentum.
Elliott Wave Principle Behind the Market Structure


Elliott Wave Outlook: TRV Weekly Chart October​

Elliott Wave Outlook: TRV Weekly Chart October 2026


TRV remains firmly bullish from the 2022 low, with the larger Elliott Wave structure still incomplete to the upside. The current advance appears to be developing within wave ((3)), with upside targets near 409.54–426.91. In the shorter term, TRV may still see one more push higher before completing wave (3). A corrective wave (4) should then develop, followed by another rally in wave (5). That sequence would complete the larger wave ((3)).

Afterward, a broader wave ((4)) correction could unfold before the long-term uptrend resumes in wave ((5)) until the impulse structure ends. As long as TRV remains above the 149.04 invalidation level, the larger bullish sequence stays intact.

Source: https://elliottwave-forecast.com/st...ert-is-the-next-major-rally-already-underway/
 
In technical market analysis, tracking Elliott Wave structures step-by-step allows traders to stay aligned with the primary trend direction while managing risk effectively. Today, we review a recent forecast for Silver ($XAGUSD), comparing our 4-hour forecast from late September 2026 against the price action through mid-October 2026.

The Forecast: 09.24.2026

In our 09.24.2026 4-hour update, Silver was trading near 63.73 after completing a peak at the major wave (X). At the time, the Elliott Wave structure favored a bearish outlook while remaining below the key invalidation level at 71.122. The forecast called for the completion of the remaining sub-waves (iii), (iv), and (v) of ((c)), which were expected to drive price lower into the 60.414 - 58.538 target zone and complete the larger wave W. From there, a corrective wave X bounce was anticipated before Silver resumed the broader bearish sequence and continued lower. See chart below.

SILVER-BEFORE.jpg


The Outcome: 10.14.2026

As anticipated in our October 14, 2026 4-hour update, $XAGUSD respected the invalidation level and followed the projected bearish path. Silver accelerated sharply to the downside, breaking well below the initial 60.41 - 58.53 target zone and invalidating nearby support levels along the way. The decline continued to unfold through the lower-degree waves, reinforcing the bearish momentum. Price has since extended toward the 55.56 area, confirming the strength of the downtrend while remaining firmly below the updated invalidation level at 71.141, keeping the broader bearish outlook intact. See chart below

Note: Certain labels have been intentionally concealed to protect the exclusivity of our members.

SILVER-AFTER.png


Key Takeaways for Traders

One of the key lessons from this analysis was the importance of staying aligned with the prevailing trend. By maintaining a bearish outlook while price remained below the 71.122 - 71.141 invalidation zone, traders were able to stay on the right side of the market throughout the sharp decline. Equally important was the disciplined focus on Elliott Wave structure rather than attempting to predict every short-term fluctuation. Despite several intermediate consolidations, the wave count continued to provide clear downside objectives, well-defined risk parameters, and a reliable roadmap for navigating the bearish sequence.

Source: https://elliottwave-forecast.com/el...-accuracy-tracking-the-corrective-path-lower/
 
GDXJ, the VanEck Junior Gold Miners ETF, offers targeted exposure to small‑ and mid‑cap gold mining companies,. As a higher‑beta proxy for the precious‑metals complex, GDXJ often amplifies both upside momentum and downside corrections. In the analysis below, we will look at the Elliott Wave outlook for the ETF.

GDXJ Monthly Elliott Wave View​


GDXJ-Monthly20261020195554.jpg


The monthly chart of GDXJ shows that the ETF established a major low in 2016. From that base, price has been advancing in a powerful nesting impulse. Wave (I) topped at $52.50, followed by a deep retracement in wave (II) to $19.52. The structure then nested higher within wave (III), with wave I peaking at $65.95. Pullback in wave II completed at $25.80. A strong extension unfolded thereafter, carrying wave III to $156.32, before the corrective wave IV completed at $89.83. In the near term, the broader pattern favors additional upside as GDXJ works to complete wave V of (III).

GDXJ Daily Elliott Wave View​


GDXJ-Daily20261020205729.jpg


Daily Elliott Wave outlook for GDXJ above shows the rally to $157.49 ended wave III and this completed cycle from September 2022 low. Pullback in wave IV is proposed complete at $89.83 even though it still needs to break above wave III high to rule out a larger double correction. Near term, while above wave IV at $89.83 and more importantly above wave II pivot low on September 1 2022 at $25.8, expect the ETF to extend higher.

Source: https://elliottwave-forecast.com/el...ottoming-turn-and-a-larger-double-correction/
 
In this Elliott Wave update, we examine the long-term structure in Ovintiv Inc. ($OVV). The stock started an important bullish cycle from the 2020 low, initially advancing in a clear 5-wave impulsive structure. That rally was followed by a larger 7-swing correction, which eventually completed at the April 2025 low.

Since then, $OVV has started another impulsive advance. More importantly, the latest 5-wave move has taken out the 2022 high, confirming an incomplete bullish sequence. As a result, the larger structure now favors additional upside toward the $91–$130 area.

5 Wave Impulse + 7 Swing WXY correction​

$NVDA​

$OVV​

Looking at the weekly chart, $OVV established an important low in 2020 and began a strong advance.

The rally unfolded through five waves, confirming that the move from the 2020 low was impulsive rather than corrective. Waves (1) through (5) eventually carried the stock into the 2022 high and completed wave ((1)).

Once five waves finished, a larger correction against the 2020 low became due.

7-Swing Correction Ended in April 2025​

Following the 2022 peak, $OVV entered a prolonged corrective phase. Rather than unfolding as a simple three-wave decline, the structure developed in 7 swings as a complex W-X-Y correction.

Wave (W) produced the first corrective leg lower. A recovery in wave (X) followed before another decline in wave (Y) completed the structure.

Most importantly, the correction reached its conclusion at the April 2025 low, completing wave ((2)).

This maintained the larger bullish sequence from 2020 and created the foundation for the next major advance.

New 5-Wave Impulse Confirms Bullish Momentum​

From the April 2025 low, $OVV turned sharply higher and started another impulsive structure.

The rally has developed in five waves, with waves 1 through 5 carrying the stock back toward and eventually above the 2022 high.

Breaking that previous cycle high represents an important technical development. It confirms that the advance from April 2025 is not simply a corrective rebound. Instead, the price action supports the idea that a new bullish cycle is already underway.

Break Above 2022 High Creates an Incomplete Bullish Sequence​

The move above the 2022 high creates an incomplete bullish sequence from the 2020 low.

In Elliott Wave terms, once the prior high is exceeded within an impulsive structure, the market usually requires additional upside to complete the larger-degree sequence.

Therefore, although short-term corrections should continue to occur, the larger path now favors higher prices.

The current five-wave advance can complete wave (1) before a wave (2) pullback develops. Once that correction finishes, another stronger impulsive leg should follow.

$91–$130 Becomes the Next Major Target​

With the 2022 high now taken out, the next important upside area comes between $91 and $130.

This region represents the next major target for the developing bullish sequence. The move does not need to happen in a straight line. Several smaller-degree rallies and pullbacks should unfold along the way.

However, those corrections should remain supported while the larger structure stays bullish.

As a result, the preferred path calls for $OVV to continue working higher toward the $91–$130 area as the next stages of the impulsive sequence develop.

Pullbacks Should Remain Supported​

The weekly chart suggests that the current advance is approaching the completion of another smaller-degree wave (1). Therefore, a wave (2) correction can occur before the next extension higher.

Such a pullback would be normal within the larger bullish structure.

Rather than signaling the end of the rally, a corrective decline should provide another reset before buyers return and the next impulsive wave begins.

For that reason, we do not favor selling against the larger bullish sequence.

Bigger Picture Remains Bullish​

The structure from the 2020 low remains constructive.

First, $OVV completed five waves higher from 2020. Second, the subsequent decline unfolded in 7 corrective swings into April 2025. Finally, the rally from that low has developed impulsively and has now exceeded the important 2022 peak.

Together, these developments support an incomplete bullish sequence and favor additional upside over the coming quarters.

The broader bullish outlook remains valid above the 29.80 invalidation level.

Technical Summary​

To summarize, $OVV started a bullish cycle from the 2020 low with five waves higher, followed by a 7-swing W-X-Y correction that ended in April 2025.

Since that low, another 5-wave impulsive advance has developed and has now taken out the 2022 high.

That breakout confirms an incomplete bullish sequence and opens the next stage of the advance. While short-term corrections should occur along the way, the larger Elliott Wave structure continues to favor higher prices.

As long as the broader bullish structure remains intact, $OVV can continue toward the $91–$130 area over the coming quarters.

Source: https://elliottwave-forecast.com/st...high-as-bullish-sequence-opens-toward-91-130/
 
Hello, fellow traders,

In this technical article, we’ll take a look at the Elliott Wave charts for the FTSE Index. The FTSE recently completed a Zig Zag correction at the Equal Legs area, where buyers stepped in and triggered a bounce. In the following sections, we’ll break down the Elliott Wave structure, discuss the current outlook, and explain the pattern behind the recent price action. Before diving into the FTSE chart, let’s briefly review the Elliott Wave Zig Zag pattern.

Elliott Wave Zigzag is the most popular corrective pattern in Elliott Wave theory . It’s made of 3 swings which have 5-3-5 inner structure. Inner swings are A,B,C where A =5 waves, B=3 waves and C=5 waves. That means A and C can be either impulsive waves or diagonals. (Leading Diagonal in case of wave A or Ending in case of wave C) . Waves A and C must meet all conditions of being 5 wave structure, such as: having RSI divergency between wave subdivisions, ideal Fibonacci extensions and ideal retracements.


​

FTSE 4-Hour Elliott Wave Analysis 10.03.2026​

We could clearly identify a five-wave structure in the first leg of the pullback, wave (a) blue, followed by a three-wave bounce in wave (b). The FTSE Index was then developing wave (c), which was expected to subdivide into five waves as well. At that moment we could count only 3 waves which meaned (c) leg is incomplete.

With wave (c) still incomplete, we were looking for a bounce in wave iv red, followed by one final push down in wave v. Using the Fibonacci extension tool to project wave (a) relative to wave (b), we identified the buyers' zone between 10419.86 and 10170.75.


​

FTSE 4-Hour Elliott Wave Analysis 10.20.2026​

As expected, the FTSE bounced in wave iv red before making one final push lower in wave v red. This completed the five-wave structure of wave (c), allowing us to identify a clear 5-3-5 Elliott Wave pattern and confirm the completion of the Zig Zag correction. Buyers stepped in right at the Equal Legs area at 10419.86-10170.75, confirming the expected reaction from this key support zone. The FTSE completed its Zig Zag correction within this area and started moving higher.

Note: Some labels have been removed from the chart to protect our clients' privileges.

Keep in mind that the market is dynamic, and the outlook may have changed in the meantime. Our member Chat Rooms are open 24 hours a day, Monday through Friday, on trading days, providing ongoing expert guidance on market trends and Elliott Wave analysis. Members can ask questions about market structure and technical setups at any time during trading days.


Source: https://elliottwave-forecast.com/st...-forecasting-a-bounce-after-a-zigzag-pattern/
 
USO has broken higher as anticipated and is now targeting the $180 level. Following the successful trajectory of our previous analyses, what should traders and investors expect next for this instrument?

USO (United States Oil Fund) is an exchange-traded fund (ETF) designed to track the daily price movements of West Texas Intermediate (WTI) crude oil. Instead of holding physical oil, the fund primarily invests in near-term WTI crude oil futures contracts traded on the NYMEX.

USO prices continue to surge, extending the bullish cycle that began in April 2020. Having gained over 800% since that low, the fund shows significant potential for further upside. The broad bullish trend is currently evolving as an impulse wave structure for wave ((3)). This aligns with the analysis originally presented in our March 8th blog post.

USO Monthly Elliott Wave Analysis - 8th March 2026 Update​

uso


Following a period of consolidation lasting over two years and ten months, the fund has successfully broken to the upside. Our current target for wave ((3)) sits between $188 and $238. In our August 27, 2026 update, we began tracking the wave ((3)) progression, identifying the price action as the development of wave 5 of (3) of ((3)). For a comprehensive visual breakdown, please refer to the USO weekly chart originally featured in our March 8th blog post.

USO Daily – 27th August 2026​

USO


Following the completion of wave 4 of (3) of ((3)), the price rallied from our blue box support zone. The subsequent impulse breakout marked the completion of wave ((i)), followed by a zigzag pullback for wave ((ii)). Recognizing this price action as a nesting structure, we anticipated a breakout to new highs to establish wave ((iii)) of 5. As illustrated in the chart, the market has played out exactly according to our analysis.

USO Daily – 21st October 2026​

USO


The latest daily chart indicates that the fund is currently unfolding in wave v of ((iii)) of 5 of (3) of ((3)), reaching a new high for the bullish cycle that began in late April 2020. In the short term, we maintain a bullish outlook and advise traders to look for buying opportunities on dips. The anticipated pullback in wave ((iv)), followed by wave (4), will provide ideal entry points to establish new long positions. As the broader bullish cycle remains active, we recommend continuing to build long exposure during these corrective phases. Stay tuned to the Elliott Wave Forecast blog for further updates and analysis on this instrument.

Source: https://elliottwave-forecast.com/st...path-bulls-break-higher-on-strong-oil-prices/
 
Oracle Corporation (ORCL), headquartered in Austin, Texas, is one of the world’s largest enterprise technology companies. Founded in 1977 by Larry Ellison, Bob Miner, and Ed Oates, Oracle has built its reputation around data management, enterprise software, and cloud computing. While the company’s fundamentals remain strong, the technical picture suggests a deeper correction is still unfolding.


Weekly Elliott Wave View — October 21, 2026​

​

Chart Headline — Grand Super Cycle Pullback in Progress

  • The rally from all‑time lows peaked in Grand Super Cycle wave ((I)) at $345.72 in September 2025.
  • Since then, ORCL has been correcting within wave ((II)), unfolding as a zigzag structure.
  • Wave (a) ended at $134.57.
  • Wave (b) bounced to $250.83.
  • Wave (c) remains in progress, already breaking below the prior $134.57 low.
  • The lower‑low sequence points toward the 100% extension area at $39.26, where buyers may eventually re‑enter for the next cycle higher.

Current Outlook​

Chart Headline — Bounces Likely to Fail Lower

  • Any short‑term rallies are expected to fail until the full corrective sequence completes.
  • The bearish bias remains intact while price stays below $250.83.
  • Traders should anticipate further downside before a sustainable bottom forms.

Trading Insight​

  • Bias: Bearish until the correction completes.
  • Entry approach: Avoid chasing rallies; wait for the next blue‑box zone near $39.26 for potential long setups.
  • Stops: Define invalidation above $250.83.
  • Targets: Downside toward $39.26 before buyers can regain control.
  • Risk management: Use disciplined stops and position sizing to protect capital during volatile corrections.

Why This Matters​

The Elliott Wave framework highlights how even strong companies like Oracle can undergo deep cyclical corrections. Recognizing these structures helps traders avoid buying too early and instead position for risk‑defined entries once the correction completes.

Source: https://elliottwave-forecast.com/stock-market/bearish-bias-intact-orcl-points-to-further-decline/
 
Hello fellow traders. In this technical article, we’ll look at the Bitcoin (BTCUSD) Elliott Wave charts published in our members’ area.

As our members know, we are calling the cycle from the September 21 peak complete, opening the door for a potential reversal. We’ll highlight the key levels that need to hold to maintain this view and present potential target areas to watch. Let’s break down the Elliott Wave structure and explore the latest outlook for BTCUSD.

For those who are not familiar with the most common Elliott Wave structures, we recommend checking out our Free Educational Page to learn more.

BTCUSD Elliott Wave 1 Hour Chart 10.20.2026​

We called for the correction to potentially complete at the 79,704 low. However, the bounce from this level remains shallow, and we would like to see further separation from the low to strengthen the proposed view. So far, price has established a higher-high structure from the latest low at 79,704. We expected red wave ii to complete above the blue wave (ii) low and then resume moving higher, creating further separation from the low.

Official trading strategy on How to trade 3, 7, or 11 swing and equal leg is explained in details in Educational Video, available for members viewing inside the membership area.


BTCUSD Elliott Wave 1 Hour Chart 10.21.2026​

We have seen another break higher, which is a positive sign for the bulls. The current count suggests BTCUSD could be in red wave iii of blue wave (iii), potentially leading to further upside.

As our members know, we use the 50% Fibonacci retracement of the connector as confirmation that the cycle has completed. In this case, we are measuring the 50% Fibonacci level against the October 2 peak at 87,186, which gives us 83,458 as the key level to watch. A break above this level would provide further confirmation that the cycle has ended and strengthen the bullish outlook, with BTCUSD potentially targeting the 89,124 area next.

Alternatively, if price continues moving sideways without a significant break higher, the probability of the proposed view will decrease, leaving the 79,704 low more vulnerable to a break. If BTCUSD breaks below the 79,704 pivot, the alternative scenario will take precedence, suggesting a deeper H4 correction is underway.

Keep in mind that market is dynamic and presented view could have changed in the mean time. You can check most recent charts with target levels in the membership area of the site. Best instruments to trade are those having incomplete bullish or bearish swings sequences. We put them in Sequence Report and best among them are shown in the Live Trading Room


Source: https://elliottwave-forecast.com/cryptos/bitcoin-btcusd-elliott-wave-points-to-a-potential-reversal/
 
Hello fellow traders. In this technical article, we’ll look at the Copper Futures (HG_F) Elliott Wave charts published in our members’ area. As our members know, Copper is forming an Elliott Wave Zigzag pattern within the cycle that started at the 6.7885 high. After identifying five waves down from that peak, we expected another five-wave move lower. Let’s break down the Elliott Wave structure and explain how we forecasted the path ahead.

For those who are not familiar with the most common Elliott Wave structures, we recommend checking out our Free Educational Page to learn more.

HG_F Elliott Wave 1 Hour Chart 10.21.2026​

Copper has formed a clear five-wave decline within the cycle from the 6.788 peak, followed by a three-wave bounce. This is a textbook example of an Elliott Wave Zigzag pattern in progress. This structure suggests the correction is incomplete, and we should see another leg lower in five waves.

We count wave (b) blue completed at the 6.647 high. As long as the price stays below this level, we expect the decline to continue. We calculate the target by measuring equal legs, where wave (c) equals wave (a), using the Fibonacci extension tool. This gives us a target area of 6.383–6.320 for the cycle to complete.

Official trading strategy on How to trade 3, 7, or 11 swing and equal leg is explained in details in Educational Video, available for members viewing inside the membership area.


HG_F Elliott Wave 1 Hour Chart 10.21.2026​

The commodity continues to trade lower, as forecasted. The current view suggests that another low would be ideal to complete the pattern. However, the target area of 6.383–6.320 has already been reached, so another low may or may not occur.

Keep in mind that market is dynamic and presented view could have changed in the mean time. You can check most recent charts with target levels in the membership area of the site. Best instruments to trade are those having incomplete bullish or bearish swings sequences. We put them in Sequence Report and best among them are shown in the Live Trading Room


Source: https://elliottwave-forecast.com/co...elliott-wave-forecast-mapping-the-path-ahead/
 
As the largest gold mining company globally, Newmont Corporation (NEM) plays a prominent role in the precious metals sector, with additional exposure to copper, silver, zinc, and lead production. Historically, its share price has responded closely to shifts in the economic landscape and sentiment toward gold, and the current Elliott Wave pattern points to the potential for further upside in the coming cycles.

Newmont Monthly Elliott Wave Chart​

NEM-Monthly20261026074925.jpg


Newmont Mining (NEM) maintains a bullish Elliott Wave profile, supported by multiple layers of impulsive nesting across higher degrees. After completing Wave ((I)) at $81.92, the stock entered a deep Wave ((II)) correction that ended at $12.75. The subsequent rally marks the continuation of a larger Wave ((III)) advance.

Within this bullish structure, Wave (I) rallied to $62.72 before Wave (II) corrected to $15.39. The stock then established another impulsive sequence, with Wave I terminating at $86.37 and Wave II finishing at $29.42. From there, Wave III strengthened to $135.29. The ongoing Wave IV pullback is expected to remain corrective in nature, likely unfolding in a 3- or 7-swing pattern before buyers regain control and drive prices higher.

Newmont Daily Elliott Wave Chart​

NEM-Daily20261026075654.jpg


The daily chart of Newmont Mining (NEM) reveals a well-defined five-wave advance from the February 2024 low. Wave ((1)) rallied to $58.72 before Wave ((2)) corrected to $37. The stock then staged a powerful Wave ((3)) advance to $134.88. It was then followed by a Wave ((4)) pullback that likely concluded near $88.75. A final push higher in Wave ((5)) reached $135.02, completing the larger-degree Wave III sequence. With that advance now in place, NEM appears to be working through a higher-degree Wave IV correction. The pullback should unfold in a corrective 3- or 7-swing pattern before another leg higher develops.

Newmont Elliott Wave Video​


Source: https://elliottwave-forecast.com/st...ential-for-an-extended-three-wave-correction/
 
JPMorgan enters Q4 with analysts still broadly positive on the stock. The consensus remains around Moderate Buy, with targets near $368–$374. Analysts continue highlighting strong loan growth, resilient consumer activity, and solid net interest income. However, higher rates and softer deal activity could create more volatility during the quarter.

Looking ahead, analysts still see JPMorgan as one of the strongest large U.S. banks. Management expects full-year net interest income near $106 billion, while loan growth remains healthy. However, investment banking and fixed-income activity recently lost some momentum. Therefore, Q4 could bring consolidation before the larger growth story resumes into 2027.

Elliott Wave Outlook: JPM Weekly Charts August 2026​

Elliott Wave Outlook: JPM Weekly Charts August 2026
​

In August, JPM broke above wave B, confirming the extension of wave ((5)). Moreover, that breakout placed the market inside wave (3) of ((5)). From there, the bullish structure needed to remain above wave (2) to support further upside.

Additionally, we did not anticipate pullbacks similar to those seen during 2025. Instead, we looked for steady advances combined with periods of consolidation. Those consolidations should develop five waves and eventually complete wave (3) of ((5)).

Finally, we planned to recognize wave (3) as complete after a correction near ten percent. That decline should develop as wave (4) before another advance begins. Until then, our position remained on hold while the larger bullish structure stayed intact.

(If you want to learn more about Elliott Wave Principle, please follow these links: Elliott Wave Education and Elliott Wave Theory.)

Elliott Wave Principle Behind the Market Structure​

Impulse​

An impulse is a clean 5‑wave pattern that drives the trend forward.

  • Waves 1‑3‑5 are strong and directional.
  • No overlap between waves 1 and 4.
  • Wave 3 is usually the strongest.
    Elliott Wave Principle Behind the Market Structure

Elliott Wave Outlook: JPM Weekly Charts October 2026​

Elliott Wave Outlook: JPM Weekly Charts October 2026


JPM remains in a strong long-term bullish cycle from the October 2022 low. The advance completed wave ((3)) before a corrective wave ((4)) ended near the April 2025 low. Since then, buyers have regained control, and the market has resumed the larger bullish sequence.

From the April 2025 low, JPM completed wave (1) and later corrected in wave (2). The next rally reached a new high near 365, completing another five-wave advance in wave 1. Currently, price appears to be correcting that rally in wave 2. The correction can develop as a double-three structure toward the 301.70–291.70 area. Afterward, buyers should return and push JPM toward new all-time highs.

However, we also need to consider an ending diagonal developing from the April 2025 low. This possibility would fit the final stages of the larger bullish cycle. For now, the structure does not provide enough evidence to confirm that scenario. We should learn more after JPM completes the current correction and breaks toward new highs. If the next advance develops with overlapping corrective subdivisions, the ending diagonal scenario will gain strength. Otherwise, a more impulsive structure should remain the preferred interpretation.

Source: https://elliottwave-forecast.com/stock-market/jpm-pullback-could-set-up-new-all-time-highs/
 
In our previous Elliott Wave update on the Invesco S&P 500 Equal Weight Energy ETF ($RSPG), we highlighted the possibility of a corrective pullback against the April 2025 low before the larger bullish trend resumed.

However, the market has now provided an important change in structure. Recent price action negated the expected correction and instead opened an incomplete bullish sequence to the upside. As a result, the preferred Elliott Wave count now suggests that wave 3 may already have started, with $130+ becoming the next important upside objective.

Previous Corrective Scenario Has Been Negated​

$RSPG​

Previously, $RSPG appeared to have completed five waves higher from the April 2025 low. Consequently, a larger correction against that advance looked possible before buyers returned.

Instead, price refused to develop the expected deeper corrective structure. $RSPG held its recent lows, resumed higher, and continued to extend through key resistance.

This price action changes the short-term interpretation. Rather than continuing a larger correction, the ETF has created a new bullish sequence that favors further upside.

Therefore, the prior corrective path against the April 2025 cycle is no longer the preferred scenario.

Bullish Sequence Is Now Incomplete​

$RSPG

The latest rally has created an incomplete bullish sequence.

From an Elliott Wave perspective, this means the market should still require additional upside before the current structure can finish. Short-term pullbacks can occur along the way, but they should remain corrective while the sequence continues to point higher.

More importantly, the advance from the recent wave ((2)) low has started to show impulsive characteristics. That increases the probability that a larger wave 3 is already underway.

Wave 3 May Have Started​

The current Elliott Wave count suggests that wave ((1)) completed the first major advance from the April 2025 low, followed by a corrective wave ((2)).

From there, $RSPG turned higher again and has started another impulsive structure.

The latest advance can be counted as waves 1 and 2, with price now progressing through the next bullish portion of the sequence. If this interpretation proves correct, wave 3 has already started.

This matters because third waves typically represent the strongest part of an Elliott Wave impulse. Momentum can expand quickly once the structure becomes established, especially when several bullish degrees align at the same time.

Double Nest Continues to Support Acceleration​

The larger structure remains particularly constructive because $RSPG still carries the bullish nesting sequence discussed in our previous outlook.

The March 2020 low started the larger bullish cycle, while the April 2025 low created another important bullish nest. The recent price action has now added another smaller-degree 1–2 sequence.

Consequently, multiple bullish degrees can begin accelerating together.

This is why the recent breakout carries more significance than a normal short-term rally. The nested structure supports the possibility of a stronger expansion as wave 3 develops.

$130+ Comes Into Focus​

With the bullish sequence now incomplete, the next major objective remains $130+.

$RSPG is already approaching this region, and the developing wave 3 structure suggests the ETF can continue extending above it in due time.

The path does not need to move straight higher. Wave 3 itself should contain five smaller waves, meaning temporary wave 4 pullbacks can occur before another wave 5 extension.

However, those corrections should remain supported while the larger bullish structure stays intact.

What Comes Next for $RSPG​

The preferred path now calls for $RSPG to continue building its impulsive advance.

A short-term wave 3 can extend higher, followed by a wave 4 correction and another wave 5 push. That sequence would complete wave (1) at the next degree.

Afterward, a corrective wave (2) can develop before another larger advance begins.

Therefore, while temporary weakness should still occur, the broader structure now favors buying corrective pullbacks rather than expecting a major decline against the April 2025 low.

Technical Summary​

To summarize, recent $RSPG price action has negated the previously expected larger correction against the April 2025 low.

Instead, the ETF has opened an incomplete bullish sequence, suggesting that the next major impulsive phase is already developing.

The combination of the March 2020 and April 2025 bullish nests, together with the latest smaller-degree 1–2 structure, supports the view that wave 3 may have started.

As long as the bullish structure remains intact, the preferred Elliott Wave path continues higher toward $130+, with potential for further extension as the nested sequence accelerates.

Source: https://elliottwave-forecast.com/stock-market/rspg-bullish-sequence-opens-as-wave-3-targets-130/
 
Eli Lilly & Company (LLY) discovers, develops & markets human pharmaceuticals worldwide. It comes under Healthcare sector & trades as “LLY” ticket at NYSE.

In daily, LLY favors rally as nest structure, while above 9.11.2026 low. Further upside above upper trend-line will confirm the view. Buyers can enter in 3, 7 or 11 swings against 9.11.2026 low. In weekly, it favors bullish impulse sequence as trading to ATH. It placed (II) at $64.18 low in November-2016, (III) at $937.96 high in August-2024 & (IV) at $623.78 low in August-2025 low. Within (III), it placed I at $129.48 high, II at $101.36 low, III at $966.10 high, IV at $775.81 low & V at $937.96 high. The wave III of (III) was extended nested wave showing highest momentum. The (IV) pullback was double correction. It placed w at $711.40 low, x at $935.63 high & y at $623.78 low. Each degree further subdivided in 3 or 7 swings.

LLY - Elliott Wave Latest Daily View:​

LLY-D83.jpg

Above $623.78 low, it favors rally in ((3)) against 9.11.2026 low. It placed I of (V) at $1133.95 high & II as zigzag at $850.51 low. It already shows higher high within August-2025 sequence. Within ((1)) of III, it ended (1) at $996.49 high, (2) at $943.26 low, (3) at $1182.73 high, (4) at $1079.22 low & (5) at $1249.45 high. It ended ((2)) in flat structure, where (A) at $1109.15 low, (B) at $1292.65 high & (C) at $113.29 low. Currently, it favors rally in (1) of ((3)) & expect one more push higher towards $1357.7 to extend 9.11.2026 cycle. Buyers can wait for (2) pullback in 3, 7 or 11 swings at extremes.

LLY - Elliott Wave Alternate Daily View:​

LLY-D83A.jpg

Alternatively, the structure from August-2025 low can be diagonal as each high showing divergence. But this view only confirms, if it breaks below 9.11.2026 low. If it continue higher & erase the momentum divergence after breaking above trend-line, it should turn nest.

Source: https://elliottwave-forecast.com/stock-market/lly-elliott-wave-analysis-structure-targets-1357/
 
Quick summary IONQ’s weekly picture shows a large, multi‑leg corrective sequence resolving the cycle that began at the December 2022 low. The market completed a five‑wave advance into a larger degree top and is now working through a double‑three corrective decline. This post explains the structure in plain language, highlights the levels to watch, and recommends waiting to buy only after the correction completes and the weekly structure confirms a durable turn.


Weekly Chart — Double Three Correction in Progress​

IONQ Aims for Double Correction Lower Against Dec 2022 Lows


Chart headline — Complex corrective structure; wave y still unfolding

  • The weekly count maps the cycle from the December 2022 trough. The prior advance developed as a contracting diagonal and completed a five‑wave sequence that finished the larger degree (I) near $84.64.
  • Key pivots in the advance: Wave I ≈ $21.60, Wave II ≈ $6.22, Wave III ≈ $54.74, Wave IV ≈ $17.88, Wave V ≈ $84.64. That sequence completed the larger degree (I).
  • The correction is labeled as a double three: w ended at $25.89, x bounced to $73.65, and y is still in progress and expected to push lower before the cycle from December 2022 is resolved.

What to expect next — Wait for the correction to finish before buying​

Chart headline — Treat rallies as corrective until weekly structure flips

  • A double‑three correction typically produces two corrective legs separated by a counter‑trend bounce. The x‑bounce to $73.65 was that mid‑cycle countertrend move; the ongoing y‑leg is expected to complete the correction.
  • Practical takeaway: do not buy into rallies now. Instead, plan to buy only after the correction completes and the weekly chart shows consistent higher highs and higher lows.

Levels to monitor — Where buyers should prepare to act​

Chart headline — Key reference points for a future buy zone

  • Invalidation for the bearish count: sustained weekly close above $73.65 would weaken the double‑three thesis.
  • Near‑term support: current weekly lows around the present price area — watch price behavior there for signs of exhaustion.
  • Target zone for the y‑leg completion: $14.90–$1.03 (the projected area where the corrective sequence may finish).
  • Confirmation for buyers: look for a decisive weekly close above the most recent impulsive high and a clear sequence of weekly higher highs and higher lows before initiating new long positions.

Trade plan — Buy only at the end of the correction, with rules​

Chart headline — A patient, risk‑defined approach for buyers

  • Bias: Neutral-to-bullish only after the correction completes; bearish structure remains until then.
  • Buy trigger: Enter long only after the weekly structure confirms the end of wave y — defined by consistent weekly higher highs and higher lows and momentum/volume confirmation.
  • Entry technique: When the correction completes, prefer buying into a blue‑box or measured low with a clear invalidation level. Use swing sequencing (3, 7, 11 swings) on lower timeframes to refine entries.
  • Stops: Place stops below the structural invalidation for your chosen count; keep stops logical and tied to the wave structure.
  • Targets and scaling: Scale into positions; set initial profit targets at logical resistance levels and tighten stops as the trend confirms.
  • Risk management: Keep position sizes conservative, use defined stop‑losses, and avoid holding through major events that can widen ranges.

How to know the correction is over​

Chart headline — Clear signs that buying is appropriate

  • Weekly price begins to form consistent higher highs and higher lows.
  • A decisive weekly close above the recent impulsive high and the invalidation level at $73.65.
  • Momentum and volume confirm the turn (weekly RSI divergence resolving and stronger volume on up weeks).
  • Once these conditions are met, buyers can shift from “wait” to “buy” with clearly defined risk.

Why this matters​

IONQ is a volatile, sentiment‑driven stock. Waiting for the correction to finish avoids chasing failed rallies and lets you buy with defined risk at structurally favorable levels. The Elliott Wave framework doesn’t promise exact timing, but it maps where the structure is likely to complete so you can plan disciplined entries, stops, and position sizing.

Source: https://elliottwave-forecast.com/st...ouble-correction-lower-against-dec-2022-lows/