
Elliott Wave Analysis by EWF
- Thread starter Elliottwave-Forecast
- Start date
- Watchers 28
You are using an out of date browser. It may not display this or other websites correctly.
You should upgrade or use an alternative browser.
You should upgrade or use an alternative browser.
")
Last week, we talked about the Grand super cycle and Super cycle from 2009 low in UK FTSE and explained how it was supporting the idea of buy in the dips in the World Indices. In this blog, we will take a look at Elliott Wave view of Eurostoxx Index in weekly time frame to determine the timing for the pull back in FTSE Index to end and timing to buy the World Indices.
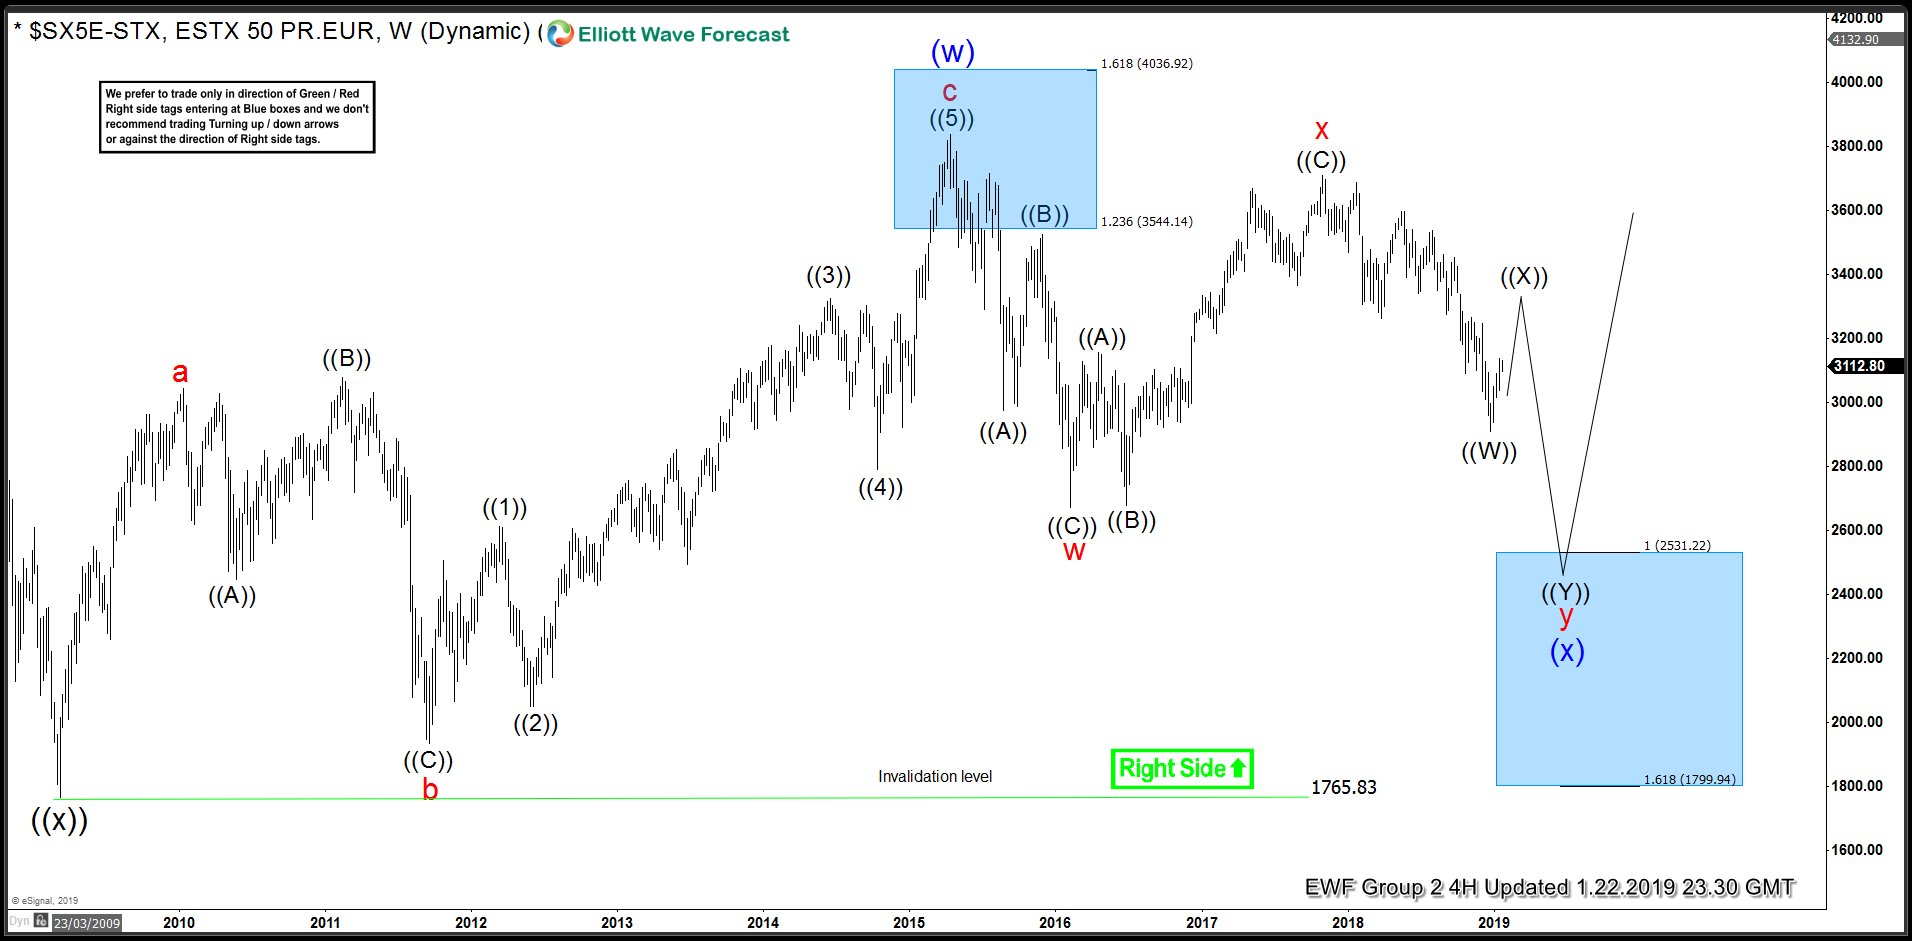
Eurostoxx Elliott Wave Analysis -Weekly Time Frame
Eurostoxx rally from March 2009 low to April 2015 peak was a 3 waves move that we have labelled as an Elliott wave zig-zag structure. A zig-zag is an “abc” structure in which wave “a” is in 5 waves, wave “b” is in 3 waves and wave “c” is also in 3 waves. This was followed by a 3 waves drop to 2672 in February 2016. Following this drop, Index tried to resume the rally but failed below April 2015 peak and started dropping again. Rally from February 2016 low to October 2017 peak unfolded as an Elliott wave FLAT structure and since then the Index has dropped again in 3 waves so far. Even when Index has not yet broke below February 2016 low, our proprietary distribution system is telling us that the pivot at February 2016 low has given up which means that level is likely to break and open extension lower toward 2531.22 – 1799.94 area.
As pivot at February 2016 low has given up, the current bounce in wave (( X )) is expected to fail and find sellers in 3,7 or 11 swings and decline should then resume as far as pivot at October 2017 peak remains intact. We know already that FTSE is correcting the cycle from 2009 low and Eurostoxx Index is doing the same. As Eurostoxx didn’t break above 2015 peak so it provides us with a clear floor on the down side and this floor comes between 2531.22 – 1799.94, once this area is reached, ideally FTSE and rest of the World Indices should also finish their pull back and find buyers to resume the rally for new highs or a larger 3 waves bounce at least.
he current price action and Elliott wave analysis suggest further declines for TSLA shares. Not even a full month into the new year TSLA shares have already seen 2 large declines. The first drop was blamed on a pricing adjustments for U.S. vehicles. The 2nd drop is being blamed over layoffs and unappealing guidance. Bearish traders seem to be piling on for lower prices with nearly 20% of the stock’s float being shorted. Options traders are also buying over 2 times the amount of puts to calls as of this article’s printing.
No doubt prices of the stock look to be going lower. We never admit to be fundamental experts so as always here at EWF we look to the cycle, sequence, and Elliott wave analysis to forecast the next directional move of consequence. And, in this case, Elliott wave near term structural interpretations also call for a drop.
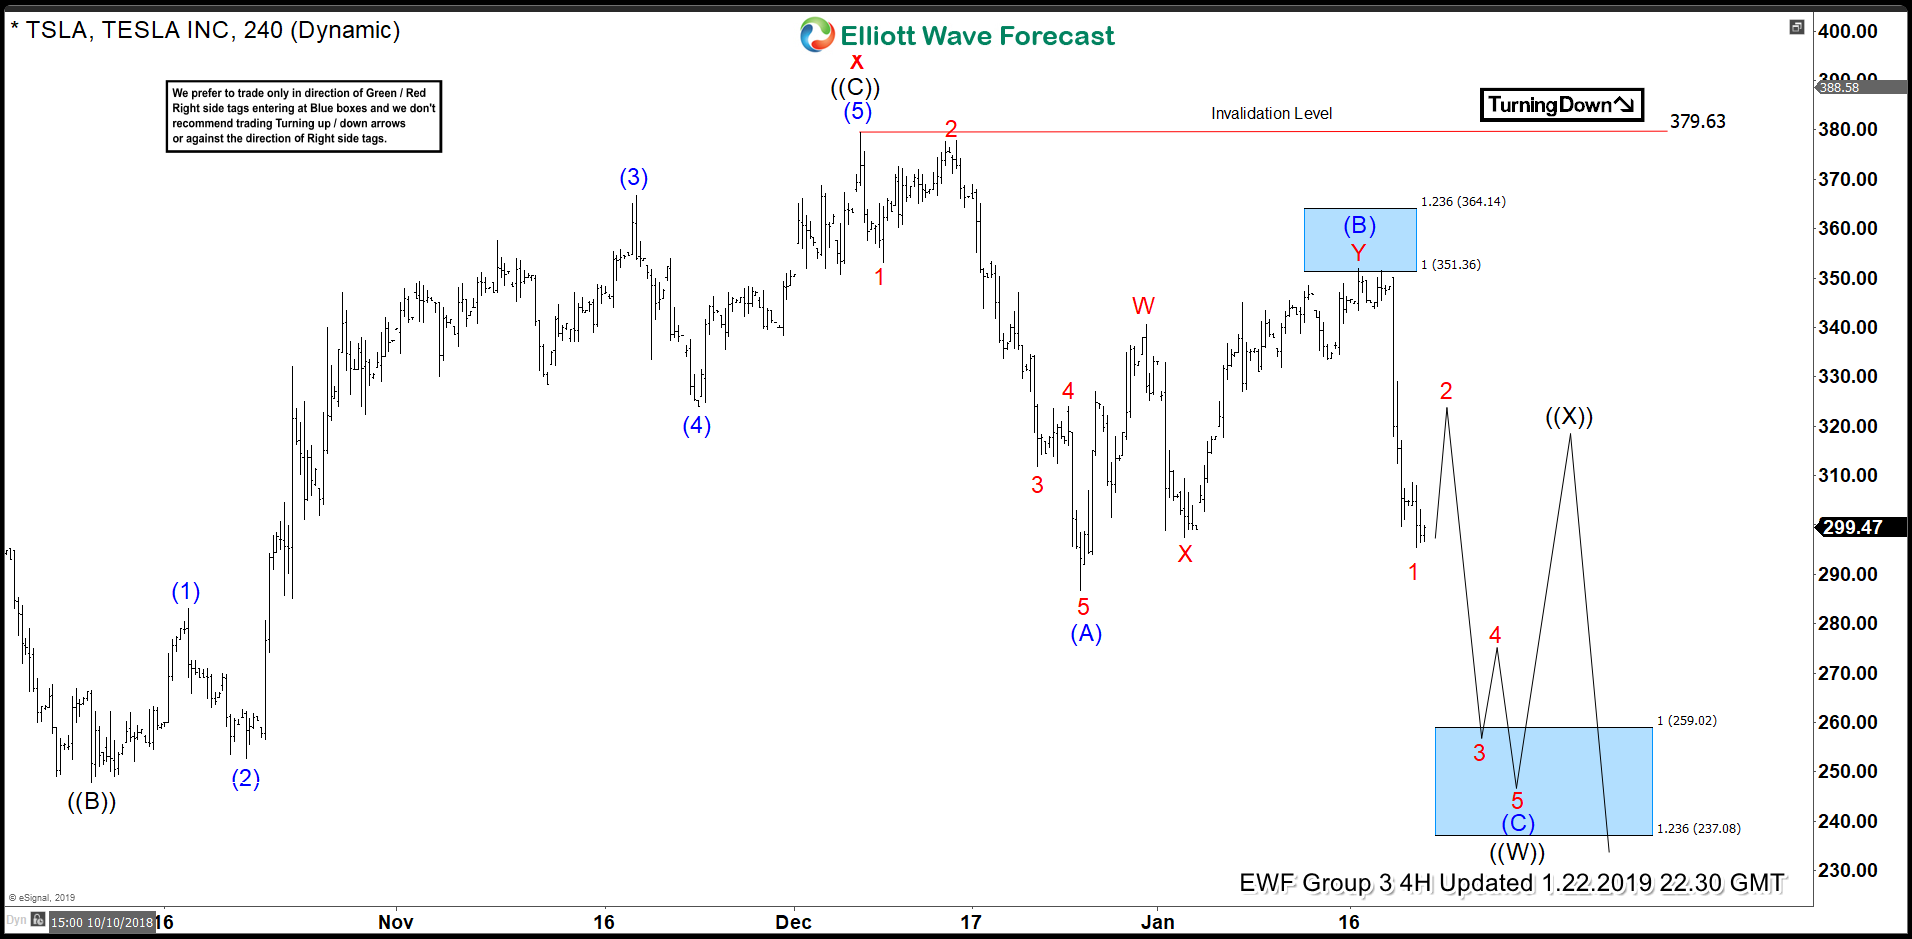
Since June of 2017 TSLA meandered sideways in a nearly $150 range. We now believe the stock is at an inflection point where prices can extend from the range. Current Elliott wave analysis suggests that break will be to the downside.
The Chart below is our latest 4hr interpretation of TSLA. While under the “x” wave (in red) high near 380 we see prices extending to at least 260. From there we can expect a bounce higher in 3 waves minimum. As long as this bounce remains under the “invalidation level” at the top of the chart the stock will be poised to move lower to levels not seen since early 2017 in the projected wave ((Y)).
TSLA 4hr Chart

TSLA Poised to take out 2018 Lows
Wishing you Success!
No doubt prices of the stock look to be going lower. We never admit to be fundamental experts so as always here at EWF we look to the cycle, sequence, and Elliott wave analysis to forecast the next directional move of consequence. And, in this case, Elliott wave near term structural interpretations also call for a drop.
Since June of 2017 TSLA meandered sideways in a nearly $150 range. We now believe the stock is at an inflection point where prices can extend from the range. Current Elliott wave analysis suggests that break will be to the downside.
The Chart below is our latest 4hr interpretation of TSLA. While under the “x” wave (in red) high near 380 we see prices extending to at least 260. From there we can expect a bounce higher in 3 waves minimum. As long as this bounce remains under the “invalidation level” at the top of the chart the stock will be poised to move lower to levels not seen since early 2017 in the projected wave ((Y)).
TSLA 4hr Chart
TSLA Poised to take out 2018 Lows
Wishing you Success!
Hello fellow traders. In this technical blog we’re going to take a quick look at the Elliott Wave charts of Palladium Futures, published in members area of the website. As our members know, the commodity has had incomplete bullish sequence in the cycle from 1056.56 low. The Elliott wave structure had been calling for further strength. Consequently, we advised members to avoid selling Palladium Futures and keep keep buying the dips in the sequences of 3,7,or 11 swings whenever opportunity presented itself. In further text we’re going to explain Elliott wave structure and trading setup.
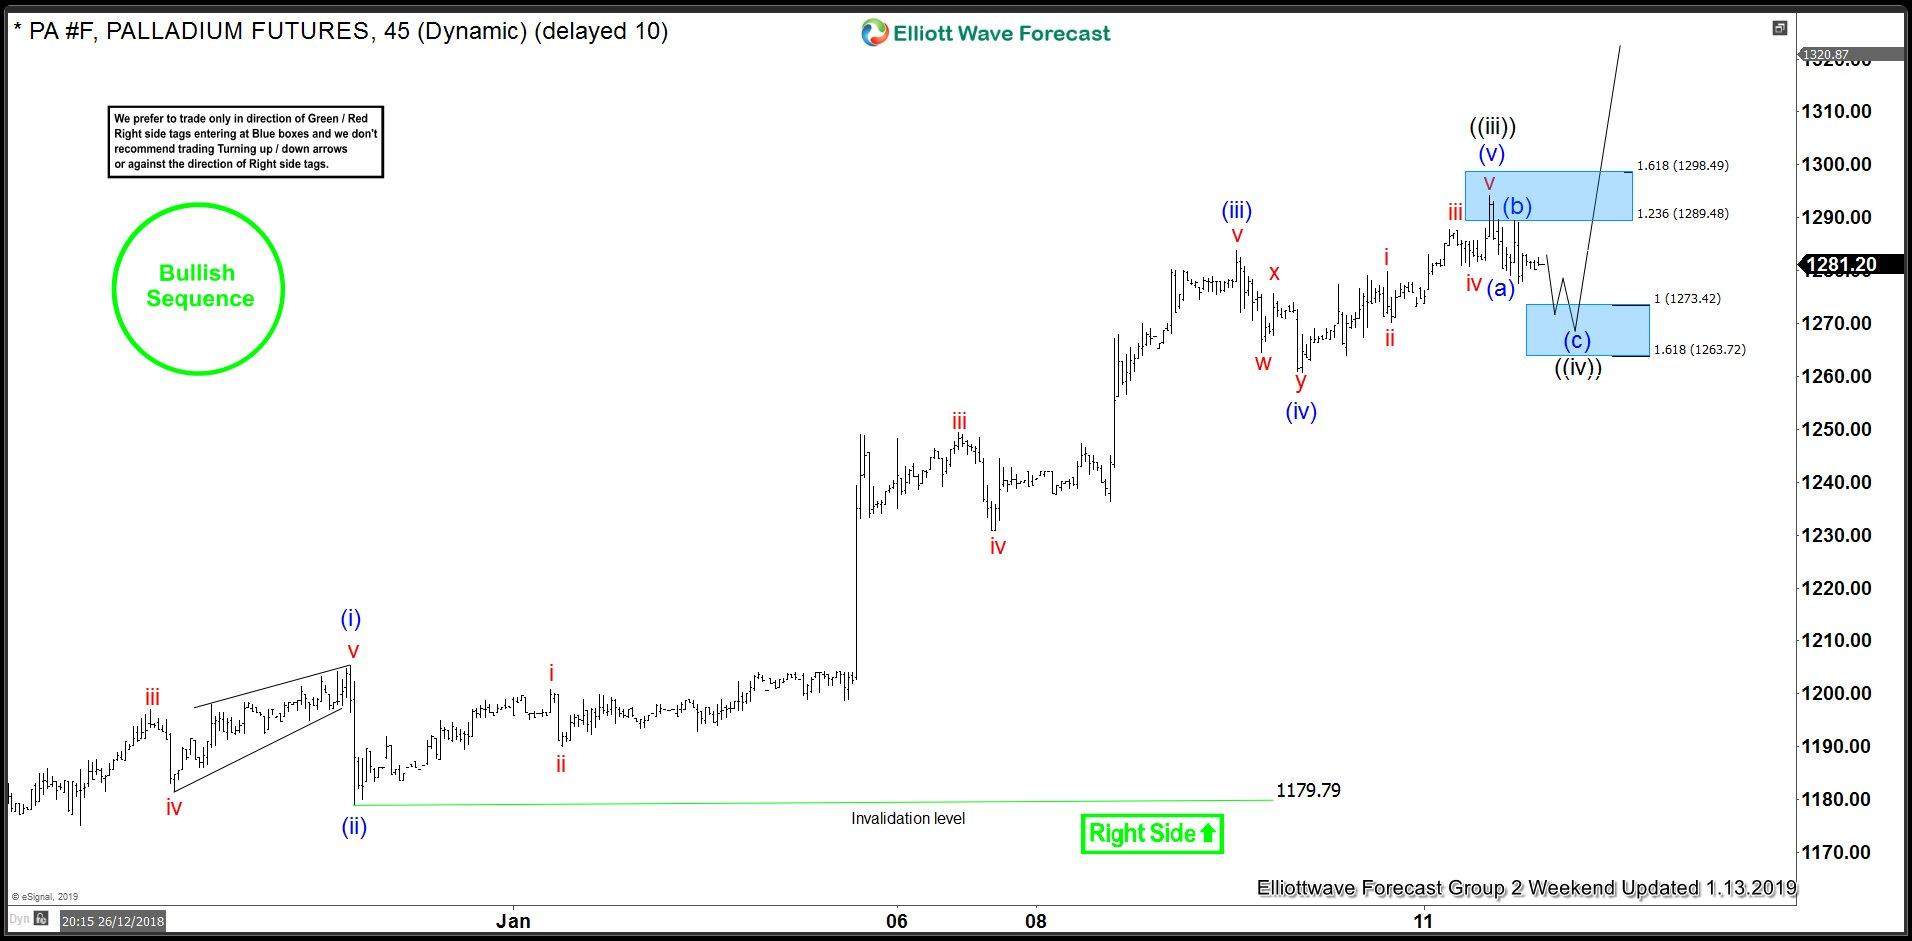
Palladium 1 Hour Elliott Wave Analysis 1.13.2019
As we can see on the chart below, Palladium is doing wave ((iv)) pull back, that is unfolding as (a)(b)(c) ZigZag Elliott Wave pattern. The commodity is bullish against the 1179.79 low in first degree, and we favor the long side. Short term pull back has scope to reach 1273.42-1263.72 area , where we like to be buyers for proposed rally or 3 wave bounce altneratively. Although we expect to see another leg down , we advise members to avoid selling against the main bullish trend. Strategy is waiting for mentioned area 1273.42-1263.72 to be reached, before entering long positions. As the main trend is bullish, we expect to see reaction in 3 waves up from the blue box at least. As soon as the bounce reaches 50 fibs against the (b) blue high, we will make long positions risk free and let the profit run.

Palladium 1 Hour Elliott Wave Analysis 1.14.2019
Eventually Palladium has given us leg down toward blue box- buying zone. Buyers have appeared shortly after and we got turn higher, when pull back ended right at the upper end of the blue box. Now calling pull back completed and we already got the new high. As a result members who took long trades are now enjoying profits with risk free positions.

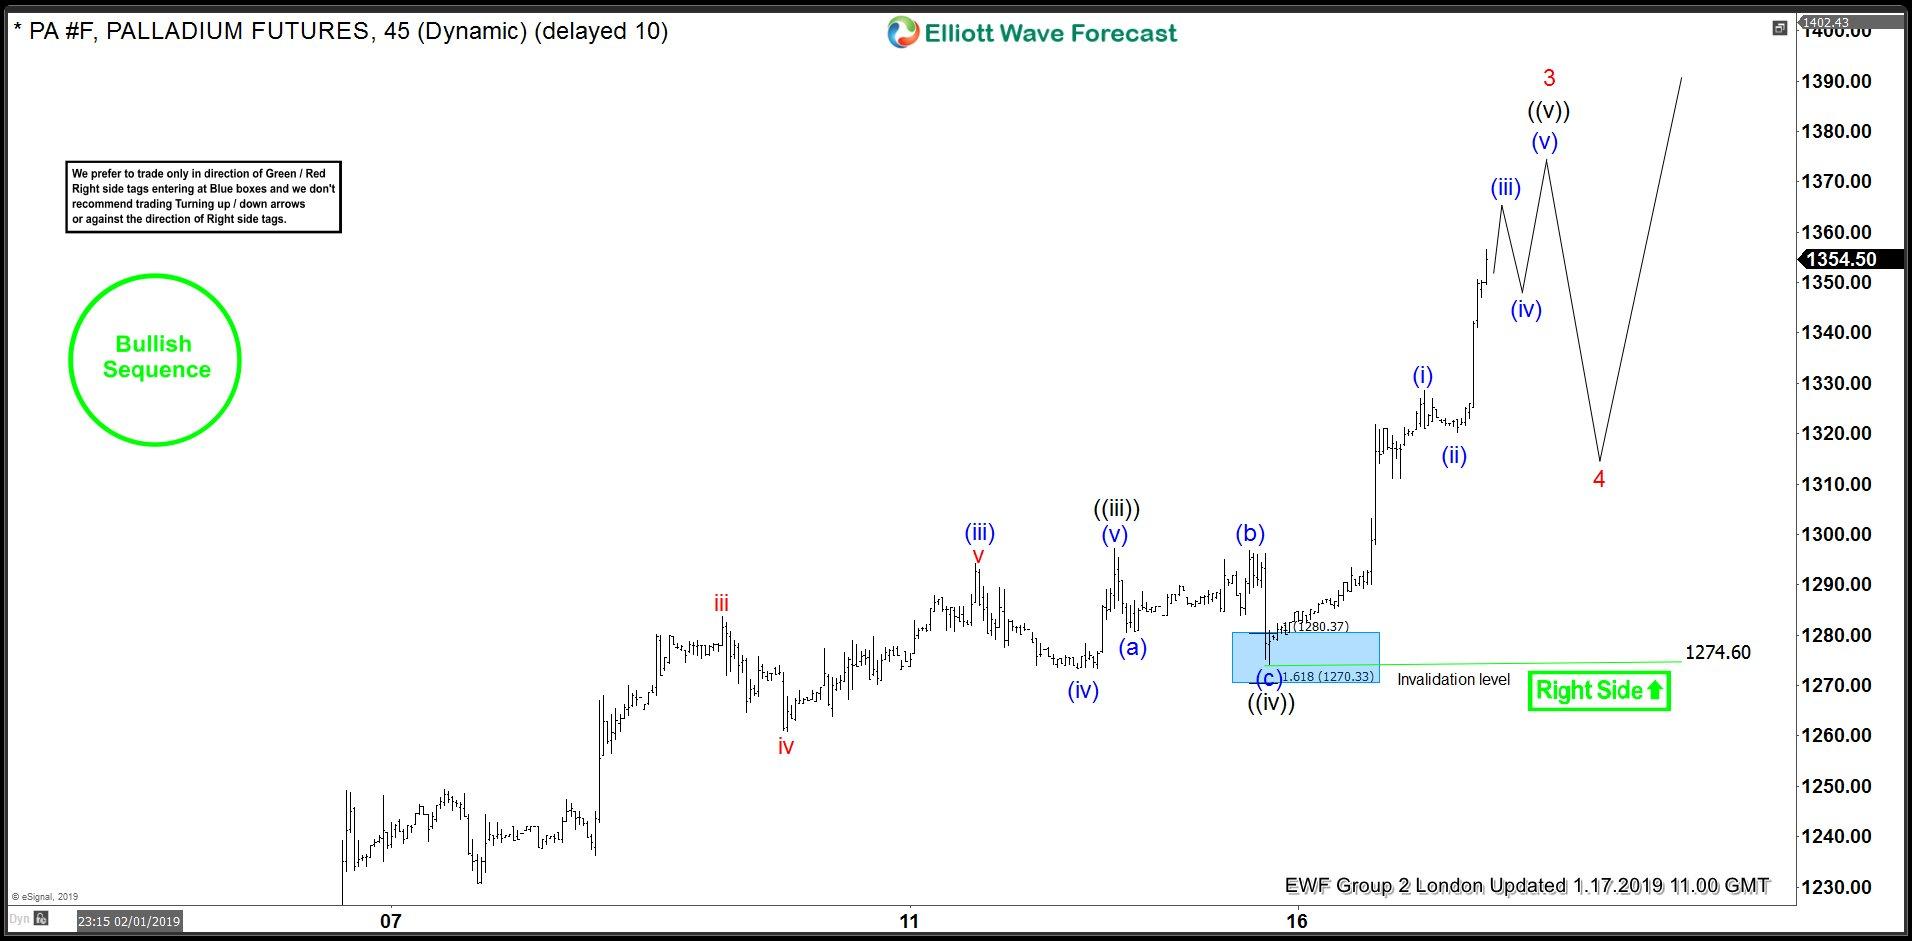
Palladium 1 Hour Elliott Wave Analysis 1.17.2019
The price has held last short term low nicely and we got further rally as expected. Count has been twicked , when now calling wave ((iv)) pull back completed at 1274.6. We can get more upside in short term before wave 4 red correction takes place.You can check most recent charts in the membership area of the site.
Note: Market is dynamic and presented view could have changed in the mean time. Best instruments to trade are those having incomplete bullish or bearish swings sequences. We put them in Sequence Report and best among them are shown in the Live Trading Room.

Palladium 1 Hour Elliott Wave Analysis 1.13.2019
As we can see on the chart below, Palladium is doing wave ((iv)) pull back, that is unfolding as (a)(b)(c) ZigZag Elliott Wave pattern. The commodity is bullish against the 1179.79 low in first degree, and we favor the long side. Short term pull back has scope to reach 1273.42-1263.72 area , where we like to be buyers for proposed rally or 3 wave bounce altneratively. Although we expect to see another leg down , we advise members to avoid selling against the main bullish trend. Strategy is waiting for mentioned area 1273.42-1263.72 to be reached, before entering long positions. As the main trend is bullish, we expect to see reaction in 3 waves up from the blue box at least. As soon as the bounce reaches 50 fibs against the (b) blue high, we will make long positions risk free and let the profit run.
Palladium 1 Hour Elliott Wave Analysis 1.14.2019
Eventually Palladium has given us leg down toward blue box- buying zone. Buyers have appeared shortly after and we got turn higher, when pull back ended right at the upper end of the blue box. Now calling pull back completed and we already got the new high. As a result members who took long trades are now enjoying profits with risk free positions.

Palladium 1 Hour Elliott Wave Analysis 1.17.2019
The price has held last short term low nicely and we got further rally as expected. Count has been twicked , when now calling wave ((iv)) pull back completed at 1274.6. We can get more upside in short term before wave 4 red correction takes place.You can check most recent charts in the membership area of the site.
Note: Market is dynamic and presented view could have changed in the mean time. Best instruments to trade are those having incomplete bullish or bearish swings sequences. We put them in Sequence Report and best among them are shown in the Live Trading Room.
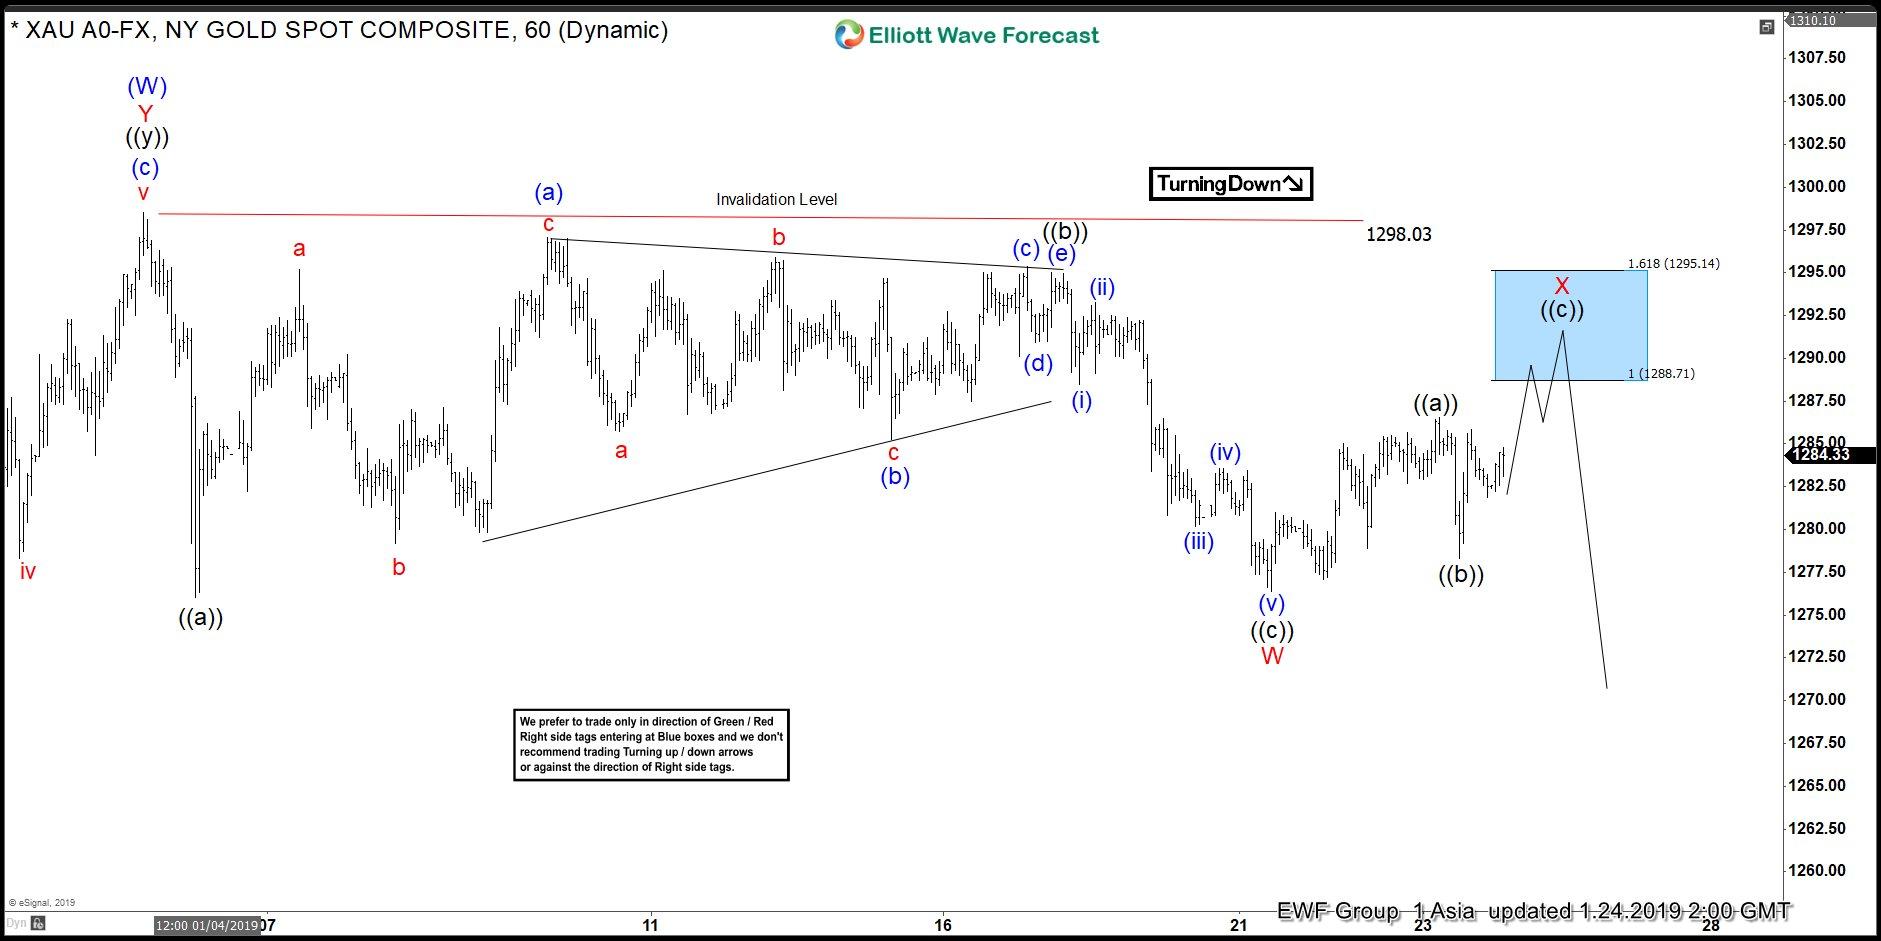
Short term Elliott Wave view in Gold suggests the rally to $1298.03 ended wave (W). The yellow metal is now correcting the cycle from August 16, 2018 low within wave (X) in 3, 7, or 11 swing. Internal of wave (X) is unfolding as a double three Elliott Wave structure where wave W ended at 1276.4 and wave X is in progress.
A double three is a combination of two corrective Elliott Wave structures. The link of the two structures has the label of W and X. Internal of wave W in this case is a zigzag Elliott Wave structure. Wave ((a)) of W ended at $1276, wave ((b)) of W ended at $1294.52 and wave ((c)) of W ended at $1276.40.
Wave X bounce is currently in progress to correct cycle from Jan 4, 2019 peak ($1298.03). The internal of wave X is unfolding as a zigzag. Wave ((a)) of X ended at $1286.53 and wave ((b)) of X ended at $1278.30. Expect Gold to extend higher in wave ((c)) of X towards $1288.7 – $1295.1 area before turning lower. As far as pivot at $1298.03 high stays intact, Gold can turn lower and continue to consolidate.
Gold 1 Hour Elliott Wave Chart
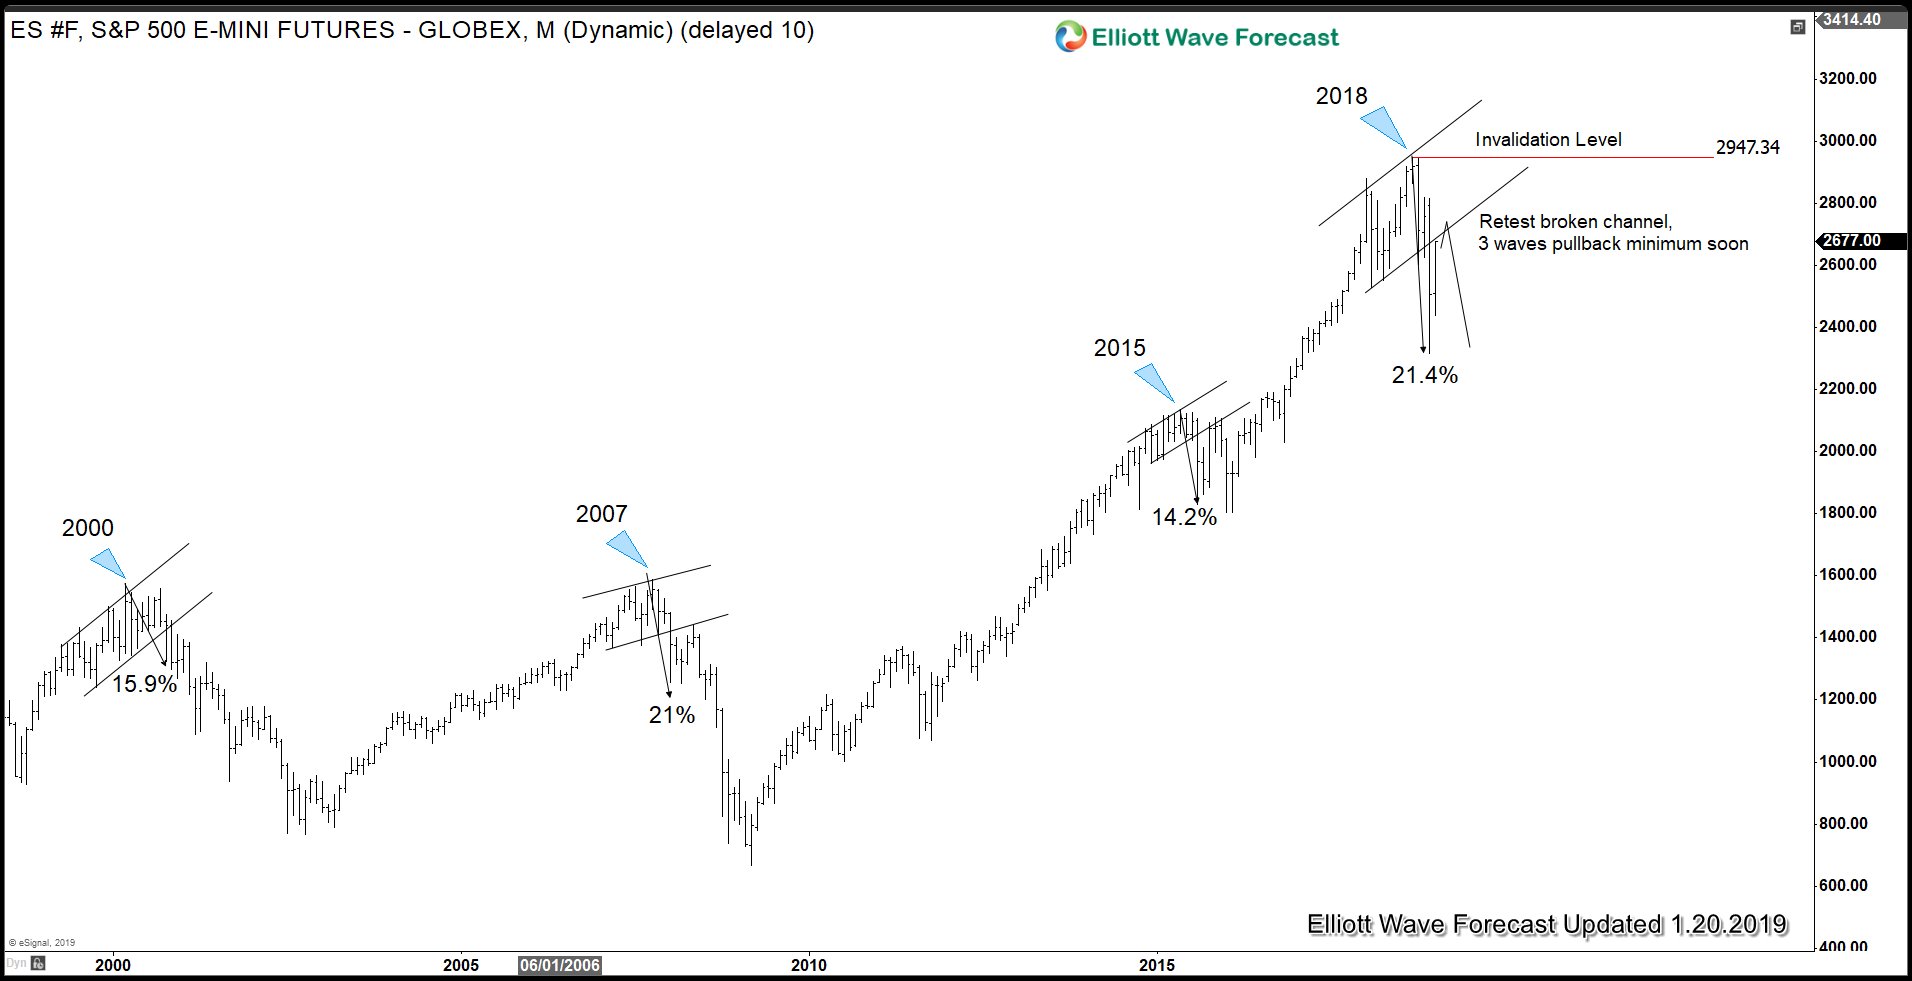
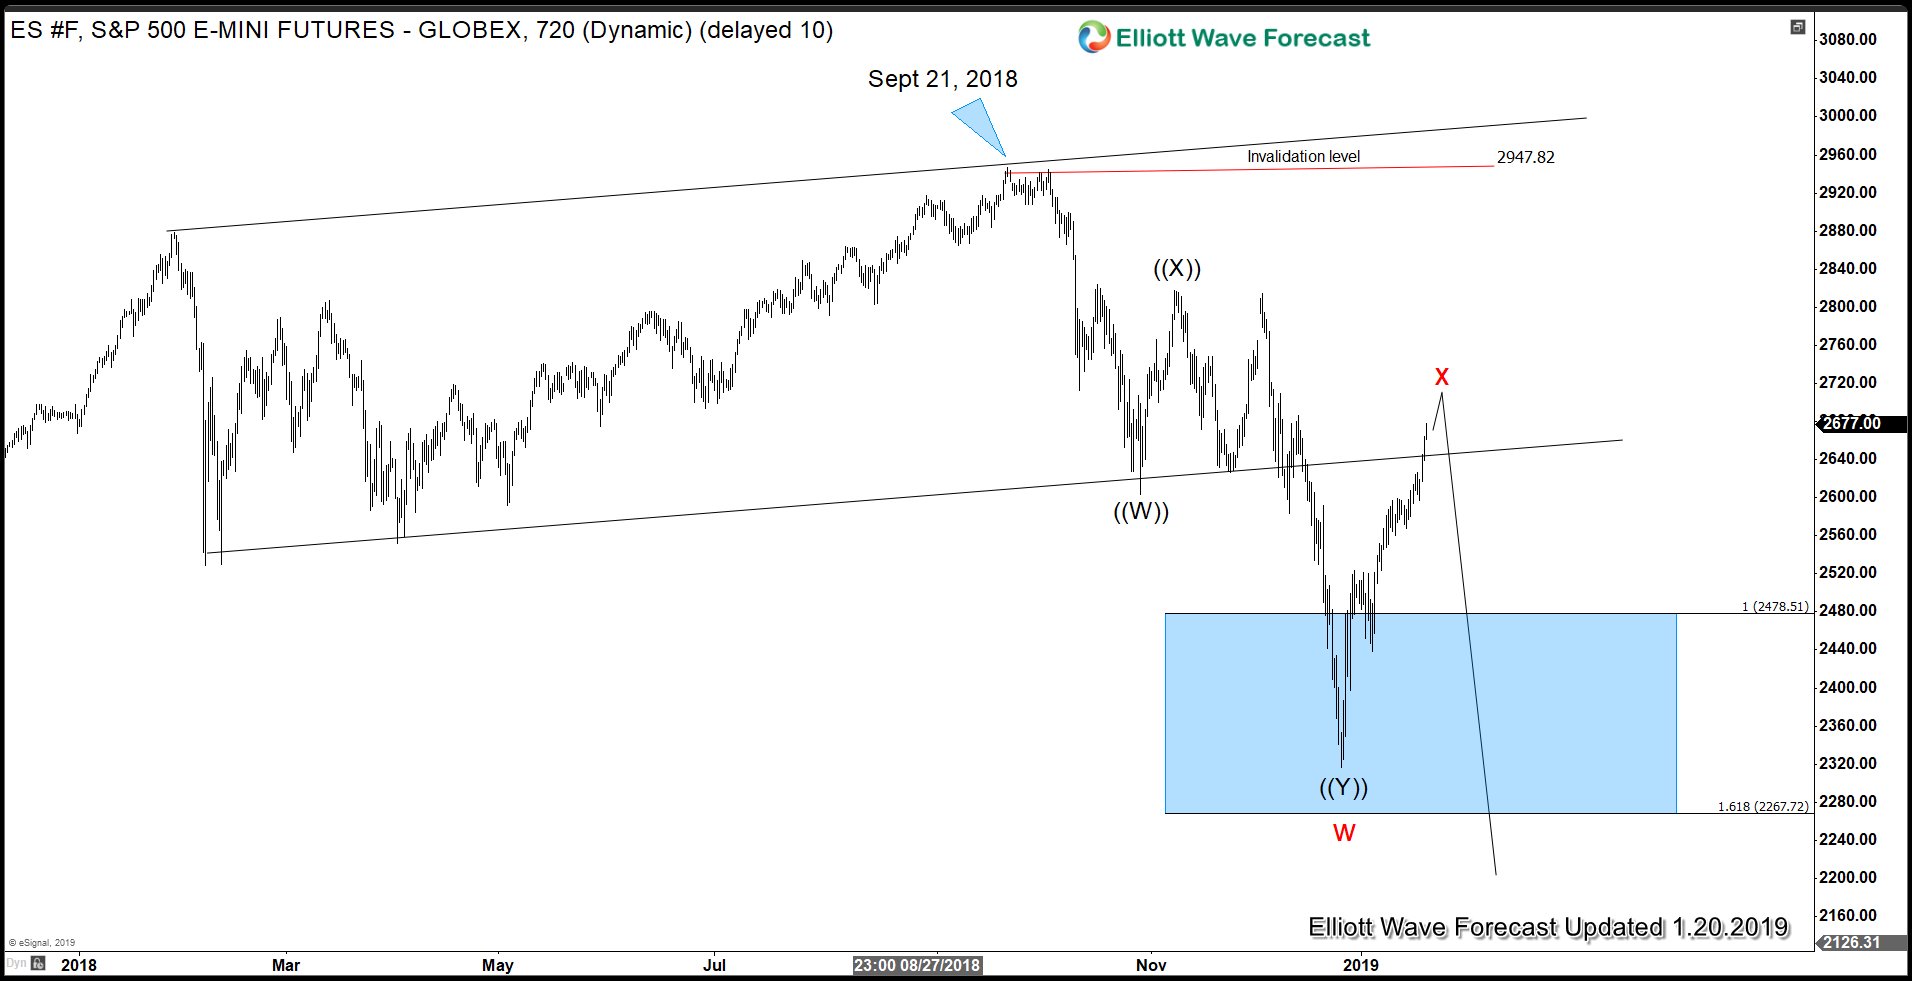
S&P 500 formed a significant high at 2947 on Sept 21, 2018 after a 342% rally in 10 years. During the entire rally from year 2009 low, there was no major correction in the Index, that is until last year. In less than 3 months, the Index has dropped 21.4% from the peak. The Index bottomed at 2316.75 on December 26, 2018. It has now retraced more than 50% of the decline.
Is the bull market ready to resume higher? Not so fast. In the following chart, we will show how the Index can face a major resistance in coming days / weeks. The important key pivot remains last year’s high at 2947. As far as this level holds, the Index can still extend lower to break below Dec 26, 2018 low at 2316.75 or pullback in 3 waves at least.
S&P 500 E-Mini Futures ($ES_F) Long Term Technical Chart


Weekly chart on S&P 500 E-Mini Futures above shows 4 major corrections since year 2000. In all cases, the initial leg of the decline was more than 10% and broke below an ascending bullish channel. After the initial break of the channel, we can see the Index rallied to retest the broken channel in year 2000, 2007, and 2015. Each time, the retest failed and the Index then reversed lower and broke the previous low of the initial decline.
The current situation is similar to these previous 3 major tops. We had a 21.4% correction since the top in year 2018 which is the initial leg of the decline that broke an ascending bullish channel. The Index has rallied and corrected more than 50% of the initial decline, now retesting the broken channel. As far as last year’s pivot high at 2947 stays intact, the Index can start to rollover and pullback in 3 waves soon at least. If history is any indication, it can even break below the low on December 26, 2018 at 2316.75.
S&P 500 E-Mini Futures ($ES_F) Elliott Wave Chart


The initial decline from September 21, 2018 (2947) to 2316.75 is clearly in 3 swing. We label this correction as ((W))-((X))-((Y)) which in Elliott Wave is also known as a double three. We need to keep in mind that the structure of the selloff so far is not impulsive (5 waves). Thus, as far as the current data shows, it doesn’t support a major bear market. However, the current correction still has scope to extend lower, thus making it the biggest correction since 2009 low. As far key level at 2947 high holds, Index still can extend lower and break below 2316.75. Potential target to the downside is 100% Fibonacci extension of the red w-x from September 21, 2018 high in the 2000 area.
To conclude: The structure of the selloff in S&P 500 from September 21, 2018 high last year is corrective which does not support a major bear market. However, the current correction can become the largest correction since 2009 low and as far as the rally fails below last year’s high at 2947, more downside to 2000 area can happen.
Is the bull market ready to resume higher? Not so fast. In the following chart, we will show how the Index can face a major resistance in coming days / weeks. The important key pivot remains last year’s high at 2947. As far as this level holds, the Index can still extend lower to break below Dec 26, 2018 low at 2316.75 or pullback in 3 waves at least.
S&P 500 E-Mini Futures ($ES_F) Long Term Technical Chart
Weekly chart on S&P 500 E-Mini Futures above shows 4 major corrections since year 2000. In all cases, the initial leg of the decline was more than 10% and broke below an ascending bullish channel. After the initial break of the channel, we can see the Index rallied to retest the broken channel in year 2000, 2007, and 2015. Each time, the retest failed and the Index then reversed lower and broke the previous low of the initial decline.
The current situation is similar to these previous 3 major tops. We had a 21.4% correction since the top in year 2018 which is the initial leg of the decline that broke an ascending bullish channel. The Index has rallied and corrected more than 50% of the initial decline, now retesting the broken channel. As far as last year’s pivot high at 2947 stays intact, the Index can start to rollover and pullback in 3 waves soon at least. If history is any indication, it can even break below the low on December 26, 2018 at 2316.75.
S&P 500 E-Mini Futures ($ES_F) Elliott Wave Chart
The initial decline from September 21, 2018 (2947) to 2316.75 is clearly in 3 swing. We label this correction as ((W))-((X))-((Y)) which in Elliott Wave is also known as a double three. We need to keep in mind that the structure of the selloff so far is not impulsive (5 waves). Thus, as far as the current data shows, it doesn’t support a major bear market. However, the current correction still has scope to extend lower, thus making it the biggest correction since 2009 low. As far key level at 2947 high holds, Index still can extend lower and break below 2316.75. Potential target to the downside is 100% Fibonacci extension of the red w-x from September 21, 2018 high in the 2000 area.
To conclude: The structure of the selloff in S&P 500 from September 21, 2018 high last year is corrective which does not support a major bear market. However, the current correction can become the largest correction since 2009 low and as far as the rally fails below last year’s high at 2947, more downside to 2000 area can happen.
In this technical blog, we are going to take a look at the past performance of Apple ticker symbol: $AAPL, 1 hour Elliott Wave charts that we presented to our clients. We are going to explain the structure and the forecast below.
Apple 1 Hour Elliott Wave Chart From 01/13/2019

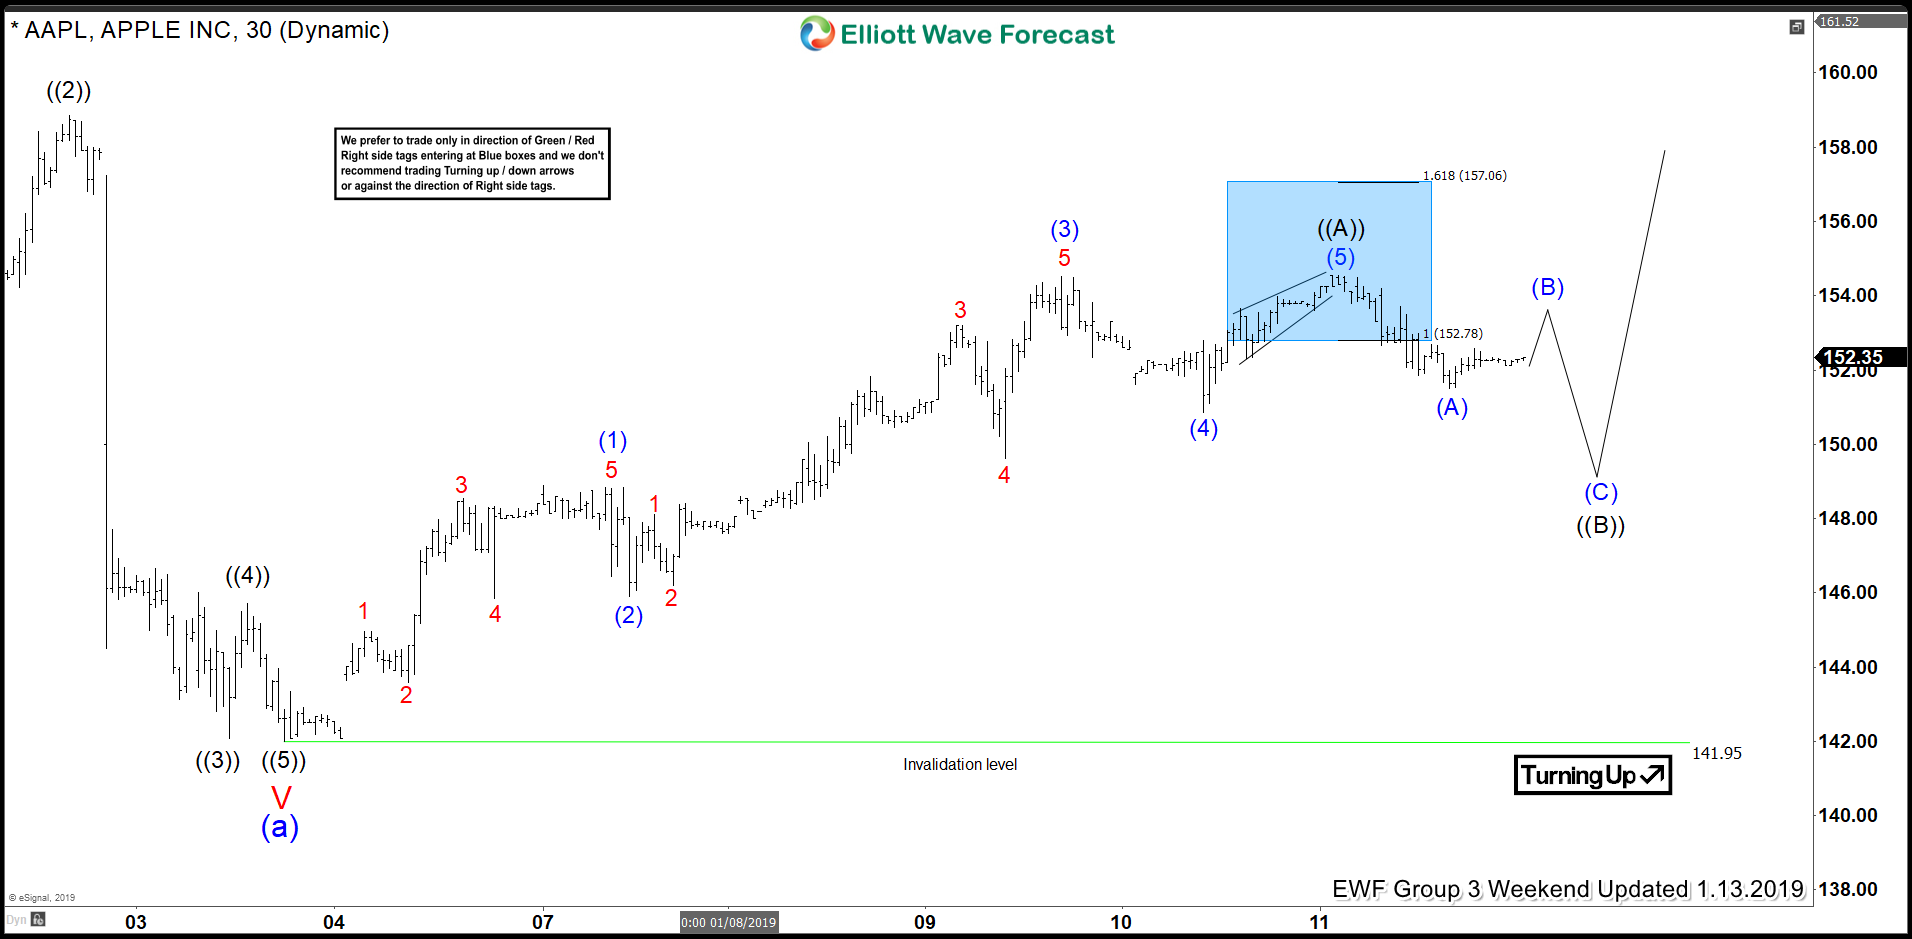
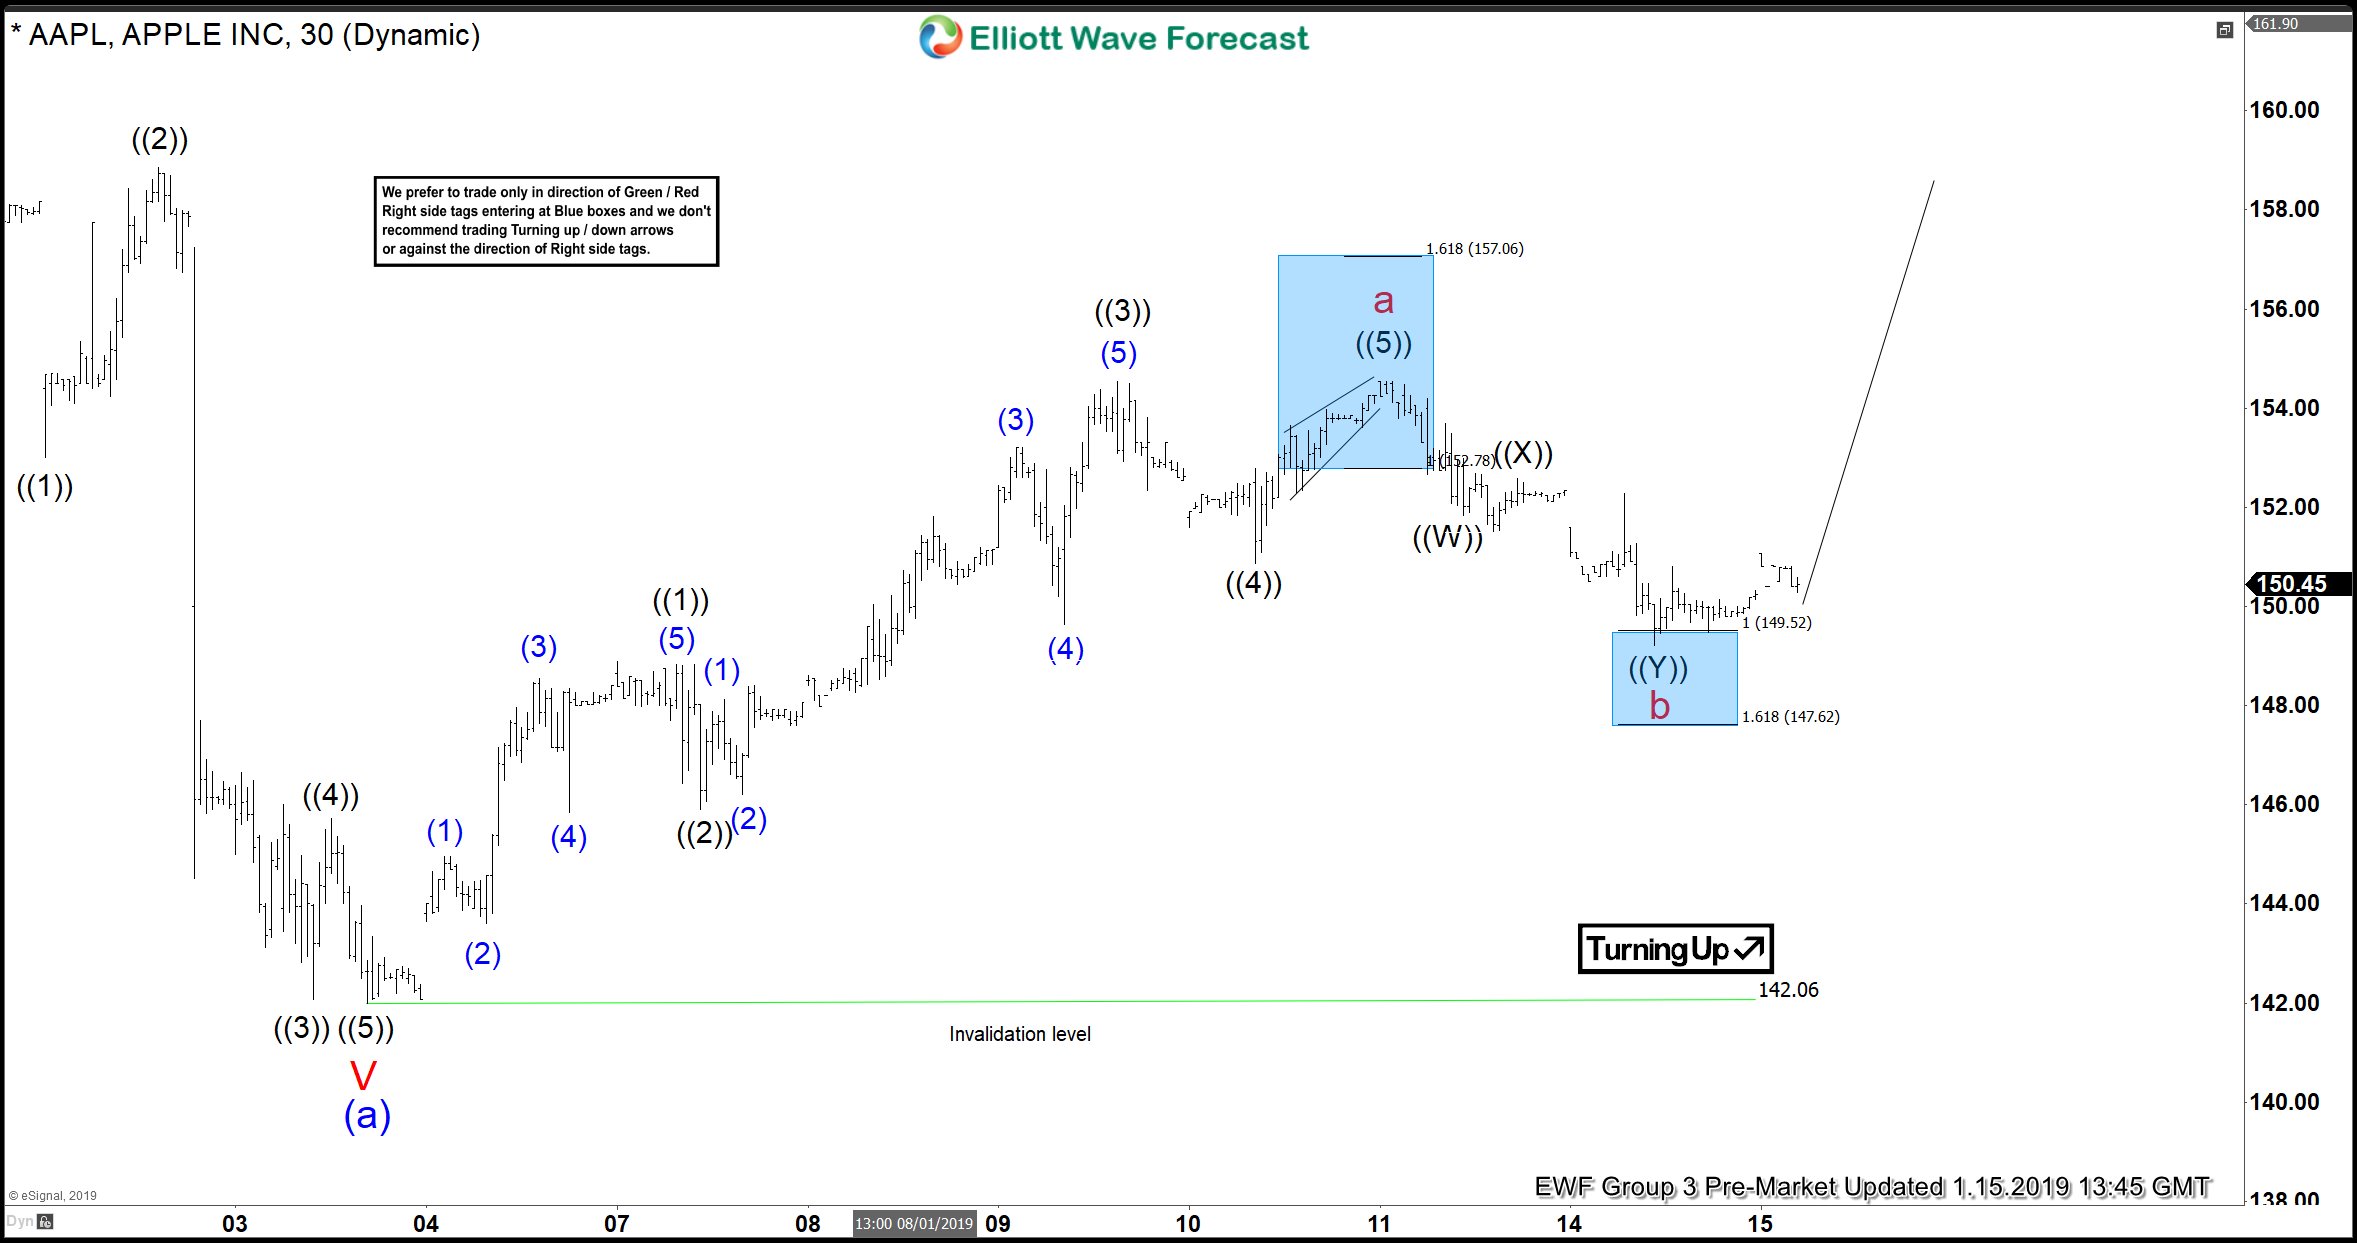
Above is the 1 Hour Elliott Wave Chart from 1/12/2019 Weekend update, in which the Apple stock ended the decline from 10/03/2018 peak at $142.06 low seen on 1/03/2019 in super cycle degree wave “(a)”. Up from there, the stock rallied higher in 5 waves structure thus suggested that the bounce higher will continue higher for another 5 waves structure at least in a zigzag pattern. Up from $142.06 low, the stock ended the 5 waves rally at $154.54 high in primary wave ((A)) and expected to make a 3 wave pullback before more upside is seen.
Apple 1 Hour Elliott Wave Chart From 1/15/2019

Apple 1 hour Elliott wave Chart from 1/15/2019 Pre-Market update, in which Apple made a 3 wave pullback in cycle degree wave “b” as double three structure where primary wave ((W)) ended at $151.84. Primary wave ((X)) ended at $152.59 and Primary wave ((Y)) ended at $149.22 low within cycle degree wave “b”. After reaching 100%-161.8% Fibonacci extension area of primary wave ((W))-((X)) at $149.52-147.62. Note that, we have adjusted the degree of the bounce slightly based on our distribution system.
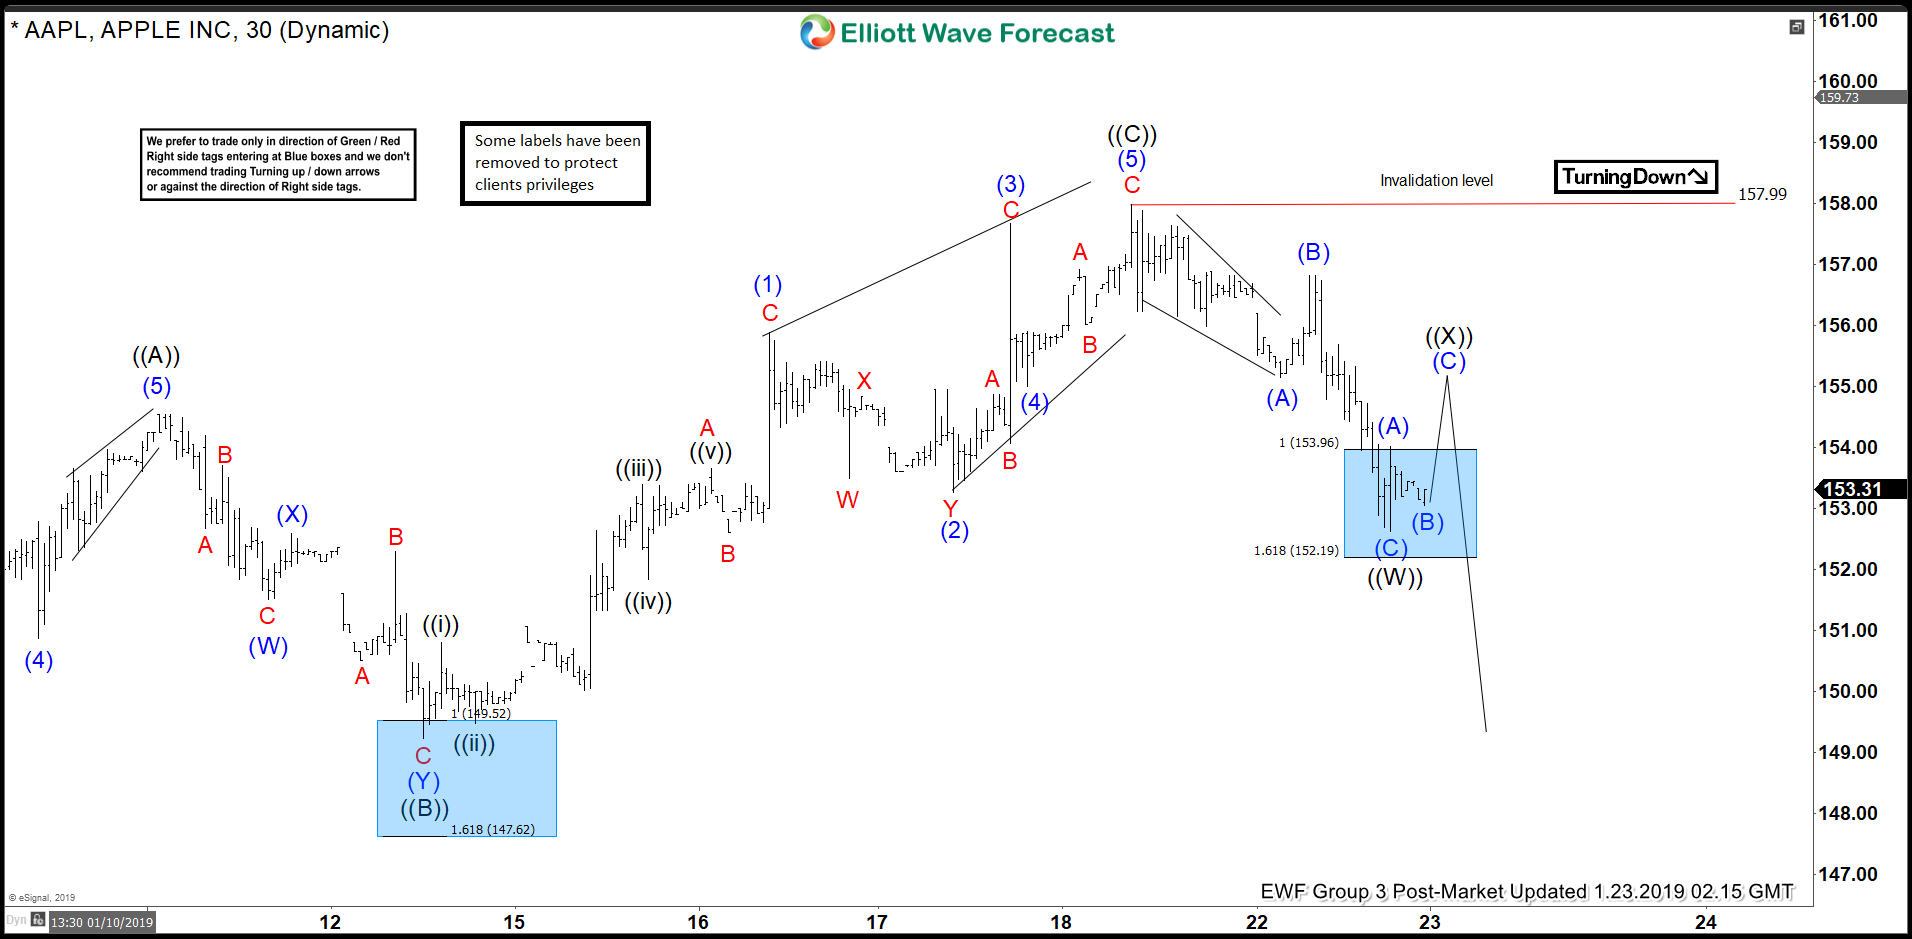
Apple 1 Hour Elliott Wave Chart From 1/23/2019

Apple 1 Hour Elliott wave Chart from 1/23/2019 Post-Market update, the stock showing the reaction higher took place from the blue box area as expected for another 5 waves rally. Note that, we have adjusted the degree of the bounce slightly back to primary degree cycle based on our distribution system but the overall structure remained the same. The stock has now completed the cycle from 1/03/2019 low as proposed zigzag structure where primary wave ((C)) is completed at $157.99 high.
Keep in mind that the market is dynamic and the view could change in the meantime. Success in trading requires proper risk and money management as well as an understanding of Elliott Wave theory, cycle analysis, and correlation. We have developed a very good trading strategy that defines the entry. Stop loss and take profit levels with high accuracy and allows you to take a risk-free position, shortly after taking it by protecting your wallet. If you want to learn all about it and become a professional trader.
Apple 1 Hour Elliott Wave Chart From 01/13/2019
Above is the 1 Hour Elliott Wave Chart from 1/12/2019 Weekend update, in which the Apple stock ended the decline from 10/03/2018 peak at $142.06 low seen on 1/03/2019 in super cycle degree wave “(a)”. Up from there, the stock rallied higher in 5 waves structure thus suggested that the bounce higher will continue higher for another 5 waves structure at least in a zigzag pattern. Up from $142.06 low, the stock ended the 5 waves rally at $154.54 high in primary wave ((A)) and expected to make a 3 wave pullback before more upside is seen.
Apple 1 Hour Elliott Wave Chart From 1/15/2019
Apple 1 hour Elliott wave Chart from 1/15/2019 Pre-Market update, in which Apple made a 3 wave pullback in cycle degree wave “b” as double three structure where primary wave ((W)) ended at $151.84. Primary wave ((X)) ended at $152.59 and Primary wave ((Y)) ended at $149.22 low within cycle degree wave “b”. After reaching 100%-161.8% Fibonacci extension area of primary wave ((W))-((X)) at $149.52-147.62. Note that, we have adjusted the degree of the bounce slightly based on our distribution system.
Apple 1 Hour Elliott Wave Chart From 1/23/2019
Apple 1 Hour Elliott wave Chart from 1/23/2019 Post-Market update, the stock showing the reaction higher took place from the blue box area as expected for another 5 waves rally. Note that, we have adjusted the degree of the bounce slightly back to primary degree cycle based on our distribution system but the overall structure remained the same. The stock has now completed the cycle from 1/03/2019 low as proposed zigzag structure where primary wave ((C)) is completed at $157.99 high.
Keep in mind that the market is dynamic and the view could change in the meantime. Success in trading requires proper risk and money management as well as an understanding of Elliott Wave theory, cycle analysis, and correlation. We have developed a very good trading strategy that defines the entry. Stop loss and take profit levels with high accuracy and allows you to take a risk-free position, shortly after taking it by protecting your wallet. If you want to learn all about it and become a professional trader.
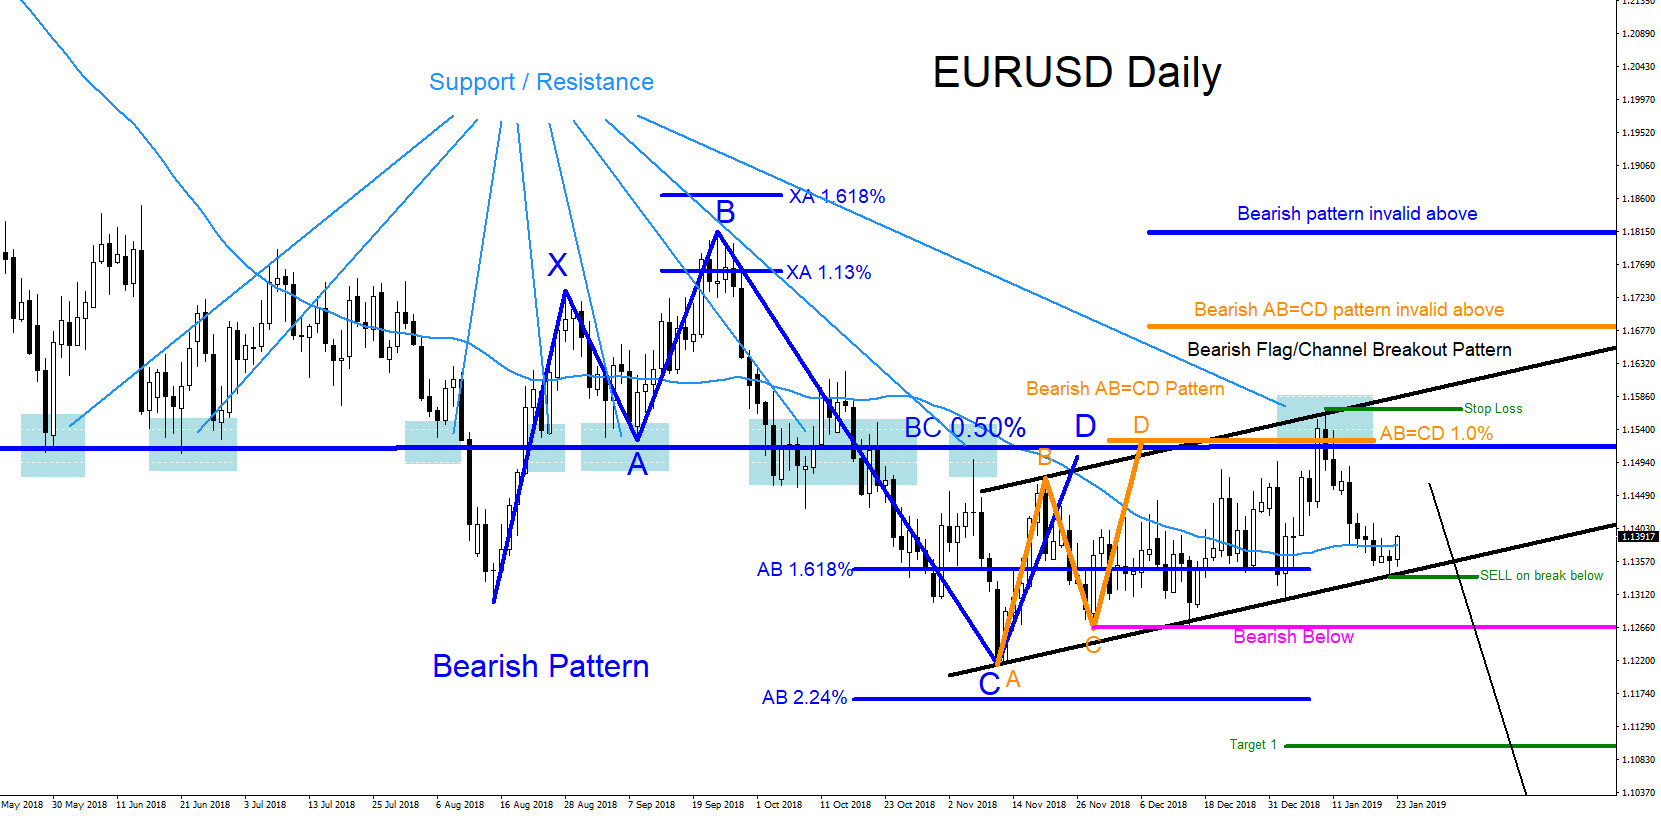
EURUSD Technical Analysis January 23/2019
EURUSD : Bearish market patterns can be seen on the Daily chart. In the chart below there are bearish patterns that have already triggered SELLS. The blue bearish pattern triggered SELLS at the BC 0.50% Fib. retracement level and the orange bearish AB=CD pattern also triggered SELLS near the BC 0.50% Fib. retracement level. Previous support/resistance price action in the past also contributed to the recent move lower from the January 10/2019 high. EURUSD can still make another rally higher above the January 10/2019 highs but because price is near the bottom trend line of the black bearish flag/channel breakout pattern traders will now need to watch if the pair decides to continue and break lower. Traders should wait and watch if the pair makes another small push higher then followed by a break lower below January 22/2019 lows where the black flag/channel pattern breakout triggers SELLS (Green SELL Entry). If looking to trade EURUSD stops should be placed at the January 10/2019 high and traders should be patient and wait for price to first break below January 22/2019 lows (Green SELL Entry). Waiting to SELL/SHORT at the green SELL breakout level will offer a better momentum trade lower and will confirm the January 10/2019 high will hold. A break below the November 28/2018 low (pink trend line) will confirm bears are in full control and the pair will extend lower looking to hit Target 1 minimum. Only time will tell what EURUSD will do but at least now you are aware of what to expect if the pair breaks lower.
EURUSD Daily Hour Chart 1.23.2019

Of course, like any strategy/technique, there will be times when the strategy/technique fails so proper money/risk management should always be used on every trade. Hope you enjoyed this article
v
EURUSD : Bearish market patterns can be seen on the Daily chart. In the chart below there are bearish patterns that have already triggered SELLS. The blue bearish pattern triggered SELLS at the BC 0.50% Fib. retracement level and the orange bearish AB=CD pattern also triggered SELLS near the BC 0.50% Fib. retracement level. Previous support/resistance price action in the past also contributed to the recent move lower from the January 10/2019 high. EURUSD can still make another rally higher above the January 10/2019 highs but because price is near the bottom trend line of the black bearish flag/channel breakout pattern traders will now need to watch if the pair decides to continue and break lower. Traders should wait and watch if the pair makes another small push higher then followed by a break lower below January 22/2019 lows where the black flag/channel pattern breakout triggers SELLS (Green SELL Entry). If looking to trade EURUSD stops should be placed at the January 10/2019 high and traders should be patient and wait for price to first break below January 22/2019 lows (Green SELL Entry). Waiting to SELL/SHORT at the green SELL breakout level will offer a better momentum trade lower and will confirm the January 10/2019 high will hold. A break below the November 28/2018 low (pink trend line) will confirm bears are in full control and the pair will extend lower looking to hit Target 1 minimum. Only time will tell what EURUSD will do but at least now you are aware of what to expect if the pair breaks lower.
EURUSD Daily Hour Chart 1.23.2019
Of course, like any strategy/technique, there will be times when the strategy/technique fails so proper money/risk management should always be used on every trade. Hope you enjoyed this article
v
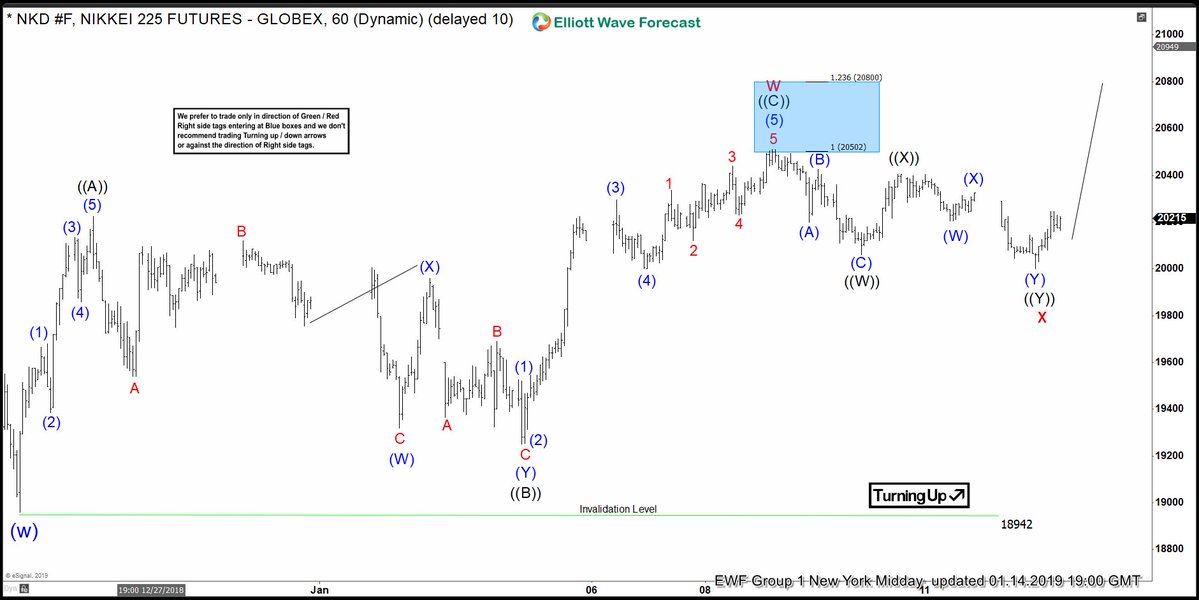
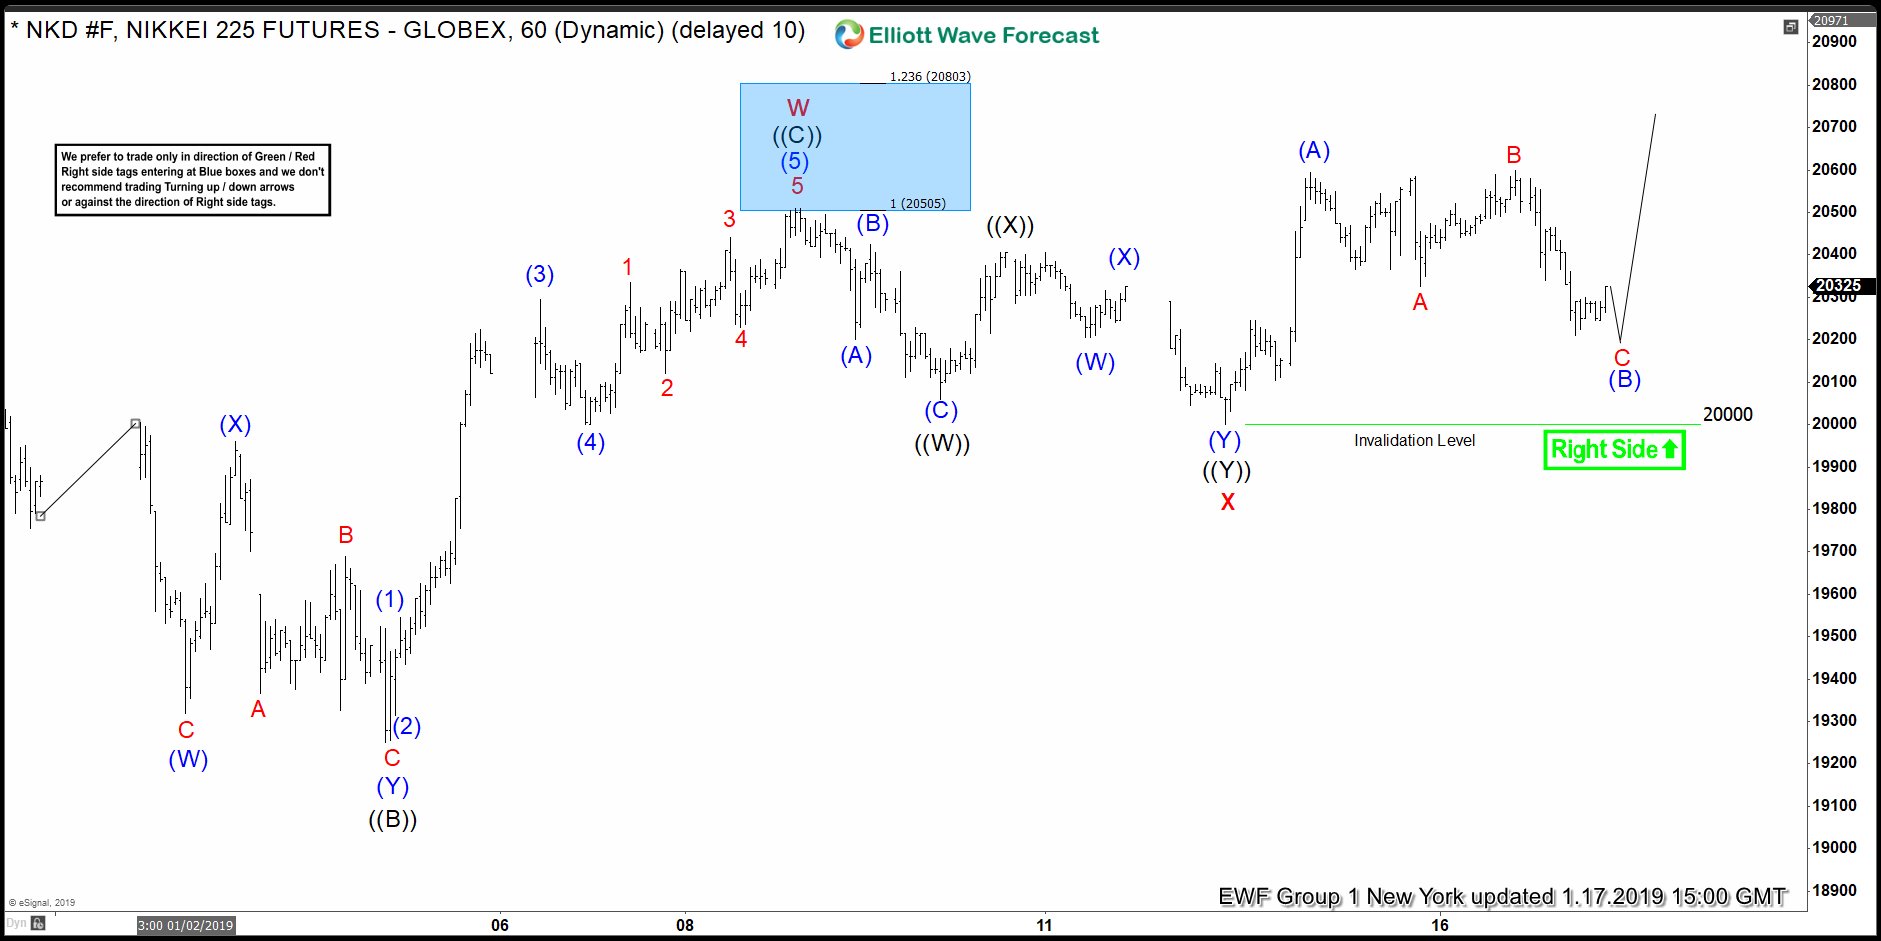
Welcome traders, today we look at a couple of 1 hour NIKKEI charts and its price action within 3 consecutive days. The following analysis will show how profitable and efficient it can be to trade with our philosophy and basic Elliott Wave analysis.
First of all, we start on January 14 where the right side of the market favored the upside. A 3 waves structure, ((A))-((B))-((C)), concluded a proposed wave ‘W’. Also, wave ‘W’ successfully reached our blue box target areas from which we always expect a reaction. The blue box target areas are derived by a 1:1 and 1:1.236 ratio of wave ((A)) projected from wave ((B)). Consequently, the reaction off of the blue box confirmed the idea of the cycle ending. The full 3 waves correction has an invalidation level of 18942 for further upside.
Under our methodology, every finished cycle that ends within our blue box target areas are followed by a corrective pullback. These corrective pullbacks should unfold in 3,7, or 11 swings before it continues its dominant trend. With this in mind, our count at the time suggested a pullback of a total of 7 swings had finished. This completed the pullback sequence and the index can resume the upside.
NIKKEI 1.14.2019 1 Hour Chart Elliott Wave Analysis

Below you will see an updated chart of the index two days after, January 16 2019. So, as expected, with a complete 7 swing pullback, the index was able to resume the dominant trend. Under our aggressive approach, our members are able to react to these situations. A combination of signals, like our invalidation level, blue box target areas, and “the right side of the market”, add up to great trading opportunities. From here, we wait, and repeat the process. Notice how we immediately provide an invalidation level and forecast the next move. We do not claim to be always right, but we do certainly have the odds on our favor.
NIKKEI 1.16.2019 1 Hour Chart Elliott Wave Analysis

*Note : Keep in mind the market is dynamic and the presented view might have changed after the post was published.
First of all, we start on January 14 where the right side of the market favored the upside. A 3 waves structure, ((A))-((B))-((C)), concluded a proposed wave ‘W’. Also, wave ‘W’ successfully reached our blue box target areas from which we always expect a reaction. The blue box target areas are derived by a 1:1 and 1:1.236 ratio of wave ((A)) projected from wave ((B)). Consequently, the reaction off of the blue box confirmed the idea of the cycle ending. The full 3 waves correction has an invalidation level of 18942 for further upside.
Under our methodology, every finished cycle that ends within our blue box target areas are followed by a corrective pullback. These corrective pullbacks should unfold in 3,7, or 11 swings before it continues its dominant trend. With this in mind, our count at the time suggested a pullback of a total of 7 swings had finished. This completed the pullback sequence and the index can resume the upside.
NIKKEI 1.14.2019 1 Hour Chart Elliott Wave Analysis
Below you will see an updated chart of the index two days after, January 16 2019. So, as expected, with a complete 7 swing pullback, the index was able to resume the dominant trend. Under our aggressive approach, our members are able to react to these situations. A combination of signals, like our invalidation level, blue box target areas, and “the right side of the market”, add up to great trading opportunities. From here, we wait, and repeat the process. Notice how we immediately provide an invalidation level and forecast the next move. We do not claim to be always right, but we do certainly have the odds on our favor.
NIKKEI 1.16.2019 1 Hour Chart Elliott Wave Analysis
*Note : Keep in mind the market is dynamic and the presented view might have changed after the post was published.
Elliott Wave view in Alibaba (Ticker: BABA) suggests the rally from 12/24/2018 low is unfolding as an impulse Elliott Wave structure where wave ((3)) ended at $159.49. Wave ((4)) pullback ended at $150.17 as a double three Elliott Wave structure. Down from $159.49, wave (W) of ((4)) ended at $154.20 and rally to $157.02 ended wave (X) of ((4)). Afterwards, decline to $150.17 ended wave (Y) of ((4)).
Near term, Rally from $150.17 low is currently unfolding as a 5 waves with a nest. Wave (1) of ((5)) ended at $155.18 and wave (2) of ((5)) ended at $150.51. Near term, while pullback stays above $150.17, expect Alibaba to extend higher within wave ((5)).
Alibaba still needs to break above wave ((3)) at $159.49 to confirm the wave ((5)) higher has started. Until then, it can do a double correction in wave ((4)) before the rally resumes. Alternatively, it can also already end 5 waves up from 12/24/2018 at $159.49. In that case, then the stock can start to correct cycle from 12/24/2018 low in 3, 7, or 11 swing.
It’s worth to keep in mind that in the larger time frame, we see a lower low sequence from June 5, 2018 high which technically favors more downside. In the most bearish case, Alibaba can already end the 5 waves move higher from 12/24/2018 low as internal of wave c Running Flat. In this scenario, the stock can start resuming lower again.
BABA 1 Hour Elliott Wave Chart

Last Friday Gold managed to break above $1300. The yellow metal has therefore broken above 8 year bearish channel in a weekly closing basis. The break also allows the metal to close back above the ascending trend support from Nov 30, 2015 low as the chart below shows.
GOLD BREAKS ABOVE LONG TERM BEARISH CHANNEL

Earlier this month, we highlighted the possibility that 2019 can be a good year for Gold. We identified several technical as well as fundamental factors which could support the yellow metal. For example, even though Gold has not done much against U.S Dollar, it has broken to all-time high against many emerging market currencies. In addition, it has also made a new all-time high against Australian Dollar earlier this year.
The break above $1300 last Friday likely paves the way for the yellow metal to retest last year’s peak at $1360.
Last week, Gold still had a chance to continue consolidation as far as it stays below $1300. However, we explained in the video that the larger time frame expects a move higher eventually. We also explained the potential that the move from 8/16/2018 low ($1160.37) becomes impulsive if it breaks above $1300. That’s what we had last Friday and thus, we now expect Gold to continue higher as 1 hour weekend chart update below shows.
1 HOUR GOLD WEEKEND ELLIOTT WAVE CHART

As above chart shows, the short term Elliott Wave structure in Gold now expects the metal to continue higher as far as pullback stays above 1/21/2019 low ($1276.26) in the first degree. The entire rally from 8/16/2018 low ($1160.63) thus becomes impulsive with a nest where the yellow metal now is ending wave 5 of (3).
Gold should now retest $1360 rather quickly, which is a very significant level that has been tested multiple times. A decisive break and close above the level suggests a potential move to $1700 as the next swing target.

Keep in mind that market is dynamic and the outlook may have changed since the writing time of the article.
GOLD BREAKS ABOVE LONG TERM BEARISH CHANNEL
Earlier this month, we highlighted the possibility that 2019 can be a good year for Gold. We identified several technical as well as fundamental factors which could support the yellow metal. For example, even though Gold has not done much against U.S Dollar, it has broken to all-time high against many emerging market currencies. In addition, it has also made a new all-time high against Australian Dollar earlier this year.
The break above $1300 last Friday likely paves the way for the yellow metal to retest last year’s peak at $1360.
Last week, Gold still had a chance to continue consolidation as far as it stays below $1300. However, we explained in the video that the larger time frame expects a move higher eventually. We also explained the potential that the move from 8/16/2018 low ($1160.37) becomes impulsive if it breaks above $1300. That’s what we had last Friday and thus, we now expect Gold to continue higher as 1 hour weekend chart update below shows.
1 HOUR GOLD WEEKEND ELLIOTT WAVE CHART
As above chart shows, the short term Elliott Wave structure in Gold now expects the metal to continue higher as far as pullback stays above 1/21/2019 low ($1276.26) in the first degree. The entire rally from 8/16/2018 low ($1160.63) thus becomes impulsive with a nest where the yellow metal now is ending wave 5 of (3).
Gold should now retest $1360 rather quickly, which is a very significant level that has been tested multiple times. A decisive break and close above the level suggests a potential move to $1700 as the next swing target.
Keep in mind that market is dynamic and the outlook may have changed since the writing time of the article.
Starbucks (NASDAQ: SBUX) is American coffeehouse chain and it’s also the 3rd largest fast food restaurant chain by number of locations around the world. The coffee giant boosted sales by the end of the 2018 and its revenue and earnings beat expectations for the second consecutive quarter.
2018 was a red year for the stock market, as the majority of stocks suffered an average 30% — 40% by the end of the year. However SBUX managed to close the year with a positive number +11% among few other stocks in the consumer discretionary sector.
The long term technical chart for SBUX using the Elliott Wave Theory is showing a clear bullish structure. It’s doing an impulsive 5 waves move in the Super Cycle from IPO and it entered in the 5th wave territory which is the last wave to the upside before a larger correction takes place. The minimum target for the 5 wave was already reached last year at $68 which represent the measurement of wave ((I)) = to wave ((V)) but the extended measured target 61.8% of a combined wave ((1))+((3)) comes at $87 isn’t yet met.
Starbucks SBUX Monthly Chart

Last year, SBUX provided a good buying opportunity during its wave ((IV)) pullback as the stock did a 7 swing correction (Double Three). It reached the measured target at the blue box area $49.6 — $46.7 from where it resumed the rally to new all time highs with the recent peak in November 2018. Therefore, the stock is expected to remain bullish as long it remain above June 2018 low $47.37.
In the short term, the stock will have 2 possible paths to take place: The aggressive bullish scenario at this stage is having wave II in place as the stock already did 3 swing pullback into blue box area $62.64 — $59.83 and it already started the move higher in wave III with a target to the upside at $81 — $95 area. The second scenario suggest that while the current bounce fail below November peak $68.9 then wave II is still in progress and it can do the double correction lower into 50% area $58 before buyers show up again to resume the rally or bounce in 3 waves at least.
Consequently, the technical picture for Starbucks remain bullish as the stock is aiming for new all time highs and leading the move higher along side few other stock against 2018 low.
Starbucks SBUX Daily Chart

2018 was a red year for the stock market, as the majority of stocks suffered an average 30% — 40% by the end of the year. However SBUX managed to close the year with a positive number +11% among few other stocks in the consumer discretionary sector.
The long term technical chart for SBUX using the Elliott Wave Theory is showing a clear bullish structure. It’s doing an impulsive 5 waves move in the Super Cycle from IPO and it entered in the 5th wave territory which is the last wave to the upside before a larger correction takes place. The minimum target for the 5 wave was already reached last year at $68 which represent the measurement of wave ((I)) = to wave ((V)) but the extended measured target 61.8% of a combined wave ((1))+((3)) comes at $87 isn’t yet met.
Starbucks SBUX Monthly Chart
Last year, SBUX provided a good buying opportunity during its wave ((IV)) pullback as the stock did a 7 swing correction (Double Three). It reached the measured target at the blue box area $49.6 — $46.7 from where it resumed the rally to new all time highs with the recent peak in November 2018. Therefore, the stock is expected to remain bullish as long it remain above June 2018 low $47.37.
In the short term, the stock will have 2 possible paths to take place: The aggressive bullish scenario at this stage is having wave II in place as the stock already did 3 swing pullback into blue box area $62.64 — $59.83 and it already started the move higher in wave III with a target to the upside at $81 — $95 area. The second scenario suggest that while the current bounce fail below November peak $68.9 then wave II is still in progress and it can do the double correction lower into 50% area $58 before buyers show up again to resume the rally or bounce in 3 waves at least.
Consequently, the technical picture for Starbucks remain bullish as the stock is aiming for new all time highs and leading the move higher along side few other stock against 2018 low.
Starbucks SBUX Daily Chart
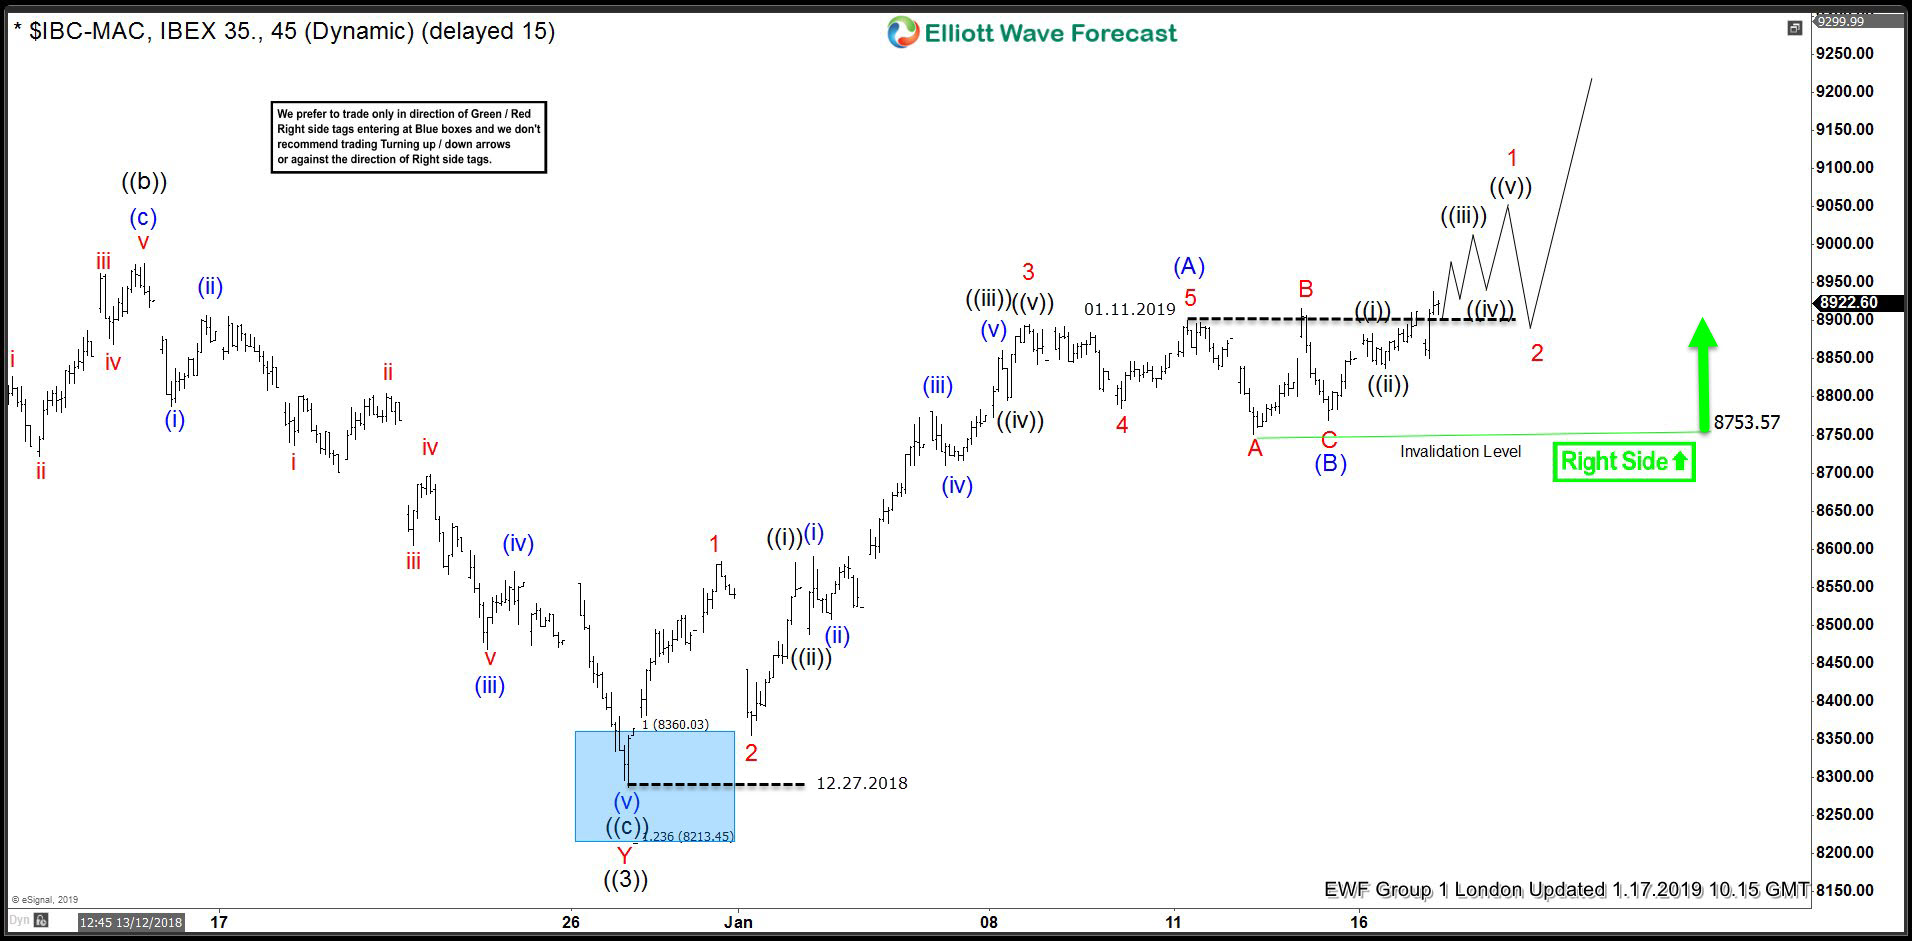
Hello fellow traders. In this technical blog we’re going to take a quick look at the Elliott Wave charts of IBEX, published in members area of the website. As our members know, IBEX has made recently incomplete bullish sequence in the cycle from the December 27th 2018 low. The Elliott wave structure had been calling for further upside in short term. Consequently, we advise members to avoid selling the Index until extremes from the 12.27 low gets reached. In further text we’re going to explain the Elliott wave structure and Forecast.
IBEX 1 Hour Elliott Wave Analysis 12.29.2018
As we can see on the chart below , the Index has 5 waves structure in the rally from the 12.27 low, when pull back against that low has unfolded as a Elliott Wave Running Flat- wave (B) blue. Cycle from the December's low is labeled as Elliott Wave ZIGZAG pattern. Break of January 11th peak made the cycle from the December 27th 2018 low incomplete to the upside. The Index is now bullish against the 8753.5 low and we’re calling for further strength . The Index has scope to reach 9368.4 area before sellers appear gain. We don’t recommend selling the index at this stage and favor the long side against the 8753.5 low.

IBEX 1 Hour Elliott Wave Analysis 1.26.2019.
The price has held pivot at 8752.3 low nicely so far, and IBEX is trading higher as expected. As far as the mentioned pivot stays intact, the index can remain trading higher toward 9368.4 area, when we're still in wave ((iii)) of C of proposed Elliottwave ZIGZAG pattern.
Keep in mind market is dynamic and presented view could have changed in the mean time. Best instruments to trade are those having incomplete bullish or bearish swings sequences. We put them in Sequence Report and best among them are shown in the Live Trading Room. You can check most recent charts in the membership area of the site.

IBEX 1 Hour Elliott Wave Analysis 12.29.2018
As we can see on the chart below , the Index has 5 waves structure in the rally from the 12.27 low, when pull back against that low has unfolded as a Elliott Wave Running Flat- wave (B) blue. Cycle from the December's low is labeled as Elliott Wave ZIGZAG pattern. Break of January 11th peak made the cycle from the December 27th 2018 low incomplete to the upside. The Index is now bullish against the 8753.5 low and we’re calling for further strength . The Index has scope to reach 9368.4 area before sellers appear gain. We don’t recommend selling the index at this stage and favor the long side against the 8753.5 low.
IBEX 1 Hour Elliott Wave Analysis 1.26.2019.
The price has held pivot at 8752.3 low nicely so far, and IBEX is trading higher as expected. As far as the mentioned pivot stays intact, the index can remain trading higher toward 9368.4 area, when we're still in wave ((iii)) of C of proposed Elliottwave ZIGZAG pattern.
Keep in mind market is dynamic and presented view could have changed in the mean time. Best instruments to trade are those having incomplete bullish or bearish swings sequences. We put them in Sequence Report and best among them are shown in the Live Trading Room. You can check most recent charts in the membership area of the site.
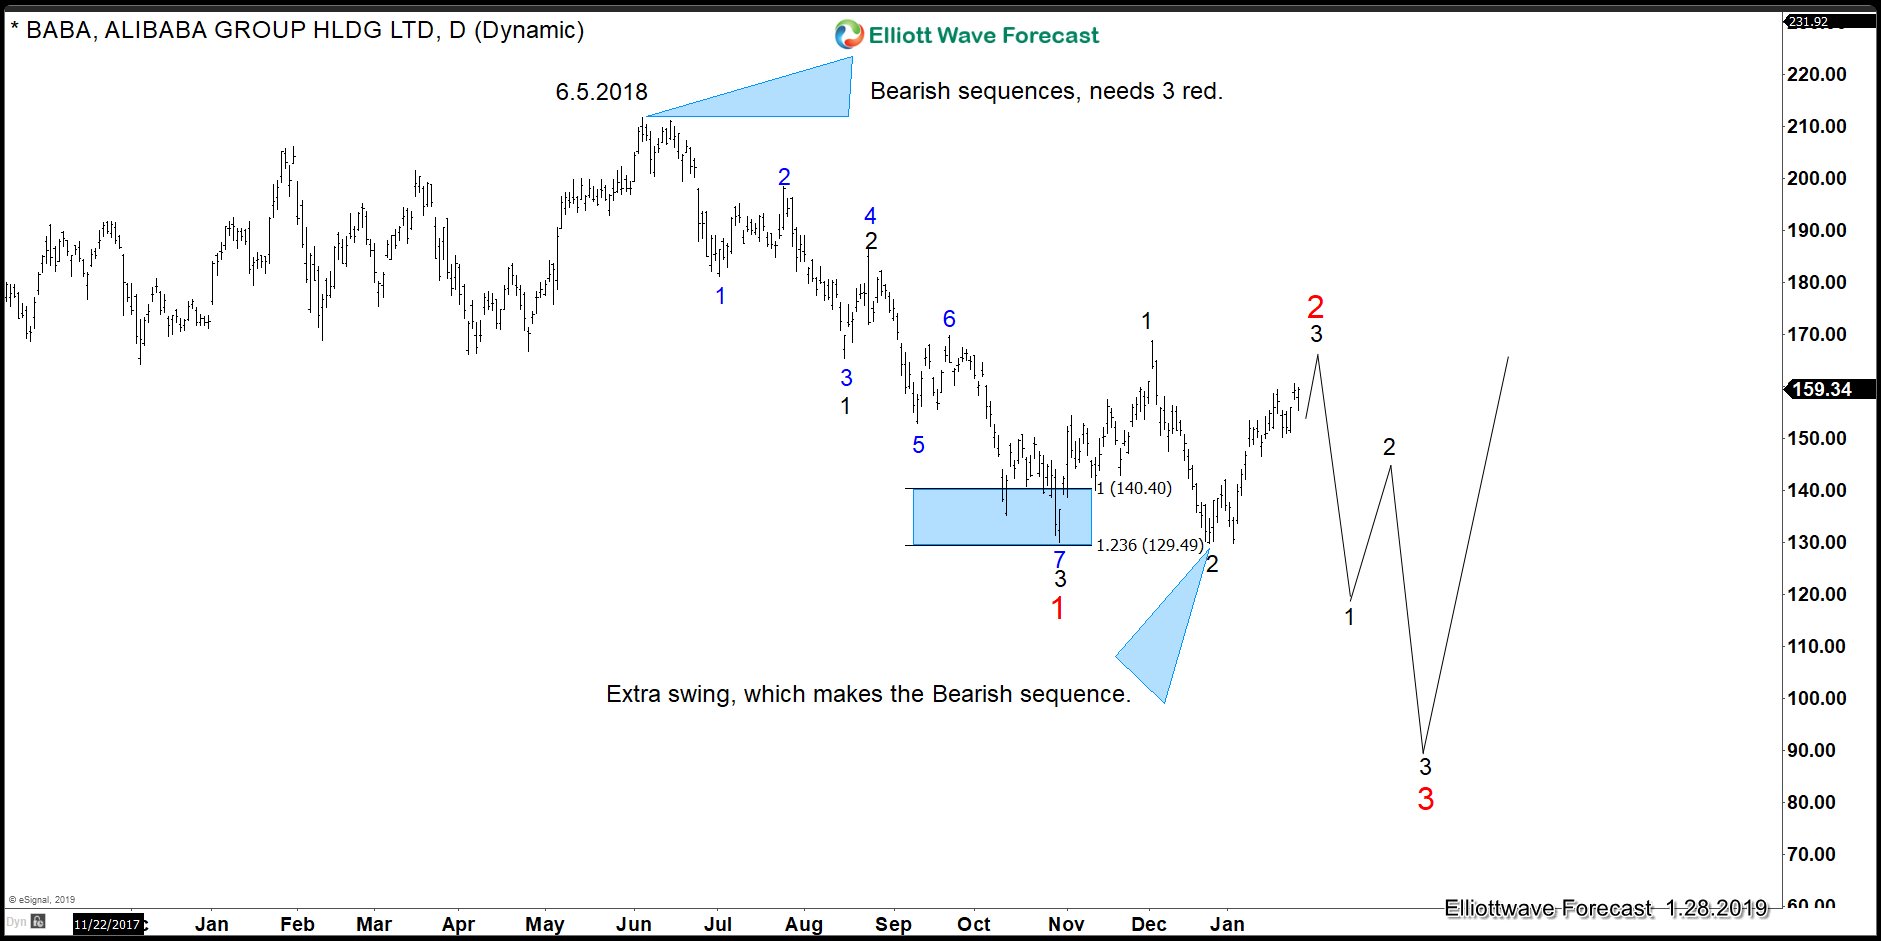
We believe Alibaba will see more downside based on a sequence which started on 6.5.2018 high. It is showing an extra swing at 12.24.2018. This low can be counted as swing number 9 in Blue or beginning of the swing 1 Black of 3 red. The chart below shows the extra swing.

Alibaba should remain under pressure and see more downside when the cycle or structure which started at 10.30.2018 low ends. At Elliottwave-Forecast, we pay attention to the sequence and correlation across the market. We use Elliott wave to spot the structure and then take a side and forecast the higher probability outcome. We believe the Stock is doing an Elliott wave Running Flat since the low at 10.30.2018. The Flat is very clear due to the strength and nature of the reaction in 5 waves from the low at 12.24.2018. We can count the move higher a 5 waves impulse advance.
Running Flat is a structure with the following guidelines:
• A corrective 3 wave move labelled as ABC
• Subdivision of wave A and B is in 3 waves
• Internal of wave C is in 5 waves impulse / diagonal
• Subdivision of wave A and B can be in any corrective 3 waves structure including zigzag, flat, double three, triple three
• Wave B of the 3-3-5 pattern terminates beyond the starting level of wave A as in an expanded flat
• Wave C fails travel the full distance, falling short of the level where wave A ended
• Momentum divergence should appear in wave C
The running Flat should follow this Fibonacci ratio relationship
• Wave B = 123.6% of wave A
• Wave C = 61.8% – 100% of wave AB
The following chart reflects how a running flat looks like in the Elliott Wave theory.

BABA 4 Hour Elliott Wave Analysis

The chart above is showing a clear Elliott wave structure. In finding a structure that fits the price action since the lows at 10.30.2018 and at the same time relates well with other instrument, we can conclude that a running flat is the most aggressive view.
Alibaba should remain under pressure and see more downside when the cycle or structure which started at 10.30.2018 low ends. At Elliottwave-Forecast, we pay attention to the sequence and correlation across the market. We use Elliott wave to spot the structure and then take a side and forecast the higher probability outcome. We believe the Stock is doing an Elliott wave Running Flat since the low at 10.30.2018. The Flat is very clear due to the strength and nature of the reaction in 5 waves from the low at 12.24.2018. We can count the move higher a 5 waves impulse advance.
Running Flat is a structure with the following guidelines:
• A corrective 3 wave move labelled as ABC
• Subdivision of wave A and B is in 3 waves
• Internal of wave C is in 5 waves impulse / diagonal
• Subdivision of wave A and B can be in any corrective 3 waves structure including zigzag, flat, double three, triple three
• Wave B of the 3-3-5 pattern terminates beyond the starting level of wave A as in an expanded flat
• Wave C fails travel the full distance, falling short of the level where wave A ended
• Momentum divergence should appear in wave C
The running Flat should follow this Fibonacci ratio relationship
• Wave B = 123.6% of wave A
• Wave C = 61.8% – 100% of wave AB
The following chart reflects how a running flat looks like in the Elliott Wave theory.
BABA 4 Hour Elliott Wave Analysis
The chart above is showing a clear Elliott wave structure. In finding a structure that fits the price action since the lows at 10.30.2018 and at the same time relates well with other instrument, we can conclude that a running flat is the most aggressive view.
Elliott Wave view in Tesla (Ticker: TSLA) suggests the rally to $352.09 ended wave ((2)). This suggests the stock is in an impulsive Elliott Wave structure to the downside. Wave ((3)) is in progress and the subdivision unfolded also as a 5 waves Elliott Wave impulse of lesser degree. Down from $352.09, wave 1 ended at $343.8 and wave 2 ended at $351.5. Wave 3 ended at $281.69, wave 4 ended at $290.61, and wave 5 of ended at $279.28.
The entire move lower from $352.09 to $279.28 ended wave (1) of ((3)). Tesla is now correcting the decline from $352.09 in wave (2). The correction looks to be unfolding as a double three Elliott Wave structure. Up from $279.28, wave W ended at $298.52 and wave X ended at $287.75. The stock has scope to extend higher towards $307.16 - $319.21 area to end wave Y of (2). Afterwards, it should extend to the next leg lower or at least pullback in 3 waves. As far as pivot at $352.09 stays intact during the correction, we expect the rally in Tesla to fail and the stock to extend to the downside.
Tesla 1 Hour Elliott Wave Chart

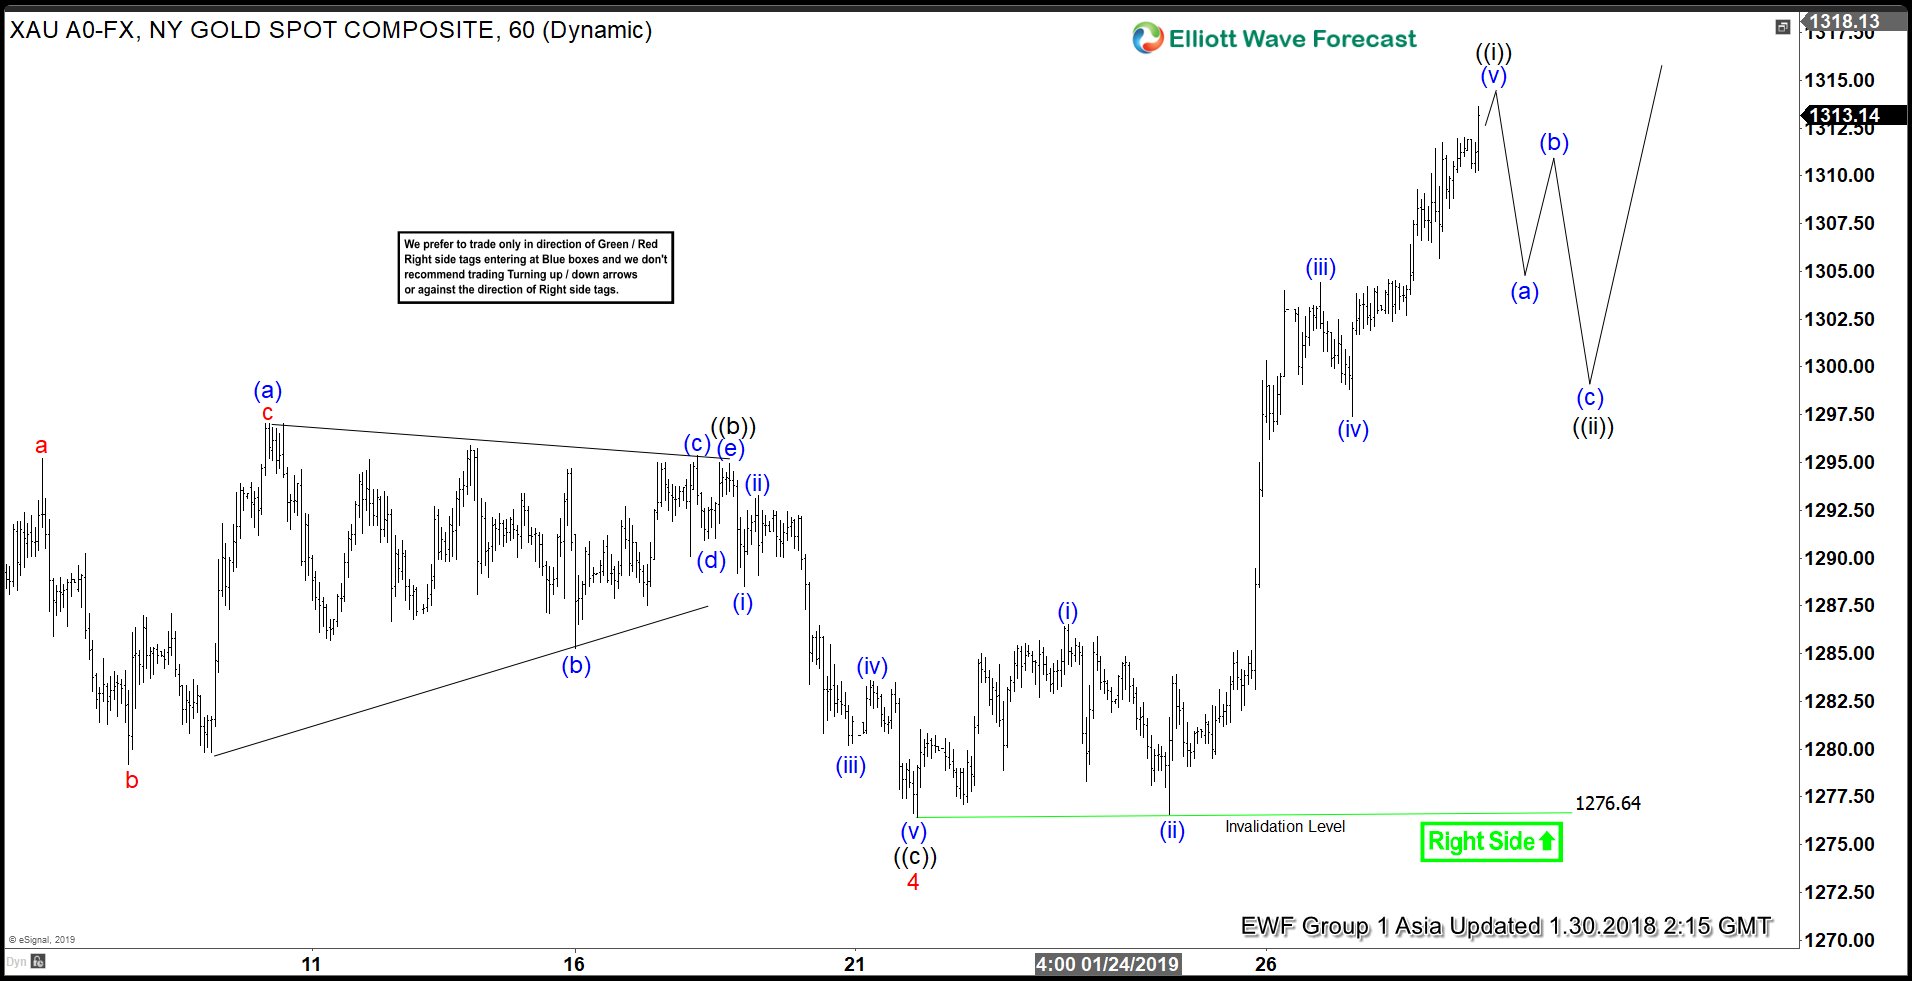
Elliott Wave view in Gold suggests the pullback to $1276.64 ended wave 4. Internal of wave 4 unfolded as a zigzag Elliott Wave structure. Wave ((a)) of 4 ended at $1276, wave ((b)) of 4 ended at $1295, and wave ((c)) of 4 ended at $1276.64. Rally from there looks impulsive and expected to end wave ((i)) soon as a 5 waves impulse Elliott Wave structure. Up from $1276.64, wave (i) ended at $1286.53, wave (ii) ended at $1276.59, wave (iii) ended at 1304.41, and wave (iv) ended at $1297.40.
Expect the yellow metal to end wave (v) soon and thus end wave ((i)) of larger degree. Afterwards, it should pullback in wave ((ii)) to correct the rally from January 21 low ($1276.64) before the rally resumes. The pullback should unfold in the sequence of 3, 7, or 11 swing. As far as pivot at $1276.64 low stays intact in the pullback, expect Gold to extend higher. As an alternate, the 5 waves move higher can end wave 5 of (3) instead of wave ((i)) of 5. In this alternate scenario, Gold should pullback in wave (4) to correct cycle from September 28, 2018 low ($1180.86) before the rally resumes.. Either way, expect pullback in the yellow metal to continue finding support for more upside.
Gold 1 Hour Elliott Wave Chart
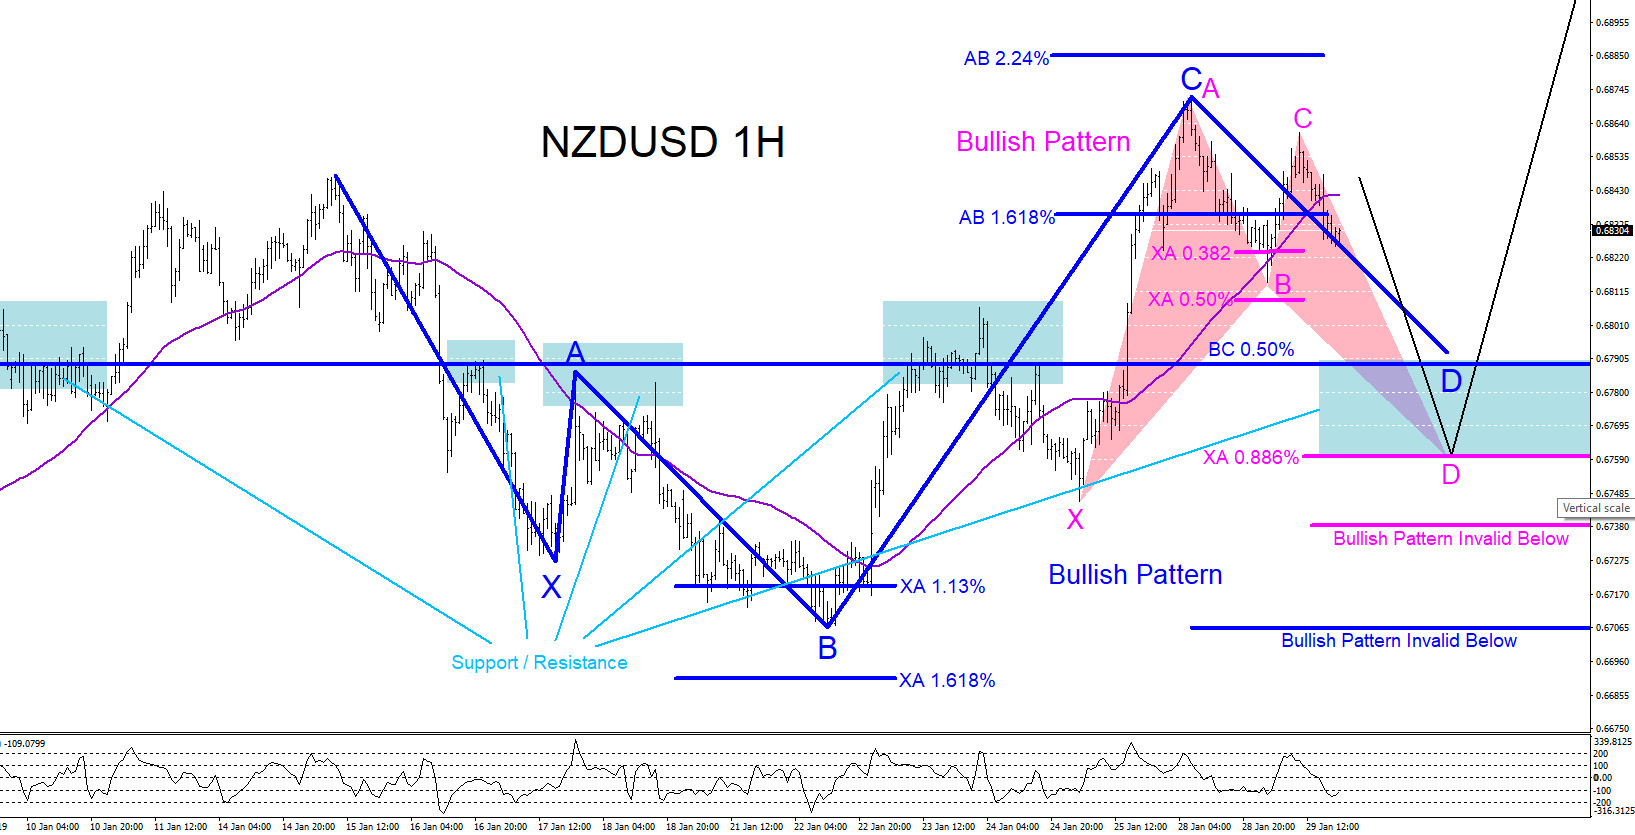
NZDUSD Technical Analysis January 29/2019
NZDUSD remains bullish as long as the January 22/2019 low remains untouched. If you read the article, NZDUSD : Possible Bullish Patterns, published on December 19/2018 you will already know that we are only looking to BUY/LONG kiwi dollar. If you missed that move higher then there is another opportunity to BUY the pair on the 1 hour chart where there are clear visible bullish patterns that can be seen. In the chart below, market patterns are used to determine where price can possibly reverse and bounce higher. The first bullish pattern (blue) triggers BUYS at the BC 0.50% Fib. retracement level and if NZDUSD extends lower it will be met by the second bullish pattern (pink) which triggers BUYS at the XA 0.886% Fib. retracement level. Traders should watch these two levels in the reversal zone (blue box) for a possible reaction bounce higher because there has been previous support/resistance price action in the past. Blue bullish pattern invalidates if price breaks below the point B low and the pink bullish pattern invalidates if price moves below the point X low. Traders will need to wait and watch how price reacts at the possible reversal/support zone (blue box) and see if the market reacts higher to any of these bullish patterns. If looking to trade NZDUSD stops should be placed at the point B low of the blue bullish pattern or for tighter stops at the point X low of the pink bullish pattern looking for a bounce/rally higher to extend above the January 28/2019 highs. Only time will tell what NZDUSD will do but at least now you are aware of the possible area where Kiwi can bounce from.
NZDUSD 1 Hour Chart 1.29.2019

Of course, like any strategy/technique, there will be times when the strategy/technique fails so proper money/risk management should always be used on every trade.
NZDUSD remains bullish as long as the January 22/2019 low remains untouched. If you read the article, NZDUSD : Possible Bullish Patterns, published on December 19/2018 you will already know that we are only looking to BUY/LONG kiwi dollar. If you missed that move higher then there is another opportunity to BUY the pair on the 1 hour chart where there are clear visible bullish patterns that can be seen. In the chart below, market patterns are used to determine where price can possibly reverse and bounce higher. The first bullish pattern (blue) triggers BUYS at the BC 0.50% Fib. retracement level and if NZDUSD extends lower it will be met by the second bullish pattern (pink) which triggers BUYS at the XA 0.886% Fib. retracement level. Traders should watch these two levels in the reversal zone (blue box) for a possible reaction bounce higher because there has been previous support/resistance price action in the past. Blue bullish pattern invalidates if price breaks below the point B low and the pink bullish pattern invalidates if price moves below the point X low. Traders will need to wait and watch how price reacts at the possible reversal/support zone (blue box) and see if the market reacts higher to any of these bullish patterns. If looking to trade NZDUSD stops should be placed at the point B low of the blue bullish pattern or for tighter stops at the point X low of the pink bullish pattern looking for a bounce/rally higher to extend above the January 28/2019 highs. Only time will tell what NZDUSD will do but at least now you are aware of the possible area where Kiwi can bounce from.
NZDUSD 1 Hour Chart 1.29.2019
Of course, like any strategy/technique, there will be times when the strategy/technique fails so proper money/risk management should always be used on every trade.
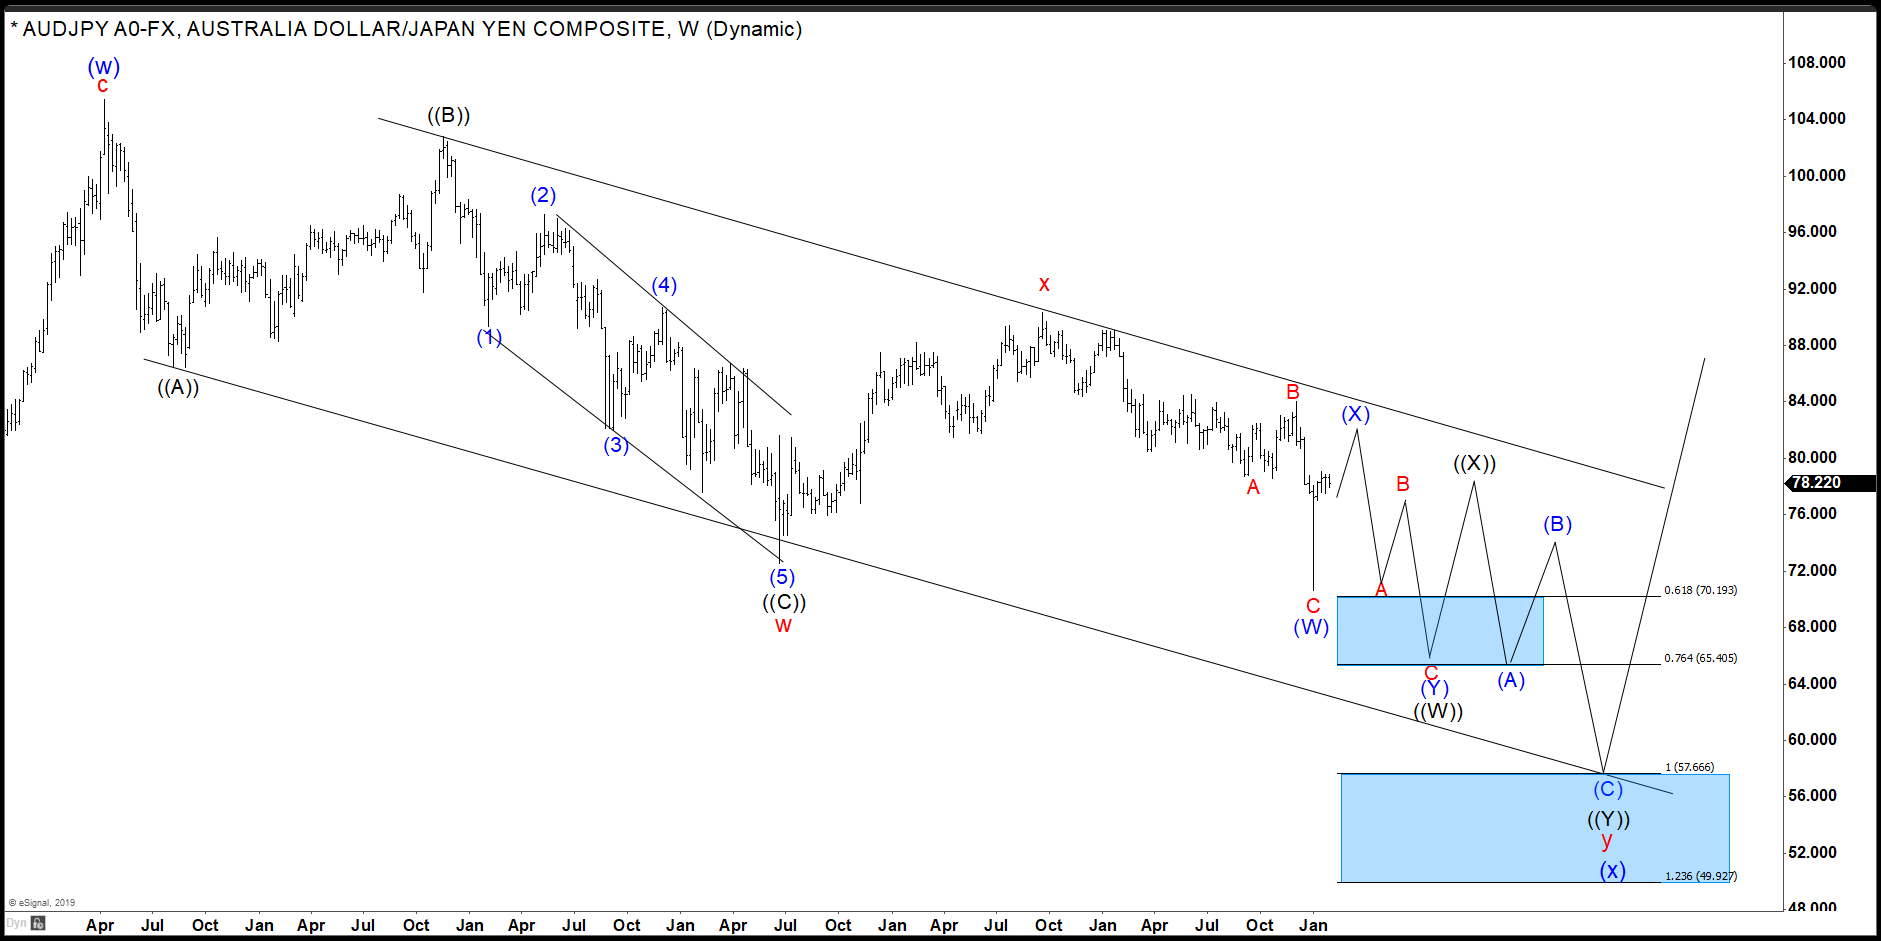
Over the next few weeks Japanese Yen strength should drive prices of AUDJPY lower within a downward sloping channel. The current incomplete Elliott Wave structure also supports this expectation of further downside.
In this article we’ll explore the basics of the current wave structure and its parallel channel. This combined analysis charts a great area to look for AUDJPY to bottom in a measured area. Traders can use this projection to go long the Australian Dollar vs the Japanese Yen.
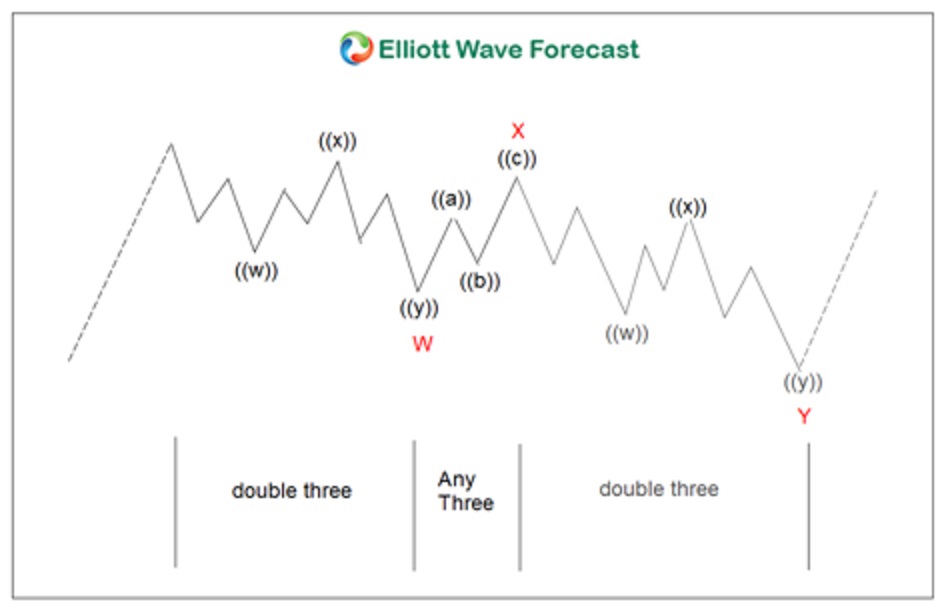
The Model of the Double-Three Elliott Wave Corrective Structure
 Generic View of a Double-Three Correction[
The picture above depicts a typical model of a combination corrective pattern known as a “double-three correction” labeled (W-X-Y). Double-three corrective patterns comprise of two corrective patterns in the same direction separated by one corrective pattern in the opposite direction. The first corrective pattern labels as W, the second Y. The corrective pattern in the opposite direction labels as X.
The Channeling and Measured Moves of Corrective Waves
It is often an observation and even an expectation that the corrective price action in any financial instrument will oscillate within a parallel channel. In the chart below for AUDJPY we observe this very phenomenon. These channels can also help traders target an end to the overall structure.
Another simple yet invaluable tool employed by EWF analysts to target the end of corrections involve what are known as “Measured Moves” or “Equal Legs”. These observations are nothing more than symmetrical measurements in the larger degree corrective wave labels. I.E. 1:1 measured moves between the two corrective waves that move in the same direction.
For instance, in the AUDJPY chart, look at the larger blue-highlight area at the bottom of the chart. This area simply represents the measurement of equality (1:1) between the origin of the entire correction [at the point with blue ([URL deleted] W ) to the bottom of red wave w and projecting that measurement from the top of the red wave x. This measurement gives AUDJPY technical traders a target for the bottom of not only wave y, but the entire corrective sequence from the structure's origin.
Weekly Bar Chart of the Channeled Double-Three Corrective Sequence for AUDJPY
 AUD/JPY Downward Channel Double-Three Correction
Confidence is high that AUDJPY is headed for further swing declines in the intermediate term toward the measured level near 57.70. Shorter-term traders should look for selling opportunities to exploit this expected downside target.
Certainly the analysis above suggests positional traders prepare to go long in the blue area. This area highlights an intersection between the measurement of equality and parallel channel line bottom. Since the price action to the downside is overall corrective in nature the upside will be tremendous. Furthermore the upside target is tremendous if the 57.70 area triggers the long. The minimum objective lies above 100.00.
To Your Success,
James
EWF Analytical Team
In this article we’ll explore the basics of the current wave structure and its parallel channel. This combined analysis charts a great area to look for AUDJPY to bottom in a measured area. Traders can use this projection to go long the Australian Dollar vs the Japanese Yen.
The Model of the Double-Three Elliott Wave Corrective Structure
 Generic View of a Double-Three Correction[
The picture above depicts a typical model of a combination corrective pattern known as a “double-three correction” labeled (W-X-Y). Double-three corrective patterns comprise of two corrective patterns in the same direction separated by one corrective pattern in the opposite direction. The first corrective pattern labels as W, the second Y. The corrective pattern in the opposite direction labels as X.
The Channeling and Measured Moves of Corrective Waves
It is often an observation and even an expectation that the corrective price action in any financial instrument will oscillate within a parallel channel. In the chart below for AUDJPY we observe this very phenomenon. These channels can also help traders target an end to the overall structure.
Another simple yet invaluable tool employed by EWF analysts to target the end of corrections involve what are known as “Measured Moves” or “Equal Legs”. These observations are nothing more than symmetrical measurements in the larger degree corrective wave labels. I.E. 1:1 measured moves between the two corrective waves that move in the same direction.
For instance, in the AUDJPY chart, look at the larger blue-highlight area at the bottom of the chart. This area simply represents the measurement of equality (1:1) between the origin of the entire correction [at the point with blue ([URL deleted] W ) to the bottom of red wave w and projecting that measurement from the top of the red wave x. This measurement gives AUDJPY technical traders a target for the bottom of not only wave y, but the entire corrective sequence from the structure's origin.
Weekly Bar Chart of the Channeled Double-Three Corrective Sequence for AUDJPY
 AUD/JPY Downward Channel Double-Three Correction
Confidence is high that AUDJPY is headed for further swing declines in the intermediate term toward the measured level near 57.70. Shorter-term traders should look for selling opportunities to exploit this expected downside target.
Certainly the analysis above suggests positional traders prepare to go long in the blue area. This area highlights an intersection between the measurement of equality and parallel channel line bottom. Since the price action to the downside is overall corrective in nature the upside will be tremendous. Furthermore the upside target is tremendous if the 57.70 area triggers the long. The minimum objective lies above 100.00.
To Your Success,
James
EWF Analytical Team
Last edited by a moderator:
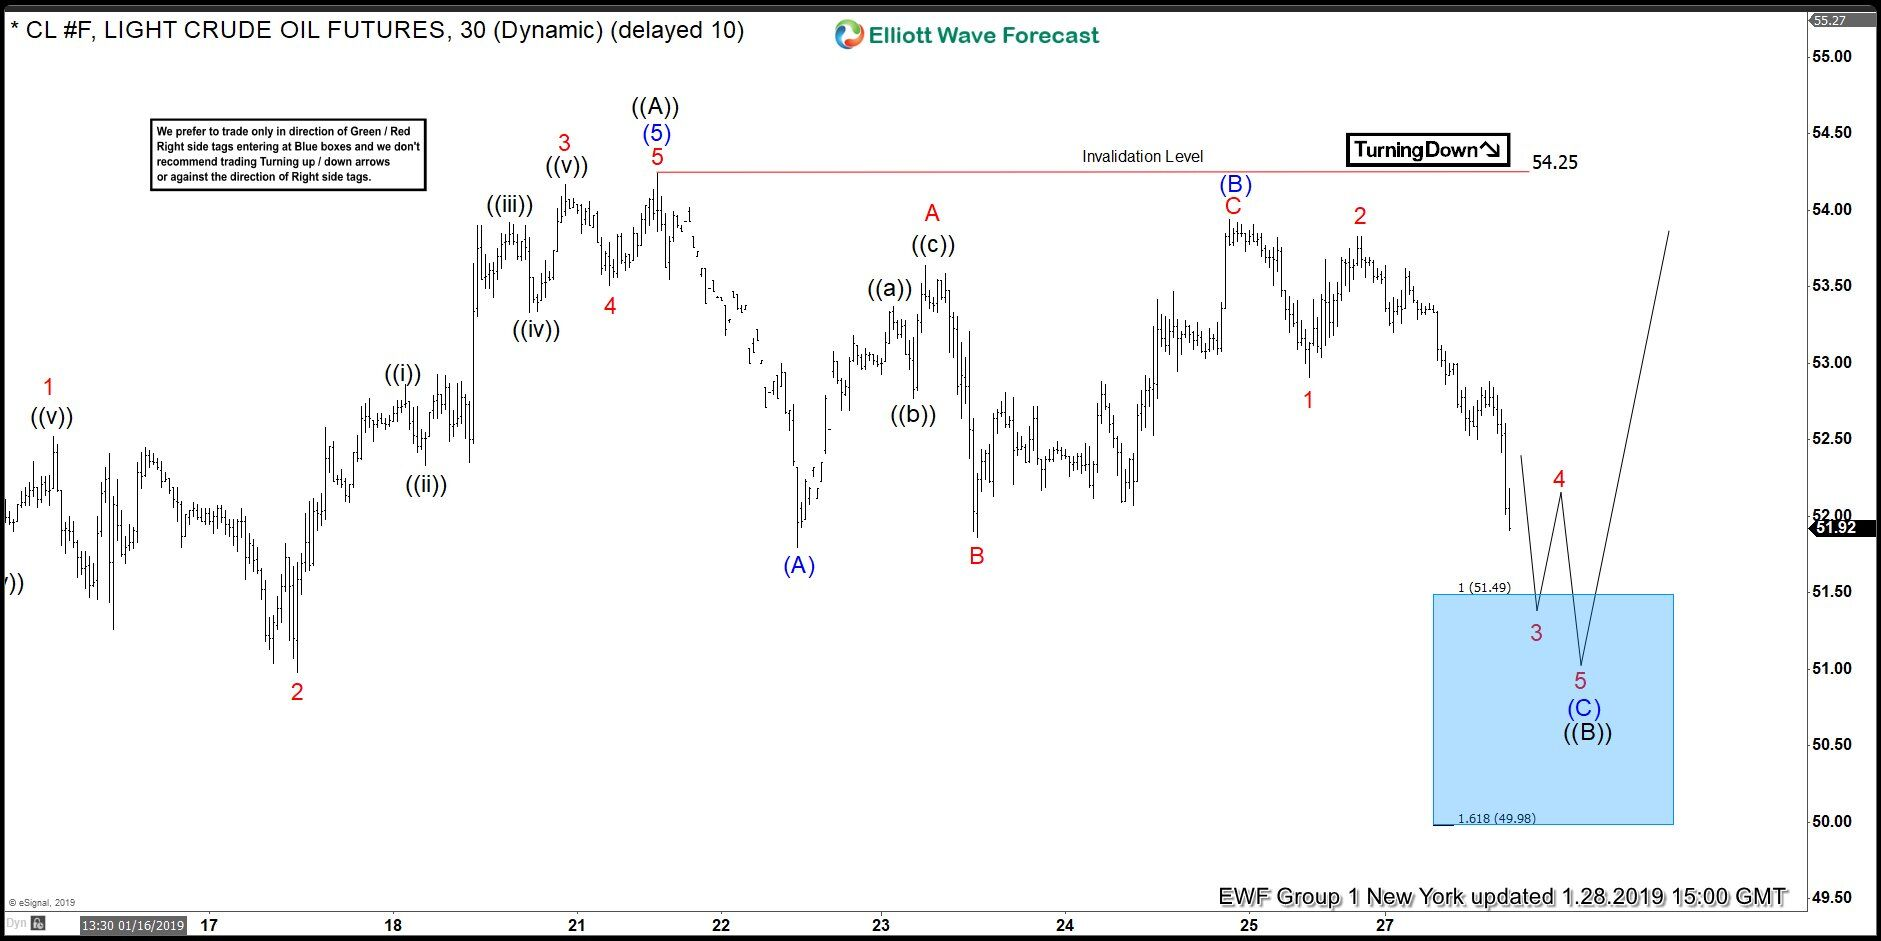
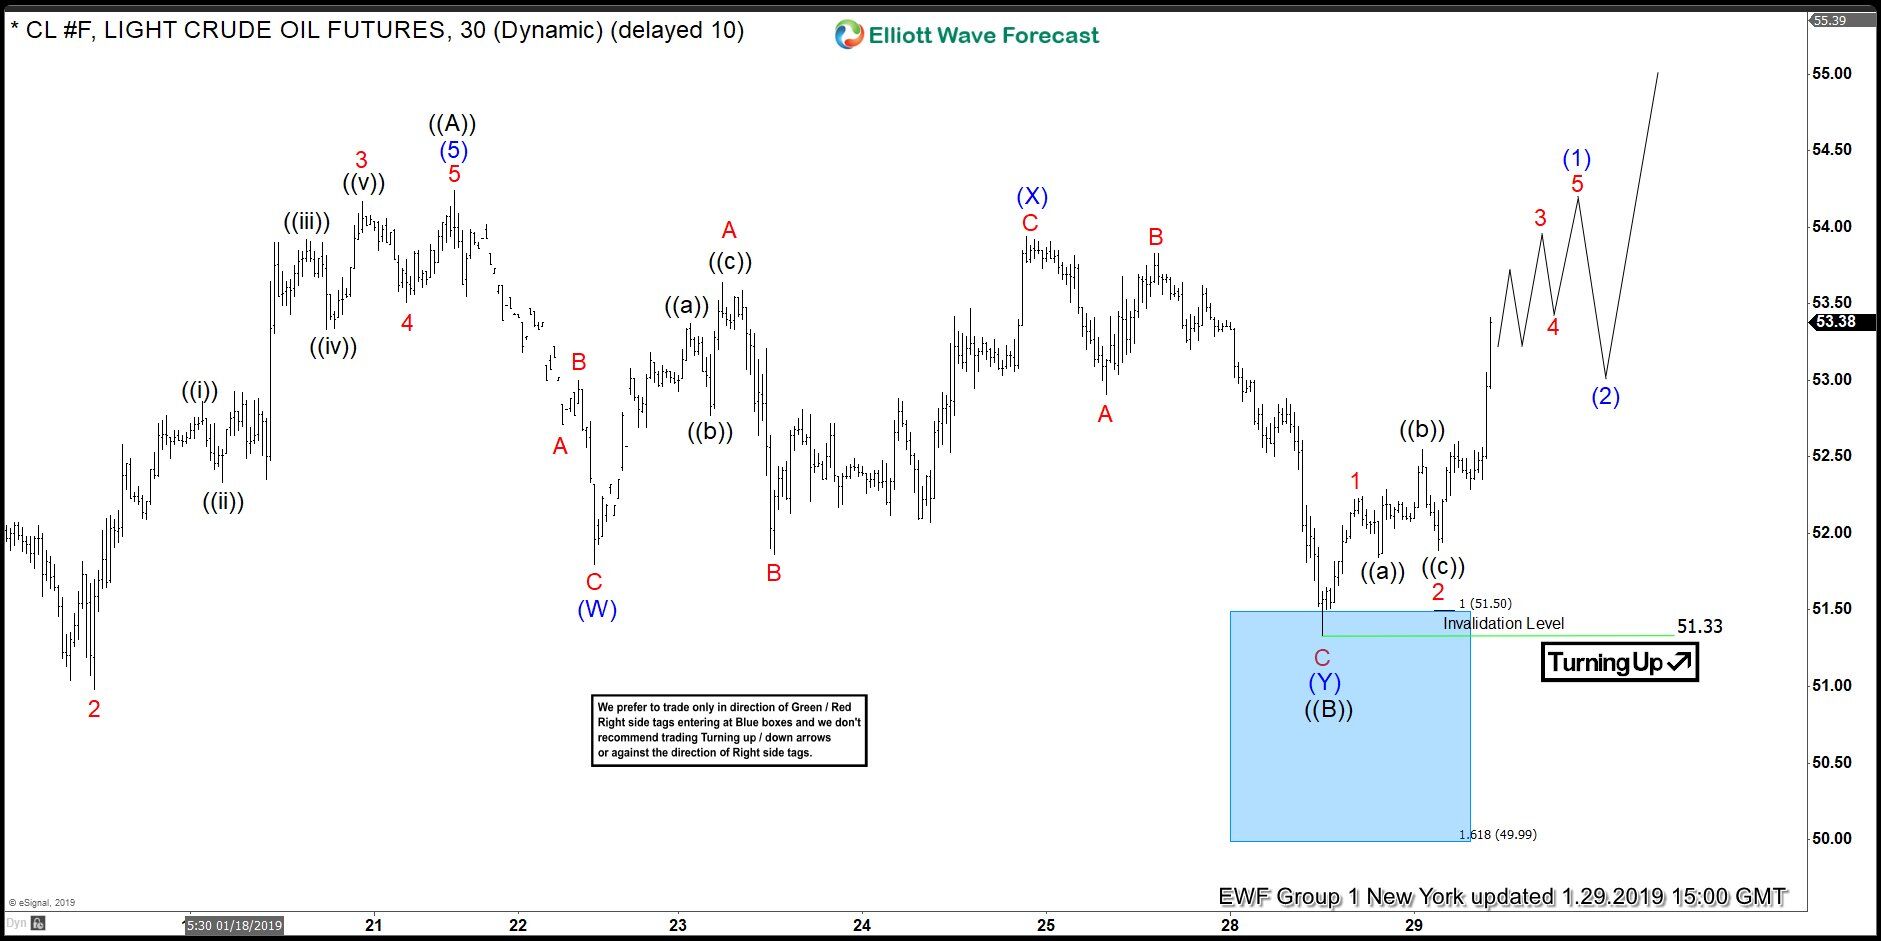
Welcome traders, today we will look at a couple of Oil futures (CL #F) charts. After reaching a short term top, patience leads us to a trading opportunity. See how profitable and efficient it can be to trade with basic Elliott Wave analysis and our defined blue box target areas.
First of all, we start on January 28 2019 with a 30-minute chart presented to our members. Here, we believe the market favors the downside in the near term solely based on our count. The top at $54.25, labeled as wave '((A))', serves as a resistance after finishing a 5 wave move. From there, based on Elliott Wave theory, a pullback is always expected. Due to the straight down pullback, followed by 2 bounces failing to break wave '((A))', it led us to believe 3 swing pullback was developing. More specifically, an (A)-(B)-(C) Elliott Wave zigzag structure forming for wave '((B))'.
Under our methodology, we do not take action with an unconfirmed 'right side of the market'. This is the meaning of the black 'TurningDown' arrow. So, we let the market shows itself and we adapt our count to make sense of the price action. As soon as wave (B) was confirmed, we derived a 1:1 minimum target and a 1:1.618 extreme target. These targets are combined to provide a blue box target area where probabilities favor the instrument to react from it in 3 waves at least.
Oil 1.28.2019 30-Min Chart Elliott Wave Analysis

Below you will see an updated chart of oil a day after, January 29 2019. Note that the count changed but the setup remains the same. So, as expected, with a complete 7 swing pullback, oil has potentially resumed the dominant trend. If anyone happens to buy the pullback at the blue box, they already have a risk free trade. Now as far as the $51.33 invalidation level remains intact, we expect further upside. Once again, our blue box target areas showing how accurate they can be.
Oil 1.29.2019 30-Min Chart Elliott Wave Analysis

*Note : Keep in mind the market is dynamic and the presented view might have changed after the post was published.
First of all, we start on January 28 2019 with a 30-minute chart presented to our members. Here, we believe the market favors the downside in the near term solely based on our count. The top at $54.25, labeled as wave '((A))', serves as a resistance after finishing a 5 wave move. From there, based on Elliott Wave theory, a pullback is always expected. Due to the straight down pullback, followed by 2 bounces failing to break wave '((A))', it led us to believe 3 swing pullback was developing. More specifically, an (A)-(B)-(C) Elliott Wave zigzag structure forming for wave '((B))'.
Under our methodology, we do not take action with an unconfirmed 'right side of the market'. This is the meaning of the black 'TurningDown' arrow. So, we let the market shows itself and we adapt our count to make sense of the price action. As soon as wave (B) was confirmed, we derived a 1:1 minimum target and a 1:1.618 extreme target. These targets are combined to provide a blue box target area where probabilities favor the instrument to react from it in 3 waves at least.
Oil 1.28.2019 30-Min Chart Elliott Wave Analysis
Below you will see an updated chart of oil a day after, January 29 2019. Note that the count changed but the setup remains the same. So, as expected, with a complete 7 swing pullback, oil has potentially resumed the dominant trend. If anyone happens to buy the pullback at the blue box, they already have a risk free trade. Now as far as the $51.33 invalidation level remains intact, we expect further upside. Once again, our blue box target areas showing how accurate they can be.
Oil 1.29.2019 30-Min Chart Elliott Wave Analysis
*Note : Keep in mind the market is dynamic and the presented view might have changed after the post was published.
Elliott Wave view in Exxon Mobil (ticker: XOM) suggests that the rally from December 26, 2018 low ($64.65) is unfolding as Elliott Wave zigzag. The first leg of the zigzag ended at $73.33 on January 18, 2019 high as wave A. A zigzag is a 5-3-5 structure and wave A should unfold in 5 waves in impulse or diagonal. We can see in the chart below that wave ((iii)) of A ended at $73, wave ((iv)) of A ended at $71.95, and wave ((v)) of A ended at $73.33.
The stock then pullback in wave B with the internal as a zigzag Elliott Wave structure as well. Down from $73.33, wave ((a)) ended at $70.64, wave ((b)) ended at $72.27, and wave ((c)) ended at $70.37. Wave C rally has started and the stock is expected to break above wave A at $73 and could see as high as $79 when wave A = C. To gain confirmation for this view, the stock still needs to break above $73. Otherwise, technically we still can't rule out a double correction in wave B. Near term, while pullback stays above $73.33, expect Exxon Mobil to extend higher.
Exxon Mobil 1 Hour Elliott Wave Chart

Similar threads
- Replies
- 0
- Views
- 1K
- Replies
- 2
- Views
- 2K