Elliottwave-Forecast

Master Trader
Feb 17, 2017
2,462
9
84
www.elliottwave-forecast.com
NASDAQ ticker symbol: $NQ_F short-term Elliott wave view suggests that a bounce to $6897 high ended Primary wave ((X)). Down from there, the decline is unfolding as a zigzag structure within primary wave ((Y)) where an initial decline to $6772.25 low ended Minor wave 1. Minor wave 2 bounce ended at $6864.75 high, Minor wave 3 ended in lesser degree 5 waves at $6523 low. Then a bounce to $6649 high ended Minor wave 4. Finally a push lower to $6423.25 low ended Minor wave 5 & also completed the intermediate wave (A) in 5 wave impulse structure.

Above from there, the index made a 3 wave bounce higher & completed the intermediate wave (B) at $6612.41 high. The internals of that bounce unfolded as double three structure where Minor wave W ended at $6577.50 high. Minor wave X ended at $6457 low and Minor wave Y ended $6612.41 high. Down from there, the index has made a new low below $6423.25 low confirming the intermediate wave (C) lower. Also, with this break lower the cycle from 12/12 peak ($6897) has become incomplete to the downside favoring more downside. Near-term, while bounces fail below $6612.41 high expect index to extend lower. We expect bounces to get failed against $6612.41 high in 3, 7 or 11 swings for further downside.

NASDAQ 1 Hour Elliott Wave Chart


Elliottwave-Forecast

Master Trader
Feb 17, 2017
2,462
9
84
www.elliottwave-forecast.com
Hello fellow traders. In this technical blog we’re going to take a quick look at the charts of RUSSELL published in members area of the website. As our members know, RUSSELL has incomplete sequences in the cycle from the August 31th 2018 peak. Break of October 24th low, has made 31th August cycle incomplete to the downside. The index is still missing more short term weakness to complete proposed August cycle, targeting 1298.5 area. Consequently , we expect the Index to find sellers in 3,7,11 swings sequences. We advised clients to avoid buying RUSSELL and keep on selling the rallies when given the opportunity. In the charts below, we’re going to explain the Elliott Wave structure, forecast and trading strategy.

RUSSELL Elliott Wave 1 Hour Chart 12.12.2018
As we can see at the charts below, RUSSELL is bearish against the 1562.74 peak in first degree. Proposed short term bounce seems to be unfolding as a Elliott Wave Double Three pattern. Recovery has scope to make another leg up toward 148.07 area, where we would like to be sellers against the 1562.7 peak. We recommended members to sell RUSSELL at the blue box (1478.07-1507.64) for further downside. As we have incomplete bearish sequences in August cycles, we expect sellers to appear at that area for further delcine ideally or 3 wave pull back alternatively. Stop Loss of the trade is a break above 1.618 Fibonacci extension (1507.64)


RUSSELL Elliott Wave 1 Hour Chart 12.17.2018


RUSSELL has made swing up as forecasted, however unfortunately it missed blue box:1478.07 by a few points. Sellers appeared early and short term recovery ended as truncation at 1474.7. The Index has given us the decline , making new short term low. Now RUSSELL is bearish against the as far as the 1474.7 peak in first degree. As far as that pivot holds , next leg down is in progress. Alternatively if during short term bounces mentioned pivot gives up, we can be doing Elliott Wave Flat pattern against the 1562.7 pivot

Keep in mind marked is very dynamic and proposed view could have ended in the mean time. You can check most recent updates in the Membership Area of the Website Best instruments to trade are those having incomplete bullish or bearish swings sequences. We put them in Sequence Report and best among them are shown in the Live Trading Room.
 

Elliottwave-Forecast

Master Trader
Feb 17, 2017
2,462
9
84
www.elliottwave-forecast.com
Hello fellow traders, In this blog, we will have a look at some short-term Elliott Wave charts of Netflix which we presented to our members in the past. You see the 1-hour updated chart presented to our clients on the 12/12/18.

Netflix ended the cycle from 12/03/18 peak in black wave ((W)) at 12/10/18 low (260.22). Above from there, we expected a bounce to occur in black wave ((X)). The bounce unfolded in an Elliott Wave double correction structure. We advised members that Netflix ideally should continue lower. Therefore, we expected sellers to appear in the sequences of 3, 7 or 11 swings. At the 100 - 1.236 Fibonacci extension of blue (W)-(X) which came at around 278.29-287.92 area and that was the first area for sellers to appear.

Netflix 12.12.2018 1 Hour Chart Elliott Wave Analysis


In the last Elliott Wave chart. You can see that the stock reached the blue box area (278.29-287.92) and reacted lower. If traded our blue box area shown in the chart above. Then, any trades from that area were risk-free, which means the stop-loss should be moved to break even, targeting lower levels. Please keep in mind that the 1-hour chart which I presented may have changed. Because as long as Netflix doesn't break 12/10/18 low (260.22). A double correction in black wave ((X)) higher still can't be ruled out. This blog should just illustrate how accurate our blue boxes are, and how our members trade our 3-7 or 11 swings strategy.


Netflix 12.16.2018 1 Hour Chart Elliott Wave Analysis
 

Elliottwave-Forecast

Master Trader
Feb 17, 2017
2,462
9
84
www.elliottwave-forecast.com
NZDUSD remains bullish as long as the October 8/2018 low remains untouched. On the Daily chart there are clear visible bullish patterns that can be seen. In the chart below, market patterns are used to determine where price can possibly pause and bounce higher. The green bullish AB=CD pattern triggers BUYS at the Fib. extension 1.0% level. The green AB=CD pattern is also close to where the blue bullish pattern triggers BUYS which is at the BC 0.50% Fib. retracement level. Traders should watch these two levels for a possible reaction bounce higher because there has been previous support/resistance price action in the past. Another bullish pattern can also possibly form if price continues lower towards the pink XA 1.618% Fib. retracement level where the pink bullish pattern triggers BUYS. Traders will need to wait and watch how price reacts at the possible support zone (blue box) and see if the market reacts higher to any of these bullish patterns. If looking to trade NZDUSD stops should be placed at the point B low of the blue bullish pattern looking for a rally higher to extend above the December 4/2018 highs. Only time will tell what NZDUSD will do but at least now you are aware of the possible area where Kiwi can bounce from.

NZDUSD Daily Chart 12.19.2018


Of course, like any strategy/technique, there will be times when the strategy/technique fails so proper money/risk management should always be used on every trade.
 

Elliottwave-Forecast

Master Trader
Feb 17, 2017
2,462
9
84
www.elliottwave-forecast.com
Technical based traders using EWF’s Blue Box System on 12/19/2018 executed a near perfect entry short in the Consumer Discretionary ETF - XLY before the FOMC rate decision. Prior to the actual trigger of the trade, Elliottwave-Forecast.com analysis showed our Group 3 Membership the ideal entry range. It is in these ranges of symmetrical extremes where highly probable directional reactions most often take place. And, like the reaction we see in XLY, continue to confirm our method of sequence analysis.

This system we use is incumbent upon trading in what we dub “The Right Side”. Using our proprietary sequence and cycle analytical system we determine first if there is a bearish or bullish sequence present. Once a sequence has been established we determine if the cycle is incomplete. If incomplete then we have a trading opportunity at the next corrective swing against the direction of the cycle. A trading entry is then mapped and planned at the extreme area. The formulated invalidation level must remain intact to keep our traders on the correct side of the market.

The 12/18/2018 Post Market Chart Setup for XLY


Over the years we’ve learned to trust what the charts are telling us versus chasing a fundamental event. The chart above highlights our intended selling range in blue. This area is where we would sell any 3, 7, or 11 “swings” back higher while prices remain below 105.83. Going in the trading session we already had a plan regardless of how the market interpreted the language of the FOMC.

On December 18th we issued recommendations to sell short XLY at 102.25 just before the 102.30 – 103.87 range to ensure all Members could participate regardless of their respective broker’s spread. Pre-Market, December 19th, in our Daily Group 3 Live Analytical and Trading Session we suggested XLY should melt up into the FOMC rate decision and trigger our shorts.

The 12/19/2018 Post Market Chart of XLY After The FOMC


The post-market chart above shows what happened to prices of XLY at the blue box. Prices hit a high of 102.33 on 12/19/2018 at 2:01 PM EST and instantly fell to 99.73 before briefly bouncing. The 102.25 entry was never more than a mere 0.08 negative and our traders were able to remove risk on the trade by 2:45 PM EST.

Wishing you a very Merry Holiday Season,

James

EWF Analytical Team
 

Elliottwave-Forecast

Master Trader
Feb 17, 2017
2,462
9
84
www.elliottwave-forecast.com
CVR Energy (NYSE:CVI) is presenting one of the best technical structure in Energy market despite the recent scary 40% drop in Oil prices.

At Elliottwave Forecast, we believe in the One Market Concept, therefore, we always look for answers around other instruments within the market. Since 2016 low, CVI did advance in a bullish 5 waves impulsive structure correcting 50% of the decline from 2013 peak.

The most aggressive bullish view suggest that CVI started a new Grand supercycle in 2016 and the rally was only a first wave of 5 waves move. Consequently, the current 3 waves pullback will find buyers at the 100% - 161.8% Fibonacci extension area $29.8 - $20.84 to finish a wave (II). Up from there, CVR Energy will resume the rally higher looking for a strong 3rd & 5th waves higher and ideally a break above 2013 peak for a target at $82 - $98 area. In the other hand, CVI rally could end up being just a wave (c) of a zigzag structure. So it can fail below $72 peak followed by another correction lower.

CVI Weekly Chart 12.23.2018


The presented blue box in the above chart is a High-frequency area where the Market is likely to end cycle and make a at least a 3 waves bounce to allow investors to create a risk free position. Then until the stock break above May 2018 peak, it can still do a 7 or 11 swings correction lower before ending wave (II) or (b).

Conclusion:
CVR Energy current corrective correction is presenting a new investing opportunity similar to the one that took place in 2016 from the weekly blue box area $12.04. Consequently, energy stocks will be looking for a recovery to take place in 2019 which can lead to another 2 years rally.
 

Elliottwave-Forecast

Master Trader
Feb 17, 2017
2,462
9
84
www.elliottwave-forecast.com
In this blog, I want to share some short-term Elliott Wave charts of AUDCAD which we presented to our members in the past. Below, you see the 1-hour updated chart presented to our clients on the 12/19/18. Showing that AUDCAD ended the cycle from 12/03/18 peak in red wave W at 12/09/18 low (0.95680).

As AUDCAD ended the cycle from 12/03/18 peak, we expected a bounce to occur in red wave X. Above from 12/09/18 low (0.95680), the bounce unfolded in an Elliott Wave ZigZag correction structure. We advised members that AUDCAD ideally should continue lower. Therefore, we expected sellers to appear in the sequences of 3, 7 or 11 swings. At the 100 - 1.236 Fibonacci extension of black ((a))-((b)) which came at around 0.96837-0.97551 area and that was the first area for sellers to appear.

AUDCAD 12.19.2018 1 Hour Chart Elliott Wave Analysis


In the last Elliott Wave chart. You can see that AUDCAD reached the blue box area (0.96837-0.97551) and reacted lower. If traded our blue box area shown in the chart above. Then, any trades from that area were risk-free, which means the stop-loss should be moved to break even, targeting lower levels. AUDCAD broke red wave W at 12/09/18 low (0.95680), confirming that the next extension lower has started. Do please keep in mind that the 1-hour chart which I presented may have changed already. This blog should just illustrate how accurate our blue boxes are, and how our members trade our 3-7 or 11 swings strategy.

If you are interested in how to trade our blue box areas and want to understand how Elliott Wave works. Then I recommend you to get a shot on our special promotion which we are currently running below. We present a lot of trading setups in our 3 Live Trading Rooms.

AUDCAD 12.20.2018 1 Hour Chart Elliott Wave Analysis


I hope you liked this blog and I wish you all good trades.
 

Elliottwave-Forecast

Master Trader
Feb 17, 2017
2,462
9
84
www.elliottwave-forecast.com
Welcome traders, here we will look at a couple of Dow Jones futures chart and how profitable it can be to trade with our philosophy and basic Elliott Wave analysis.

Below its a chart from December 19th presented to our members. At this point in time, we called for an incomplete sequence to the downside after the low of October 29 had been broken on the 10th of December; hence our bearish sequence stamp. With our bearish sequence stamp, our members expect new lows are expected to come. From the 24844 pivot, an impulsive 5 wave move to the downside was spotted with an extended 3rd wave. The impulsive move was followed by a noticeable pullback, which we believed to be an A-B-C flat type of correction. With wave A & B defined we are able to define our blue box target areas. Using Fibonacci extension levels the area of 24292-24001 was the target to hit.

With our aggressive approach, our members are advised to sell the index in 3, 7 or 11 swing bounces once a bearish sequence stamp and target area are established. So, once the 3 swing A-B-C bounce reached the target area, we favored the selling.

Dow Jones Futures 12.19.2018 1 Hour Chart Elliott Wave Analysis


What happened next, is the best type of reaction we can get off of our target areas. Below you can see an updated chart of the index from December 21st. Notice how the index, from the blue box target area, ripped to the downside breaking the low of wave A; previously labeled as wave (A). When a previous low is broken, a new equal leg target area is derived. In this case, Fibonacci extension levels were used off of the A & B wave pivots, giving us our new target area of 22721-22399.

Dow Jones Futures 12.21.2018 1 Hour Chart Elliott Wave Analysis


*Note : Keep in mind the market is dynamic and the presented view can always change depending on the price action.

Trading success is a journey and you will never be perfect at it, but you can always master your reaction to the market.
 

Elliottwave-Forecast

Master Trader
Feb 17, 2017
2,462
9
84
www.elliottwave-forecast.com
The World Indices have shown a sideways to lower year in 2018. The last Quarter alone World Indices lost their gains, for example, the SPX or the Dow Jones. Other World indices peaked earlier than others this year and some of them did not produce new highs again.

There is a lot of speculation going around the Market which results in many questions which need to be answered. We can hear a lot of experts calling different reasons and scenarios. It goes from a Political crisis to the Trade war with China, to the Feds raising interest rates and many more assumptions. However, the reality is that neither of the mentioned reasons can justify the latest moves in our opinion.

The Market as we always say is a combination of time frames, cycles, and sequences. And the only thing that matters is the way Market Makers (Smart money) trade them. We understand this is a big secret which even people in the media or in the public don’t even talk about it.

The way the Market works is what we call Market Nature and goes from Inflection areas to inflection areas. It is very simple. The Market makers know those inflection areas because they are doing the Market and consequently, they know when to turn and when to push one side over the other. The World Indices are not just the SPX or the Dow Jones. World Indices are the Indices across the World. We Elliottwave-Forecast always relate instruments with other similar instruments, which is called market correlation. That allows us to follow the Instruments which are showing the clearest structure. Then we relate them with the rest and make the Elliott wave counts accordingly.

Many believe in the Elliott Wave Theory. We are using and practicing the Theory as well every day. But we understand that Elliott Wave on its own is not a reliable tool. We believe that the Market Makers do not use The Elliott Wave Theory to trade. They use sequences, cycles and relate them across the Market. They have the power to make the Market.

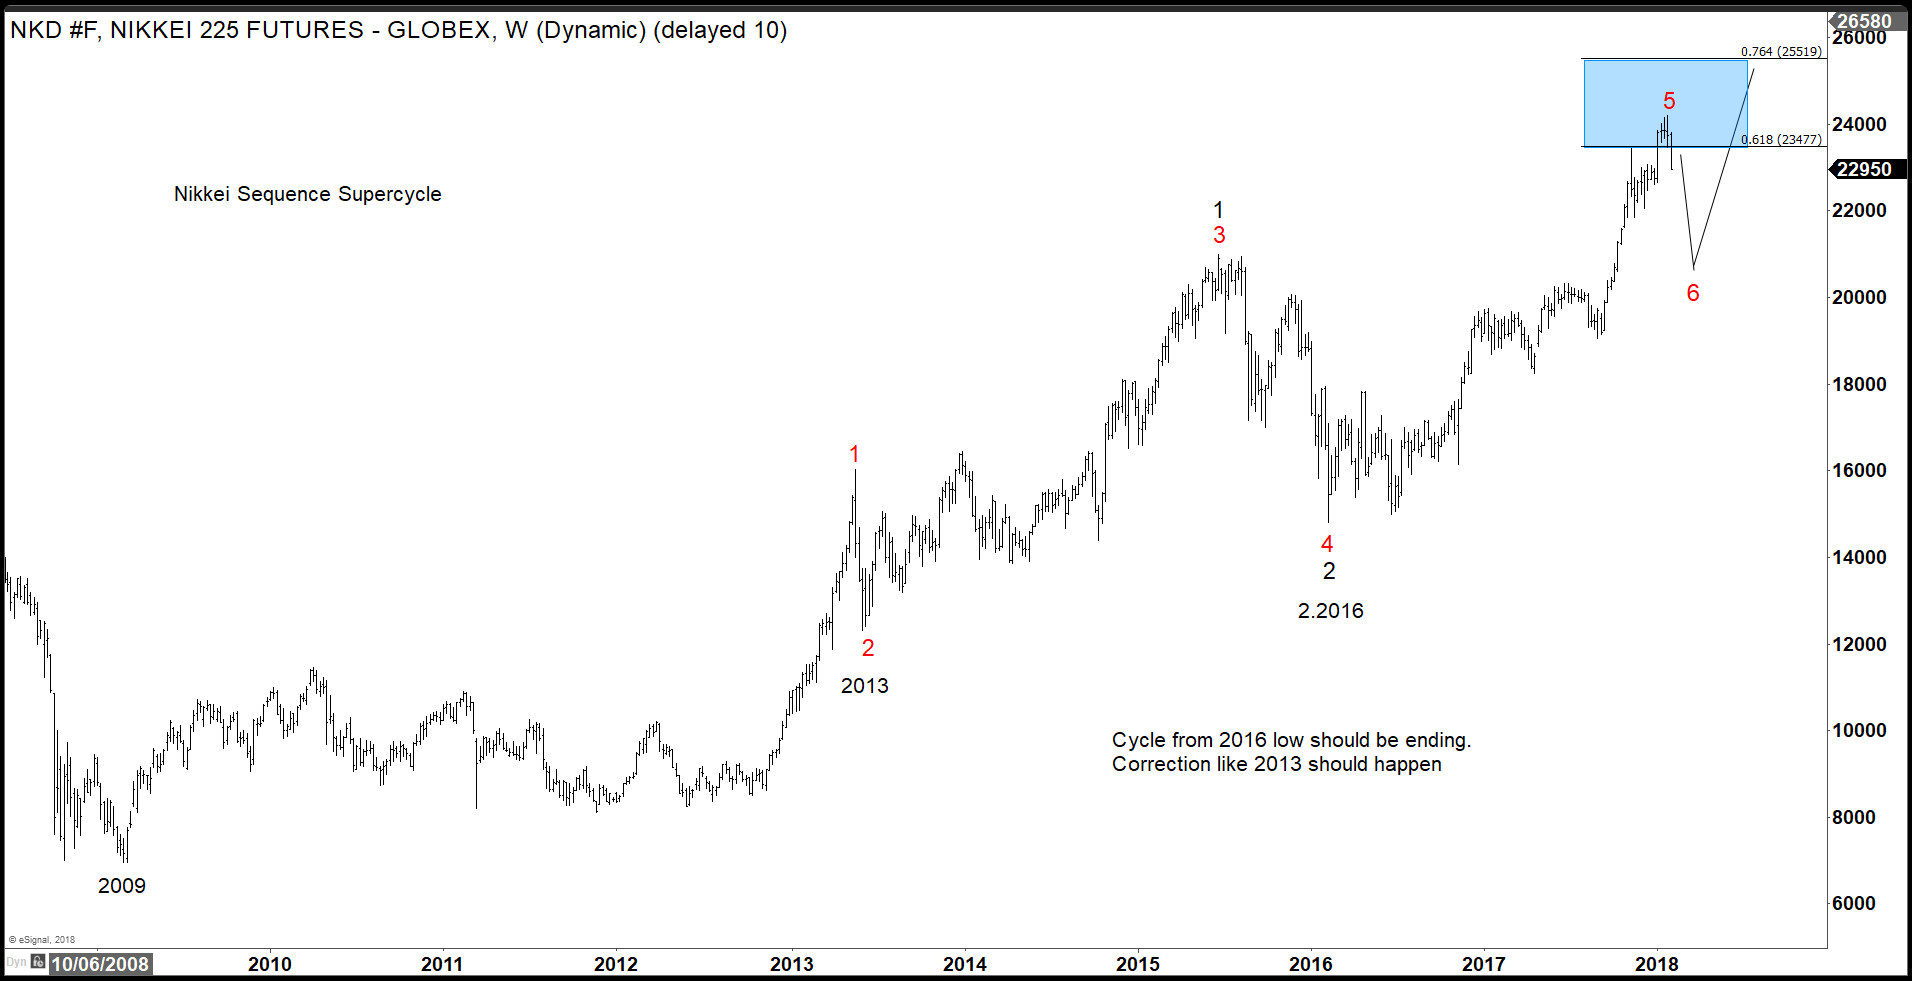
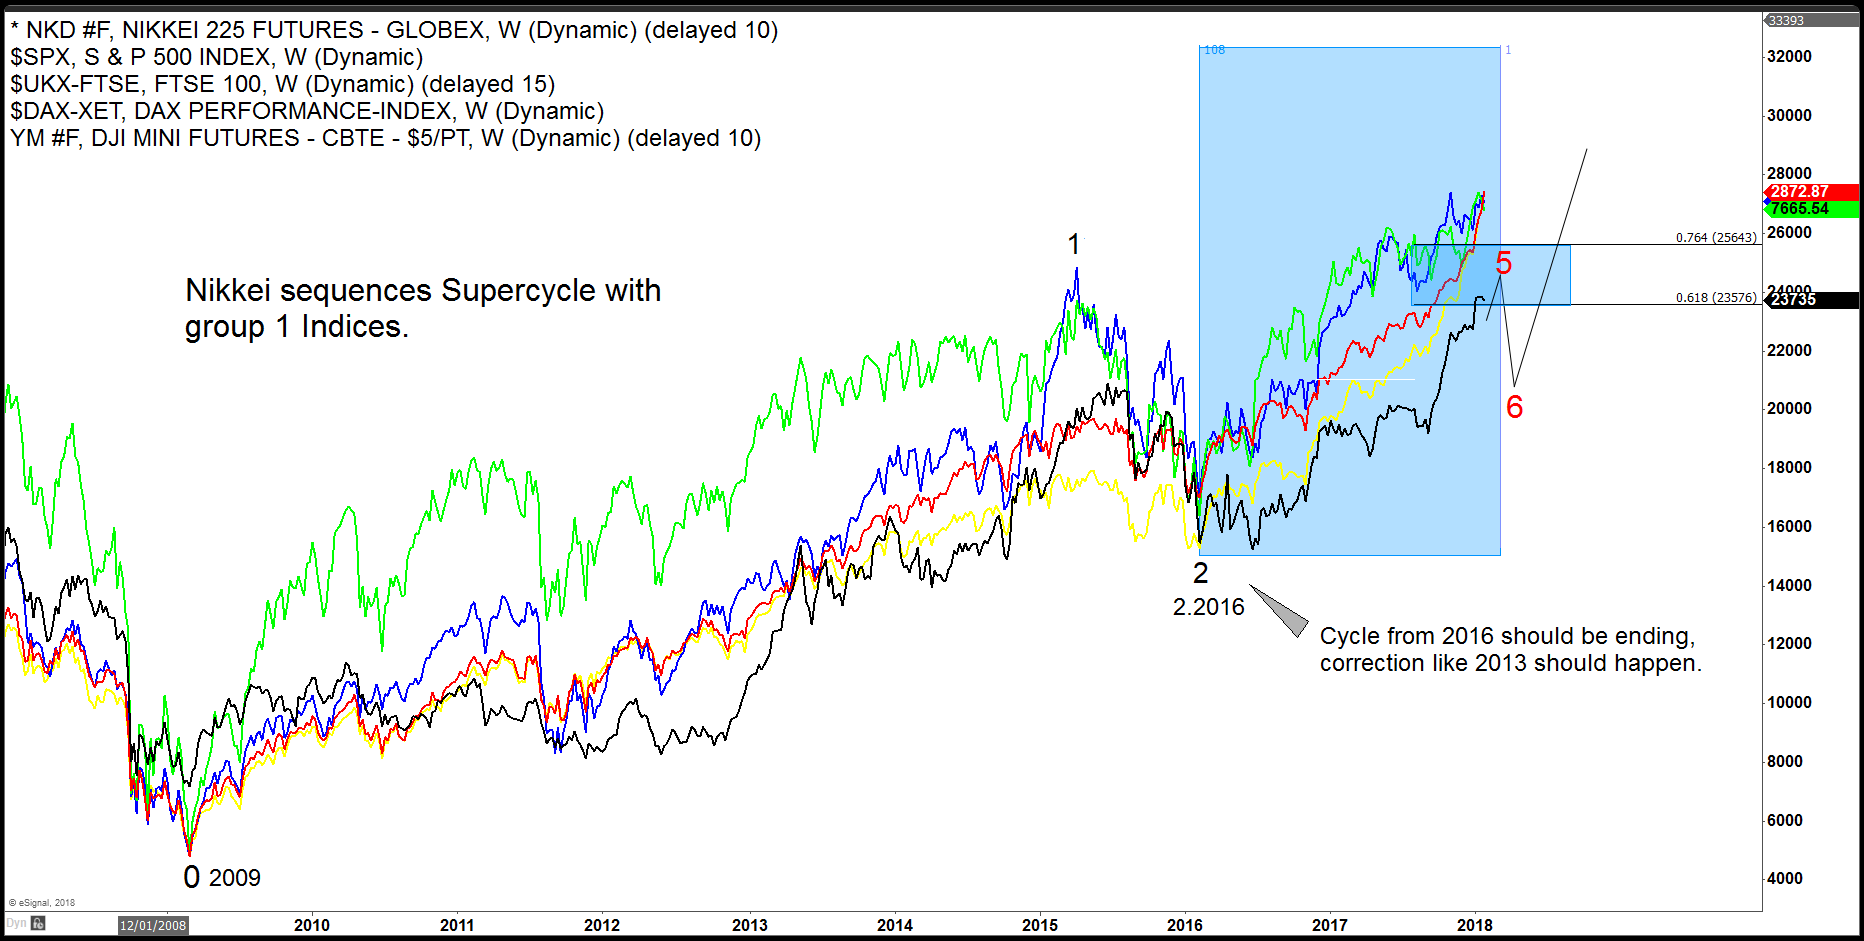
Coming to the recent decline. The decline which we are seeing is very Technical and can be seen across other markets as well which many traders don't even recognize. Everything started in January 2018. The World Indices have reached a stage in which a decent pullback was expected. In the following chart, you can see the Nikkei weekly chart presented to members in our Yearly Forecast earlier this Year. You can see that we expected a decent pullback in the Instrument.


Nikkei Weekly Chart published at our Yearly Forecast


The Blue Box which you can see in the chart above. Is the 61.8% Extension area within a Bullish Grand Supercycle. That area was reached already earlier this year. Also in other Indices like the FTSE100, SPX or the Dow Jones YM reached their respective areas. Therefore, we knew that 2018 was about to be a tough year for the World Indices and we told members that will be like 2015 over again. We presented this comment to our members at the Yearly Forecast:

Since bottoming in 2009, the rally in Nikkei from 2009 low shows a 5 swing sequence, favoring further upside. Nikkei has now reached the area of 23576 – 25643 where the fifth swing can end, and we are calling swing #5 ended at 24200. Nikkei is expected to pullback in the 6th swing in 3, 7, or 11 swing to correct the cycle from 2.2016 low. The expected correction in the 6th swing is similar in nature to the correction in 2013 (the 2nd swing correction) and then more upside in 7th swing. We don’t like selling Nikkei and prefer buying dips in 3-7-11 swing against 2.2016 low.”

Another quote in our Yearly Forecast stated the following:

“In conclusion, 2018 should be an interesting year for the Market, seeing the charts we can expected a temporary peak in the Indices. We believe the cycle from 2016 should be ending this year and a pull back like the one seen in 2013 should be seen before we get more upside in the Indices. Indices dips should find buyers in 3-7-11 swings against 2016 lows.”

As you can see, we already warned our members of a temporary peak in 2018 and that a decent pullback should follow. The next chart represented the Nikkei sequences overlayed with others World Indices showing the expected Pullback.


Nikkei vs World Indices Weekly Chart


So as you can see, we already warned our members that the 2016 cycle was ending and a pullback was coming.

For us, it is very clear that the World Indices decline is very Technical and was expected overall. With that said the decline has nothing to do with interest rates, Political environment or Trade War. The decline is happening, because the World Indices reached the areas in which by Nature the Market pulls back. It was easy to see and expect.

The White House can come and try to spin the decline and show the positive face and facts but the reality is that Market Nature, sequences, cycles are still calling for more downside. Stocks like BABA and XOM are the important players now and they are presenting the floor for the Market again to rally. Those have the clearest structure.

Elliott Wave Theory counts can be adjusted in second. But Sequences cannot, and they work in higher perfection than the Theory itself. The Sequences are clear and we are waiting for BABA and XOM to reach their respective extreme areas. And once they reach their extreme. The World Indices should rally again because, they are all trading at same cycles, sequences and all are related to each other. Sequences and cycles rule the Market.

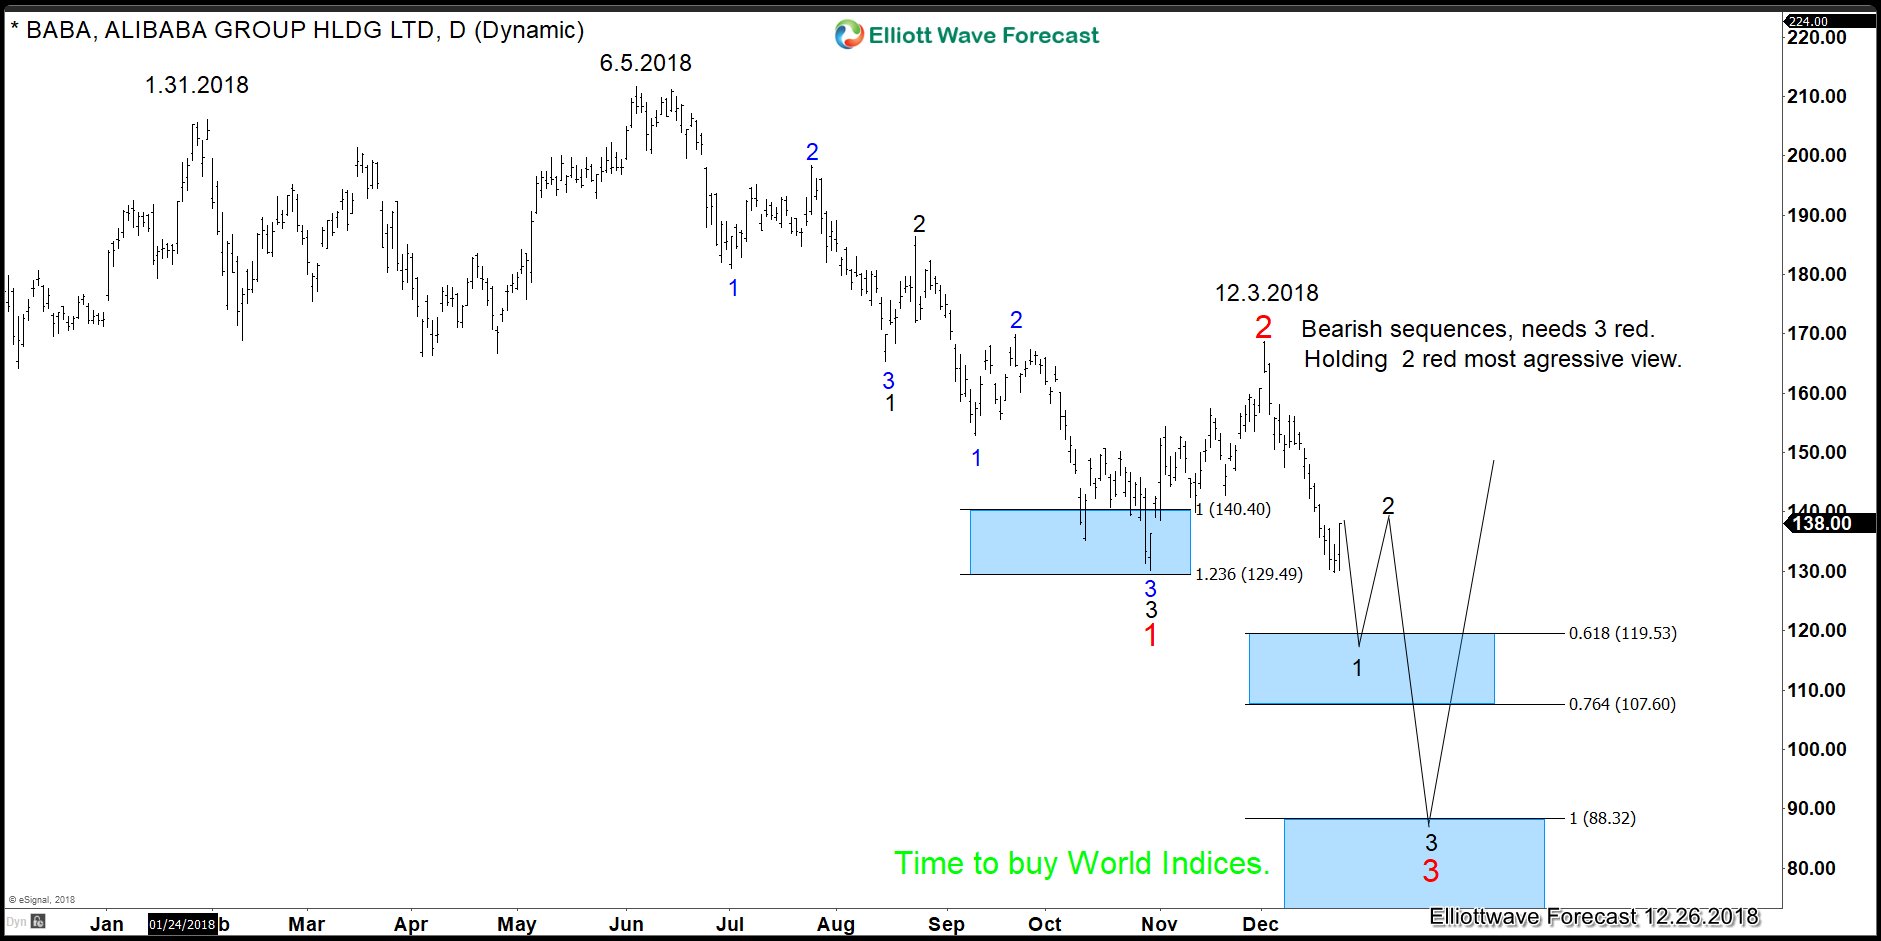
The following chart shows the BABA sequences from the 06/05/18 peak. This stock is supporting the idea of World Indices still trading lower against 12/3/18 peak.


BABA Daily Sequence Chart


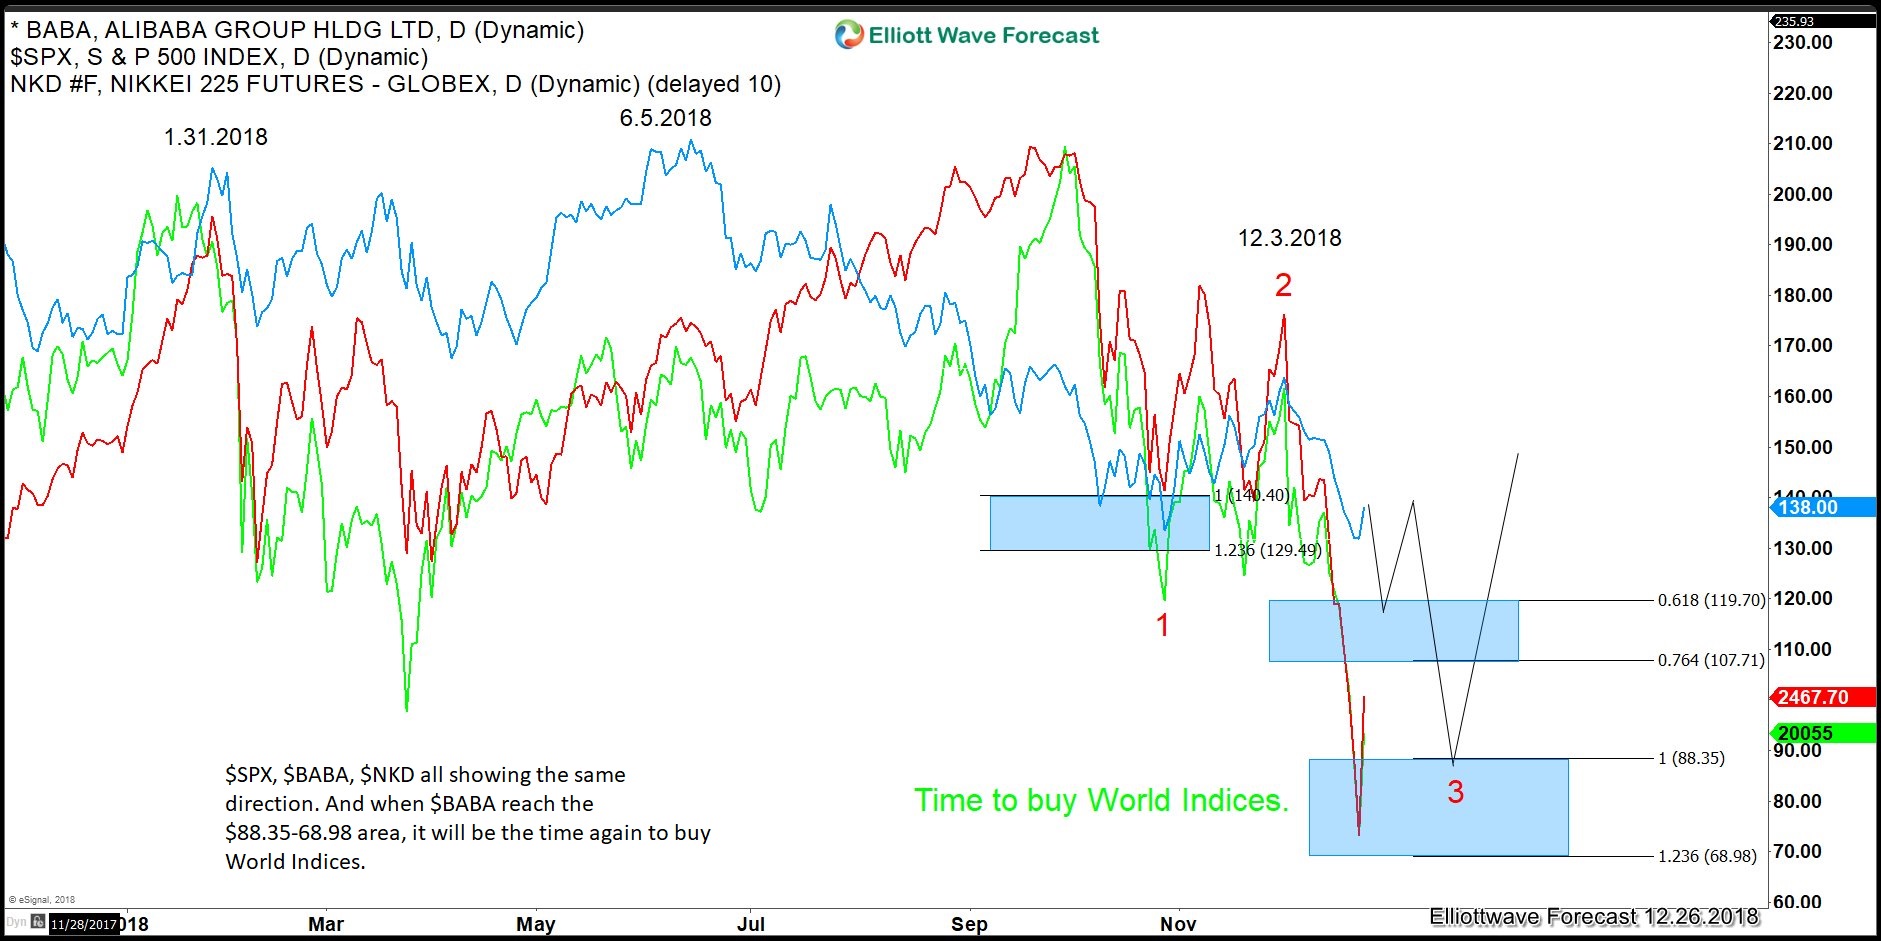
In the last chart you can see an overlay of SPX, BABA and the Nikkei Index. All are trading in the direction lower. And once BABA reached the 88.35-68.98 area (blue box) it will be yet the time again for us to buy the World Indices again.


SPX overlayed with BABA and Nikkei Daily Chart


We have learned over the Years to relate the Market with other correlating Instruments because that is the only way to get an edge. The Indices are not correcting the Grand Supercycle yet. They either have been correcting the 2016 cycle or the Supercycle. Anyway, they will offer us again a great opportunity to buy. Those whose are saying the economy is strong, they will be ending been right, because the sequences are supporting that fact. Stocks are having a very good price and the Grand Supercycle correction still need to wait. The chances that it is ending happening now is small, it can be seen through stocks like BAC because the stock would then go below zero which the chances are very small. We understand how the MARKET makers trade, so we follow them. And not the news events, Political world or Trade Wars. We at Elliott Wave Forecast trade like Smart Money.
 

Elliottwave-Forecast

Master Trader
Feb 17, 2017
2,462
9
84
www.elliottwave-forecast.com
Hello fellow traders. In this technical blog we’re going to take a quick look at the charts of OIL published in members area of the website. As our members know, we were calling for decline in OIL from November 2018. As of right now the commodity is correcting the cycle from the 26.18 low. Proposed pull back is unfolding as Expanded Elliott Wave Flat Structure, when Oil still has scope to keep extending lower. We advised clients to avoid buying OIL and keep on favoring the short side. In the charts below, we’re going to explain the Elliott Wave structure and forecast.

OIL Elliott Wave 1 Hour Asia Chart 11.16.2018
As we can see at the charts below OIL is doing short term recovery that is unfolding as Elliott Wave double three pattern. It's expected to make another leg up to complete 7 swings in proposed bounce. Recovery has scope to reach 58.25 + area ( blue box) , where we would like to be sellers. We recommended members to avoid buying OIL and keep selling short term rallies in 3,7,11 swings for further downside. Stop Loss of the trade is a break above 1.618 Fibonacci extension (59.87)


OIL Elliott Wave 1 Hour New York Midday Chart 11.16.2018
We got the proposed leg up , 7th swing as expected. However sellers appeared early and pushed the price down before proposed area was reached. The price has missed blue box by a few points. Now wave ((4)) recovery looks completed at 57.99 high, and we are calling for further weakness. We need to see break of previous low to confirm next leg down is in progress.


OIL Elliott Wave 1 Hour London Chart 11.21.2018
The price has held below 57.99 peak and we got proposed decline. Eventually OIL has made new short term low, confirming next leg down is in progress. Now the commodity has opened new cycle to the downside and it can be sold in 3,7,11 swings against the 57.99 peak. We don't advise buying OIL and favor the short side against the 57.99 peak.


OIL Elliott Wave 1 Hour Chart 11.28.2018
The price has held invalidation level at 57.99 and we got a nice decline as expected. Short term recovery wave ((4)) has reached its equal legs at 52.48. It found sellers immediately and gave us nice reaction from the blue box. Members who are in short positions from there should be already risk free. We are calling wave ((4)) recovery completed.


OIL Elliott Wave 1 Hour Chart 11.30.2018
We got new low in OIL, however buyers are also strong at this stage and we're getting choppy price action. We see possibilities of more short term strength toward 52.52-54.28 area


OIL Elliott Wave 1 Hour Chart 12.08.2018
Wave ((4)) recovery has taken form of Elliott Wave Flat pattern and completed at 54.59 . Now as far as the price holds below 54.59 peak, we expect further decline.

Keep in mind market is very dynamic and proposed view could have ended in the mean time. Best instruments to trade are those having incomplete bullish or bearish swings sequences. We put them in Sequence Report and best among them are shown in the Live Trading Room.


Elliottwave-Forecast

Master Trader
Feb 17, 2017
2,462
9
84
www.elliottwave-forecast.com
Care to guess what is the best performing major currency in 2018? Chances are you will say that it's the US Dollar. Although US Dollar is doing pretty well this year, the best performing currency is in fact the Japanese Yen. You can see in the table below that despite the Dollar Index rallying 4.9% as of Dec 27th, the Yen has outperformed the U.S Dollar by 1.43%. We can also see the U.S. Dollar has rallied against all the other major currencies, but the Japanese Yen has rallied even at a greater percentage against the same currency. For example, EURUSD has dropped 5.08%, meaning that U.S Dollar has rallied 5.08% against European Dollar this year. However, EURJPY dropped 6.5%, which means that Japanese Yen has rallied at a greater percentage against the European dollar.


The market as always is a discount mechanism and it discounts events several months and years in advance. The BOJ (Bank of Japan) has embarked in a massive quantitative easing since 2013 and it's the only major central banks that still maintains the program. The Fed has started to unwind the quantitative easing and normalize the balance sheet while the ECB has stopped the program.

BOJ is caught in a conundrum. The 2% inflation target remains as elusive as ever, and the recent selloff in Oil should further damp the outlook. BOJ Governor Haruhiko Kuroda admitted that BOJ must weigh in the negative cost of prolonged monetary easing. For example, it can hurt financial institutions' profits and discourage them from boosting lending. The change in attitude underscores the rising hurdle for meeting BOJ's price goal. Minutes of the October rate review shows a rift within the BOJ as board members disagree on the prolonged easing.

Last month, Kuroda also said that Japan no longer needs to "decisively implement a large-scale policy to overcome deflation." This is perhaps the most specific hint that BOJ is preparing to exit from the most aggressive quantitative easing experiment. Couple this with the Fed's rate hike path running out of steam, the Yen likely can continue to get stronger in 2019. This is the scenario where BOJ reduces stimulus as the Fed pauses. An anticipated end to BOJ's negative interest rate policy in 2019 should make the yen more attractive.

Below we will take a look at Elliott Wave outlook for two Yen crosses: GBPJPY and EURJPY. We will check to see what the technical tells us about the outlook for Yen pairs in 2019.

GBPJPY Daily Elliott Wave Outlook 12.27.2018


GBPJPY Daily Elliott Wave chart above suggests that cycle from 2.2.2018 high shows an incomplete bearish sequence towards the target of 129.1 - 133.06. This view is valid as far as pair remains below 9.21.2018 high (149.78) which is the invalidation level. The decline from 2.2.2018 high is a textbook 7 swing double three Elliott Wave structure (WXY) This chart confirms that Japanese Yen will continue to outperform against Pound Sterling in 2019.

CADJPY Daily Elliott Wave Outlook 12.27.2018


CADJPY Daily Elliott Wave chart above also shows that cycle from 9.15.2017 high shows an incomplete bearish sequence towards the target of 75.49 - 78.11. This view is valid as far as pair remains below 10.3.2018 high (89.18) which is the invalidation level. The decline from 9.15.2017 high is also 7 swing double three Elliott Wave structure (WXY). The first leg Primary wave ((W)) unfolded as a Flat Elliott Wave structure (A)-(B)-(C) with 3-3-5 structure. This chart confirms that Japanese Yen will continue to outperform against Canadian Dollar in 2019.

In conclusion, both GBPJPY and CADJPY Elliott Wave outlook confirms the thesis that Japanese Yen can continue to outperform. The market price action has spoken and the current strength in Japanese Yen discounts the future in which BOJ reduces stimulus and the Fed pauses the rate hike.
 

Elliottwave-Forecast

Master Trader
Feb 17, 2017
2,462
9
84
www.elliottwave-forecast.com
Welcome traders, today we will look at a couple of Palladium futures (PA #F) charts. The metal reached one of our blue target areas and react perfectly to our expectations. This will show you how profitable and efficient it can be to trade with our philosophy and basic Elliott Wave analysis.

First of all, we start with Palladium futures' 45 minute chart from December 23rd presented to our members. At the time, we maintained a bullish perspective due to our Elliott Wave analysis. Our count suggested an ending diagonal cycle waiting for a final 5th wave up. Also, a bullish sequence stamp was presented on a larger time frame. This was due to the October 23rd high broken on November 15th. Consequently, this increasingly enforced 'the right side' of the market; hence opening higher probabilities of reaching newer highs.

With our aggressive approach, our members are encouraged to act on our target areas with the right side of the market. Furthermore, our approach unquestionably takes a trading opportunity when a bullish/bearish stamp is also present. Although we had no stamp in 45 minute time frame, but we do have a bullish sequence stamp in the 4 hour to back up the upside trend.

Palladium 12.23.2018 1 Hour Chart Elliott Wave Analysis


Below you can see an updated chart of the instrument from December 28th. Notice how the metal reacted off of the blue box target area and resumed the upside. The area of 1160.74-1140.13 was calculated using the the Fibonacci extension tool, in this particular case, off of wave ((w)) & ((x)). This is what we call the 'equal leg area' where we sell or buy depending on the market.

A mapped entry, an invalidation level set up, the right side, sequences, add up to great trading opportunities. Above all, waiting for the right signals proved to be successful and we got the proposed reaction as expected.

Palladium 12.28.2018 1 Hour Chart Elliott Wave Analysis


*Note : Keep in mind the market is dynamic and the presented view might have changed after the post was published.

Trading success is a journey and you will never be perfect at it, but you can always master your reaction to the market.
 

Elliottwave-Forecast

Master Trader
Feb 17, 2017
2,462
9
84
www.elliottwave-forecast.com
The social networking service Twitter (NYSE:TWTR), is one of the fewest technology companies that went public and its stock under-performed among the sector against the giants of the game.

After its IPO in 2013, TWTCan Twitter (NYSE:TWTR) Aim for New All Time Highs ?R rallied to $74 and since then it started a correction lower with a 3 waves decline as a zigzag structure that ended in 2016 at $13.6 low. Up from there, the stock rallied higher showing an impulsive 5 waves advance toward $47 then it started another technical correction lower. The decline from June 2018 peak can be looking for the extreme area around $23.8 - $15.6 before finding buyers to resume the rally higher or bounce in 3 waves at least.

Twitter TWTR Weekly Chart 12.31.2018


Based on the Elliott Wave Theory, a 5 waves move is followed by a 3 waves correction then the trend resume with another 5 waves in the same previous direction. Consequently, as long as TWTR remain above $13.6 low, then the stock can rally higher to break 2018 peak with another 5 waves move which can be a part of a new impulsive cycle to the upside to take the stock to new all time highs.

However until the stock manage to creates extension higher with a break above 2013 peak, the next 5 waves move could remain just a wave c of a 3 waves zigzag structure which would end below 2013 peak then another leg lower will take place.

Forecasting is a process of continuous adjustments. A waver needs to accept when an idea doesn't work out and adjust according to new data without a bias. Therefore, Twitter can present a good investing opportunity for the coming 2 years then the whole idea can change with the new structure.
 

Elliottwave-Forecast

Master Trader
Feb 17, 2017
2,462
9
84
www.elliottwave-forecast.com
Six years ago in 2012, Euro zone was in the midst of crisis, with bailouts of Greece pushing the Euro to the verge of a collapse. Peripheral European countries like Greece, Portugal, Italy were unable to sell government bonds without offering significant yield. In order to convince international investor, ECB President Mario Draghi back in July 26, 2012 famously made the remark: “Within our mandate, the ECB is ready to do whatever it takes to preserve the euro. And believe me, it will be enough.” ECB then announced a program to buy the bonds of distressed member countries. It never ended up using this program as the promise was enough to calm investors. It eventually launched a bond buying (QE) program in 2015. However, the Euro Zone's peripheral yields have already stabilized by then as chart below shows:


Fast forward to today, ECB has confirmed on 13 December that it would end the Quantitative Easing program after almost 4 years. The bank has also left its guidance on interest rate intact. Interest rate will stay unchanged at least through the summer of 2019 or longer. ECB will also continue to reinvest the proceeds from maturing securities for as long as necessary. So is Quantitative Easing successful? At the outset, it helped to improve the region's growth, stabilize financial market (bond, currency and equities market). It's however too early to judge the long term implication.

In the chart below, we will look at a Euro cross pair (EURAUD). The pair looks bullish and we can see that the QE in 2015 did not really weaken Euro much further. Now that the Euro Zone has stabilized and the program ended, there's a chance that the pair can continue the bullish move in 2019.

Weekly Elliott Wave Chart of EURAUD


Weekly Elliott Wave chart of EURAUD above shows that pair has a higher high sequence from 2.22.2017 low. If it breaks above Aug 21.2015 high (1.6585), it will show a larger degree bullish sequence from Aug 2, 2012 low. The rally from Aug 2, 2012 low is unfolding in a double three Elliott Wave structure. A double three Elliott Wave structure is a 7 swing structure, labelled as WXY. This structure suggests that EURAUD should continue to trend higher as far as it stays above 1.533 in first degree, and 1.36 in second degree. Potential 100% target area to the upside in wave (y) comes at 1.859 - 1.977.

It should be interesting to see how this pair affects other Euro pairs. If this pair moves as expected above, then it argues that Euro can be doing pretty well in the first half of 2019 if not the entire year.
 

Elliottwave-Forecast

Master Trader
Feb 17, 2017
2,462
9
84
www.elliottwave-forecast.com
Short term Elliott Wave view in GBPUSD shows that rally to 1.2816 ended Intermediate wave (4). Internal of that rally unfolded as a triple three Elliott Wave structure. Minor wave W ended at 1..2687, Minor wave X ended at 1.2528, Minor wave Y ended at 1.2739, second Minor wave X ended at 1.2614, and Minor wave Z ended a 1.2816. Decline from there ended at 1.2437 in Minute wave ((a)) as a 5 waves impulsive Elliott Wave structure.

Down from 1.2816, Minutte wave (i) ended at 1.2717, Minutte wave (ii) ended at 1.2773, Minutte wave (iii) ended at 1.258, Minutte wave (iv) ended at 1.2616, and Minutte wave (v) ended at 1.2437. Near term, expect pair to correct decline from 12/31 high (1.2816) within Minute wave ((b)) in 3, 7, or 11 swing before the decline resumes. We don't like buying the pair with the right side tag showing lower and expect sellers to appear and pair to extend lower as far as pivot at 1.2816 stays intact.

GBPUSD 1 Hour Asia Elliott Wave Chart


Elliottwave-Forecast

Master Trader
Feb 17, 2017
2,462
9
84
www.elliottwave-forecast.com
ROKU investors had great hopes for 2018 as the streaming TV platform continued it outstanding growth in addition to its stock price surging to new all time highs. However in just 3 months, the stock erased all gains to end up with -40% similar to the rest of stock market in 2018.

The company earning report and steady growth attracted all type of investors and Hedge Funds interest in the stock grow as their number increased significantly in the previous quarter as we can see in this graphic.


Can ROKU recover in 2019 and turn the table around ?
The stock rally since IPO failed to achieve an impulsive 5 waves advance and ended up as 3 waves Zigzag structure. The take profit took place at the blue box area $72 - $82 which triggered the sell-Off.

The decline from October peak is taking the shape of a 7 swings move and it reached the measured Fibonacci target at 100%-$123.6 area $30.6 - $23.8. The pattern is an Elliott Wave corrective structure called Double Three which ideally would produce in this case at least a bounce to the upside to correct the previous cycle.

ROKU Daily Chart 1.2.2019


Consequently, as long as ROKU remain above its IPO low $15.75 then it will be looking for a recovery toward $50 - $60 then the stock can decide if the new cycle can take it higher toward $88 and above or a larger move lower will follow.
 

Elliottwave-Forecast

Master Trader
Feb 17, 2017
2,462
9
84
www.elliottwave-forecast.com
Hello fellow traders. Another instrument that we have been trading lately is EURUSD. In this technical blog we’re going to take a quick look at the Elliott Wave charts of EURUSD, published in members area of the website. As our members know, EURUSD has incomplete bearish sequences in the cycle from the 02/16 peak. Consequently, we advised members to avoid buying the pair and keep on selling the rallies in the sequences of 3,7,or 11 swings whenever get chance. In further text we’re going to explain Elliott Wave Forecast and Trading Setup.

EURUSD 4 Hour Elliott Wave Analysis 11.08.2018
Break of 08/15 low has made the pair bearish against the 1.18158 peak . Cycle from the February peak looks incomplete now, calling for further weakness. As we can see on the chart below , the pair is correcting the cycle from the 1.18158 peak. Recovery is unfolding as Elliott Wave Double Three Pattern. Currently it's showing 5 swings from the lows, suggesting another leg up to complete 7 swings. The pair has scope to reach 1.1521 -1.1680 area before proposed decline takes place. Although we expect another swing up to happen, we don’t recommend buying it against the main bearish trend. Strategy is waiting for the selling are to be reached at 1.1521 -1.1680 and then sell the pair . As the main trend is bearish, we expect the pair to find sellers at the blue box for a 3 wave pull back at least. As soon as the pull back reaches 50 Fibs against the last connector wave (X) blue, we should make our short positions risk free.


EURUSD 1 Hour Elliott Wave Analysis 11.13.2018
EURUSD has made proposed leg up and found sellers right at the blue box : 1.1521 -1.1680. We have already got decent reaction from the selling zone and calling recovery completed at 1.1546 high. Pull back reached 50 Fibonacci retracement against the (B) blue low. As a result members who took short trades are now enjoying profits with risk free positions. Now, as far as 1.1546 pivot holds, more downside should ideally follow. Currently the pair is correcting cycle from the mentioned peak when bounce should ideally complete at 1.1411-1.1457 area. Now we would like to see break below last short term low 1.1304 which will would be a confirmation of the bearish continuation.

Keep in mind market is dynamic and presented view could have changed in the mean time. Not every chart is Trading Signal. Best instruments to trade are those having incomplete bullish or bearish swings sequences. We put them in Sequence Report and best among them are shown in the Live Trading Room.


Elliottwave-Forecast

Master Trader
Feb 17, 2017
2,462
9
84
www.elliottwave-forecast.com
Elliott Wave view in EURAUD shows that the decline to 1.5337 low ended wave b. Rally from there unfolded as a 5 waves impulsive Elliott Wave structure. Up from 1.5337 low, Wave (1) ended at 1.5886, wave (2) ended at 1.566, wave (3) ended at 1.6453, wave (4) ended at 1.6184, and wave (5) ended at 1.6794. The 5 waves move from 1.5337 low ended wave ((1)) of a higher degree.

Pair is currently in wave ((2)) pullback to correct the rally from 12.3.2018 low (1.5337). The correction is expected to unfold in 3, 7, or 11 swing and potential area is 1.568 - 1.6069 (50 - 76.4% Fibonacci Retracement). While the dips stay above 1.5337, pair should then resume higher again. The move to 1.5337 also broke the previous high at 10.11.2018 (1.6357), therefore creating a bullish sequence from 2.22.2017 low favoring further upside.

EURAUD 4 Hour Asia Elliott Wave Chart


Elliottwave-Forecast

Master Trader
Feb 17, 2017
2,462
9
84
www.elliottwave-forecast.com
In this updated article and video below, we will follow up our view on Japanese Yen outlook in 2019.

We wrote an article in late December last year titled "Will Yen Continue to Outperform in 2019?" In the article, we said that Japanese Yen can continue to strengthen against other major currency pairs in 2019. In that article, we presented two daily technical charts below to backup our thesis: GBPJPY and CADJPY.

GBPJPY Daily Elliott Wave Outlook 12.27.2018


CADJPY Daily Elliott Wave Outlook 12.27.2018


Little did we expect that these two pairs will reach our daily target in just a few days after our article. The Yen pairs had a flash crash last Wednesday at 22.40 PM GMT. In just 8 minutes, the Yen appreciated more than 3% against the dollar. Not only against the dollar, the Yen also appreciated in similar magnitude and speed against other major and emerging market currencies.

Some financial media speculate a couple of possible reasons for the Yen flash crash. One possible reason was due to the thin liquidity during witching hour (5 - 6 pm EST). This is the time when New York traders leave the office and Tokyo traders arrive. Further exacerbating the thin liquidity, last Wednesday was also a public holiday in Tokyo. Another possible reason was due to Apple's sales warning after US stock market closed on Wednesday. However, the profit warning news came 1 hour before the Yen flash crash, casting some doubt how important Apple's warning was.

At EWF, we don't try to speculate or guess about fundamental reasons behind move in the market. After all, usually this is an after-the-fact exercise to find the "reasons." We believe that technical charts can and often speak very loudly about the expected path. After last week's flash crash, we have seen Yen pairs recovering nicely. As we reach our downside target in just the first week in 2019, the question is what's in store for Yen for the remainder of 2019? We will update our view and argue from the three technical charts below that last week was only the beginning of the Yen's strength and we will see further strength in Yen in 2019.

AUDJPY Weekly Elliott Wave Outlook 1.6.2019


During the Yen flash crash last week, AUDJPY broke below 6.24.2016 low (72.53) and now shows a 5 swing bearish sequence from 4.11.2013 high. The 5 swing sequence is based on 7 swing corrective sequence, also called a double three Elliott Wave structure (WXY). This suggests that as long as pair stays below swing #4 at 90.35, more downside is favored.

NZDJPY Weekly Elliott Wave Outlook 1.6.2019


NZDJPY weekly Elliott Wave sequence outlook above shows similar situation with AUDJPY. It is close to breaking below 6.24.2016 low (69.218). If pair breaks below that low, then it will also show a 5 swing bearish sequence from 12.29.2014 high, favoring further downside while rally fails below 7.27.2017 high (84.17).

USDJPY Daily Elliott Wave Outlook 1.6.2019


Finally, USDJPY Daily Elliott Wave sequence above shows that if it breaks below 3.26.2018 low (104.56), it will also show a bearish sequence from 12.15.2016 high, favoring further downside while rally fails below 10.4.2018 high (114.6). Both USDJPY and NZDJPY are close to taking out the previous low while AUDJPY already took it out. The technical outlook of these three Yen pairs suggest that we will continue to see Yen's strength in 2019.
 

Elliottwave-Forecast

Master Trader
Feb 17, 2017
2,462
9
84
www.elliottwave-forecast.com
Welcome traders, today we will look at a couple of Apple (APPL) charts. After plunging almost 10% on January 3rd, has the tech giant reached a bottom? And do we really have to depend on news to be on the right side of the market?. The following analysis will show you how profitable and efficient it can be to trade with our philosophy and basic Elliott Wave analysis.

First of all, we start with Apple's 45 minute chart from the 2nd of January 2018 presented to our members. At the time, we maintained a bearish perspective due to our Elliott Wave analysis. Our count suggested an impulsive 5 wave move cycle starting from October the 3rd. Consequently, with a proposed wave IV top, a final wave V was to start developing at any time.

With our aggressive approach, our members are encouraged to act accordingly with the right side of the market. With this being said, our members had no reason whatsoever to enter a long position in the near term for Apple. The stock missed equal leg target area off ((W)) - ((X)) from 12.25.2018 low by $2 and ended wave IV correction at $159.49

APPL 01.03.2018 45 Min Chart Elliott Wave Analysis


Below you can see an updated chart of APPL from January 6 presented to our members. Although our Elliott Wave count changed, our stance proved extremely valuable. Now we believe the decline from last week is part of a more complex nest within wave III. Nevertheless, it is still within the cycle from October 3rd favoring the continuation of further downside.

Patience and continuous adaptation to the market moves, now presents us with an opportunity to profit. We now have a blue box target area of 152.4-156.48 which represents an equal leg target area off of ((W)) & ((X)). Sellers should appear in this area and push the stock lower or pullback in 3 waves at least. A mapped entry, an invalidation level set up, the right side, add up to great trading opportunities. Above all, waiting for the right signals, puts the odds on our favor.

APPL 01.06.2018 45 Min Chart Elliott Wave Analysis


*Note : Keep in mind the market is dynamic and the presented view might have changed after the post was published.

Trading success is a journey and you will never be perfect at it, but you can always master your reaction to the market.