BA and the Trade Tensions Between China and Elliott wave
As we all are well aware there are definitely heightened tensions on the global trading playing field these days. The markets have been whipping back in forth in exacerbated moves. Every hint or tweet about anything to do with trade, specifically, trade and China causes fireworks in the market. Boeing Co ( NYSE: BA ) has been in the news as well for numerous reasons about trade. Boeing is being accused of circumventing U.S. trade regulations by means of entertaining a controversial satellite order. The order was financed by a Chinese government-owned firm.
Boeing canceled the order after much scrutiny and backlash due to the sensitive nature of the satellite technology that is also employed by the U.S. military. Times are tense to say the least. Tense times bring out emotions and emotions bring out volatility in the markets. Volatility gives us as traders opportunities. Are there any opportunities near in BA?
BA, XLI, and Elliott Wave

BA carries an 8.24% weighting as the major component of the Industrial Select Sector SPDR ETF (XLI). So I thought it would be curious to analyze the stock and see what the waves are telling us.
If we did come to a conclusion to buy BA what price or price range makes sense? In times like these I like to find stocks with clear Elliott wave patterns for clues about anticipated outcomes or to help with a correlated trade. I think BA has a clear structure on the higher time frames.
The Wave Count for BA

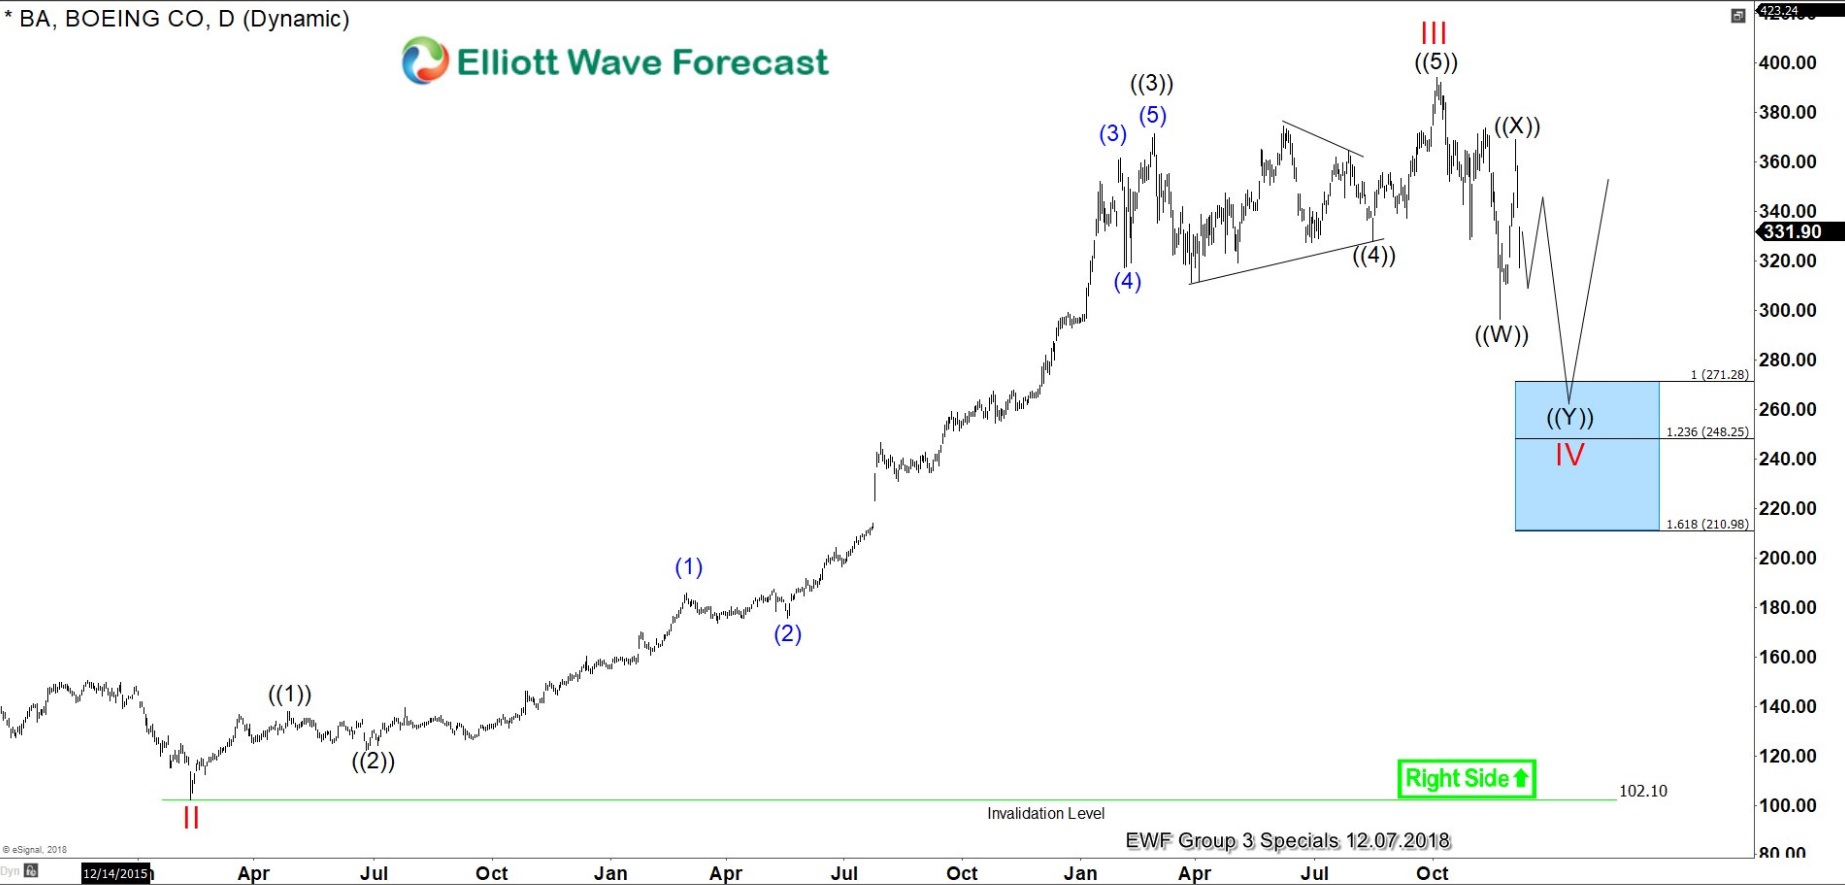
BA has progressed from a single digit stock in the 1980s to reach a high of $107.83 in July 2007. We are calling that top Super Cycle degree wave I (in blue). From $107.83 BA progressed lower in Super Cycle degree wave II (in blue) to a low of $31.40 during February of 2009 when basically everything bottomed during the end of the financial crises.
BA bottomed as well and moved higher in Cycle degree wave I (in red) to $158.83 in February of 2015. Almost an exact year later in February 2016 BA corrected lower to $102.10 to complete Cycle degree wave II (in red). From there it completed another set of first and second waves. This time however it was Primary degree wave ((1)) at the $137.89 high of April 2016 and Primary degree wave ((2)) at the $122.35 low of June 2016.This mean that BA was about to enter the most powerful wave cycle in its history as a 3rd wave on multiple degrees.
Practitioners of Elliott wave analysis are well aware of the power of 3rd waves and this one was no different. From $122.35 BA continued higher three more Primary degree waves to complete the Cycle degree wave III (in red) on October 3, 2018 to an all-time high of $394.28.

So What's Next?
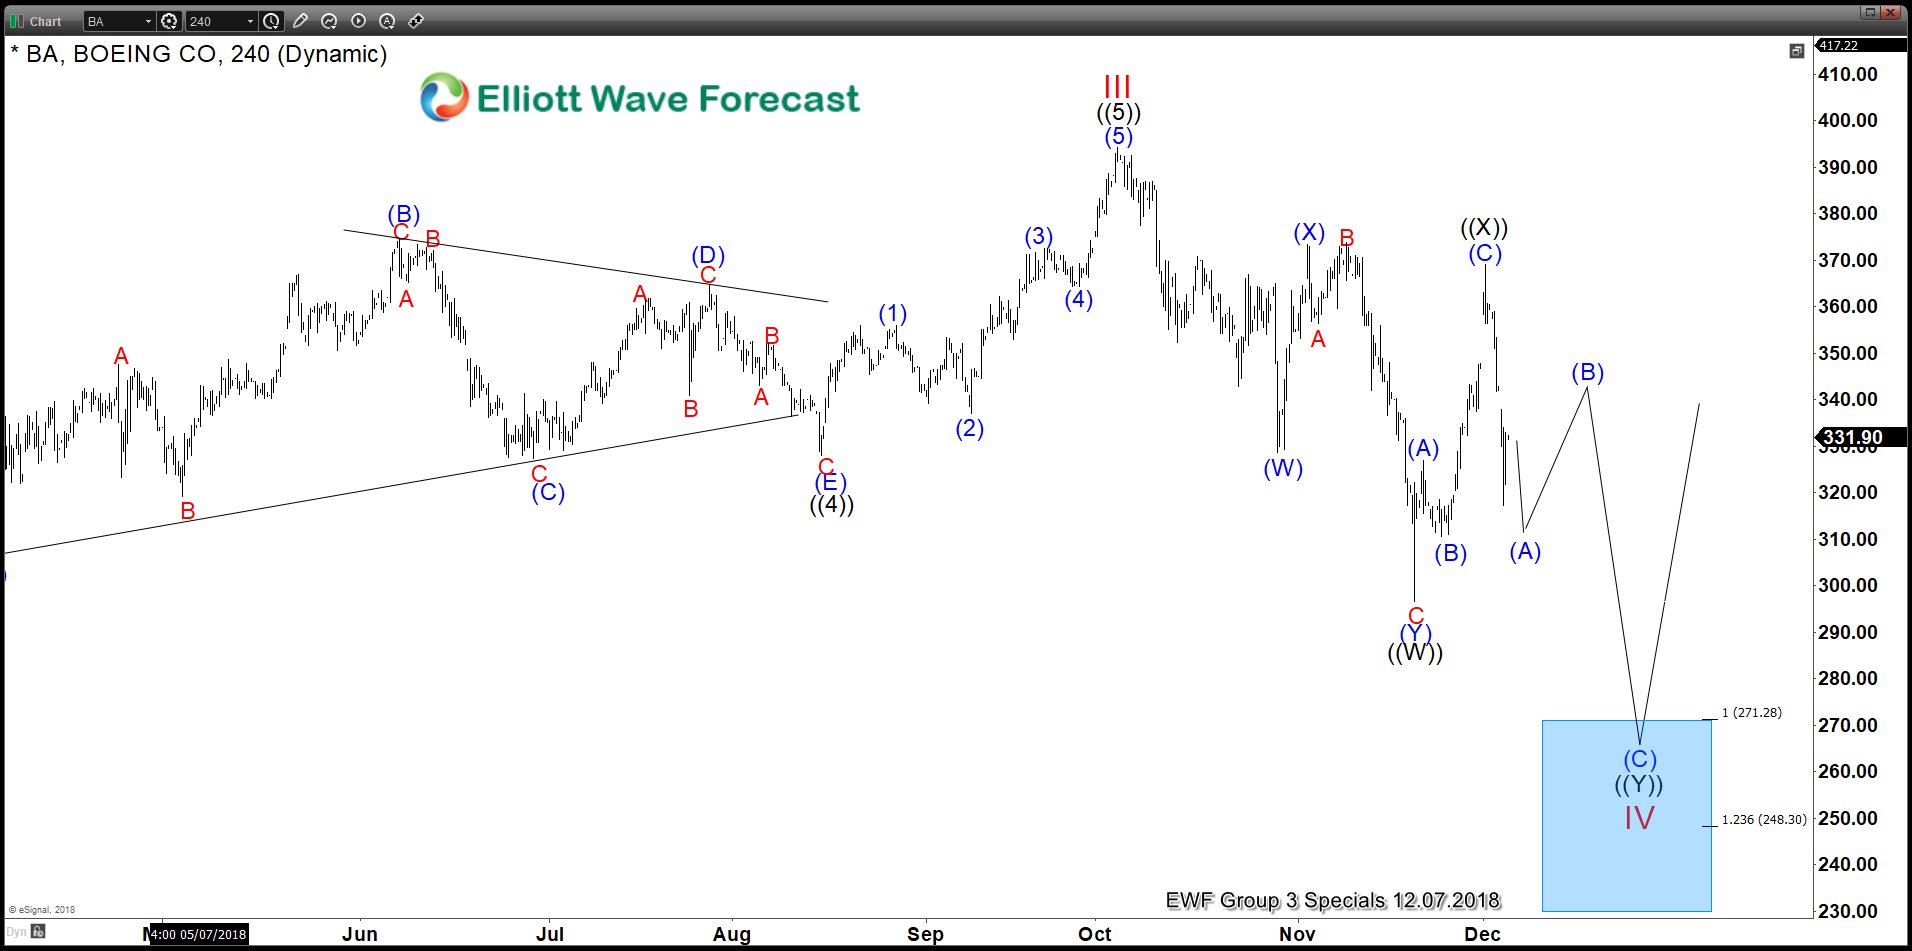
BA is now progressing lower as a proposed double-three correction in Primary degrees ((W)), ((X)), and ((Y)) to complete the Cycle degree wave IV . In the chart below we see from the $394.28 high Primary degree wave ((W)) played out in 3 waves.
Intermediate degree wave (W) (in blue) to the $328.63 low on 10/29/2018. BA then proceeded higher in Intermediate degree wave (X) to $373.39 on 11/02/2018. Intermediate degree wave (Y) then brought prices lower to $296.61 on 11/20/2018 to complete Primary degree wave ((W)).
From the November low BA progressed higher in three waves to $369 on 12/03/2018 that we are proposing is the end of Primary degree wave ((X)).

Where to Look for a Low
The ideal price area for BA to find a low and thus provide us with a target area to go long lies in the blue highlighted area in the chart above. This area signifies the likely endpoint as the length of Primary degree wave ((W)) from the all-time highs projected from the top of Primary degree wave ((X)).
The blue box is an area of high probability that a turn will occur or at least bounce high enough to get in a risk-free position relatively quickly or capture a profitable trade regardless of the accuracy of the wave count.
This measured move should take the last leg of ((Y)) between $271.30 - $211. So, that's where we would like to start building longs to target back above $394.28 in Cycle degree wave V.
Trade Safe,
James
As we all are well aware there are definitely heightened tensions on the global trading playing field these days. The markets have been whipping back in forth in exacerbated moves. Every hint or tweet about anything to do with trade, specifically, trade and China causes fireworks in the market. Boeing Co ( NYSE: BA ) has been in the news as well for numerous reasons about trade. Boeing is being accused of circumventing U.S. trade regulations by means of entertaining a controversial satellite order. The order was financed by a Chinese government-owned firm.
Boeing canceled the order after much scrutiny and backlash due to the sensitive nature of the satellite technology that is also employed by the U.S. military. Times are tense to say the least. Tense times bring out emotions and emotions bring out volatility in the markets. Volatility gives us as traders opportunities. Are there any opportunities near in BA?
BA, XLI, and Elliott Wave
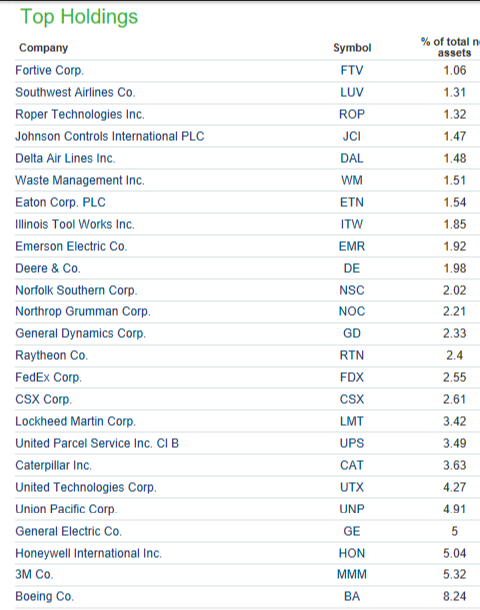
BA carries an 8.24% weighting as the major component of the Industrial Select Sector SPDR ETF (XLI). So I thought it would be curious to analyze the stock and see what the waves are telling us.
If we did come to a conclusion to buy BA what price or price range makes sense? In times like these I like to find stocks with clear Elliott wave patterns for clues about anticipated outcomes or to help with a correlated trade. I think BA has a clear structure on the higher time frames.
The Wave Count for BA
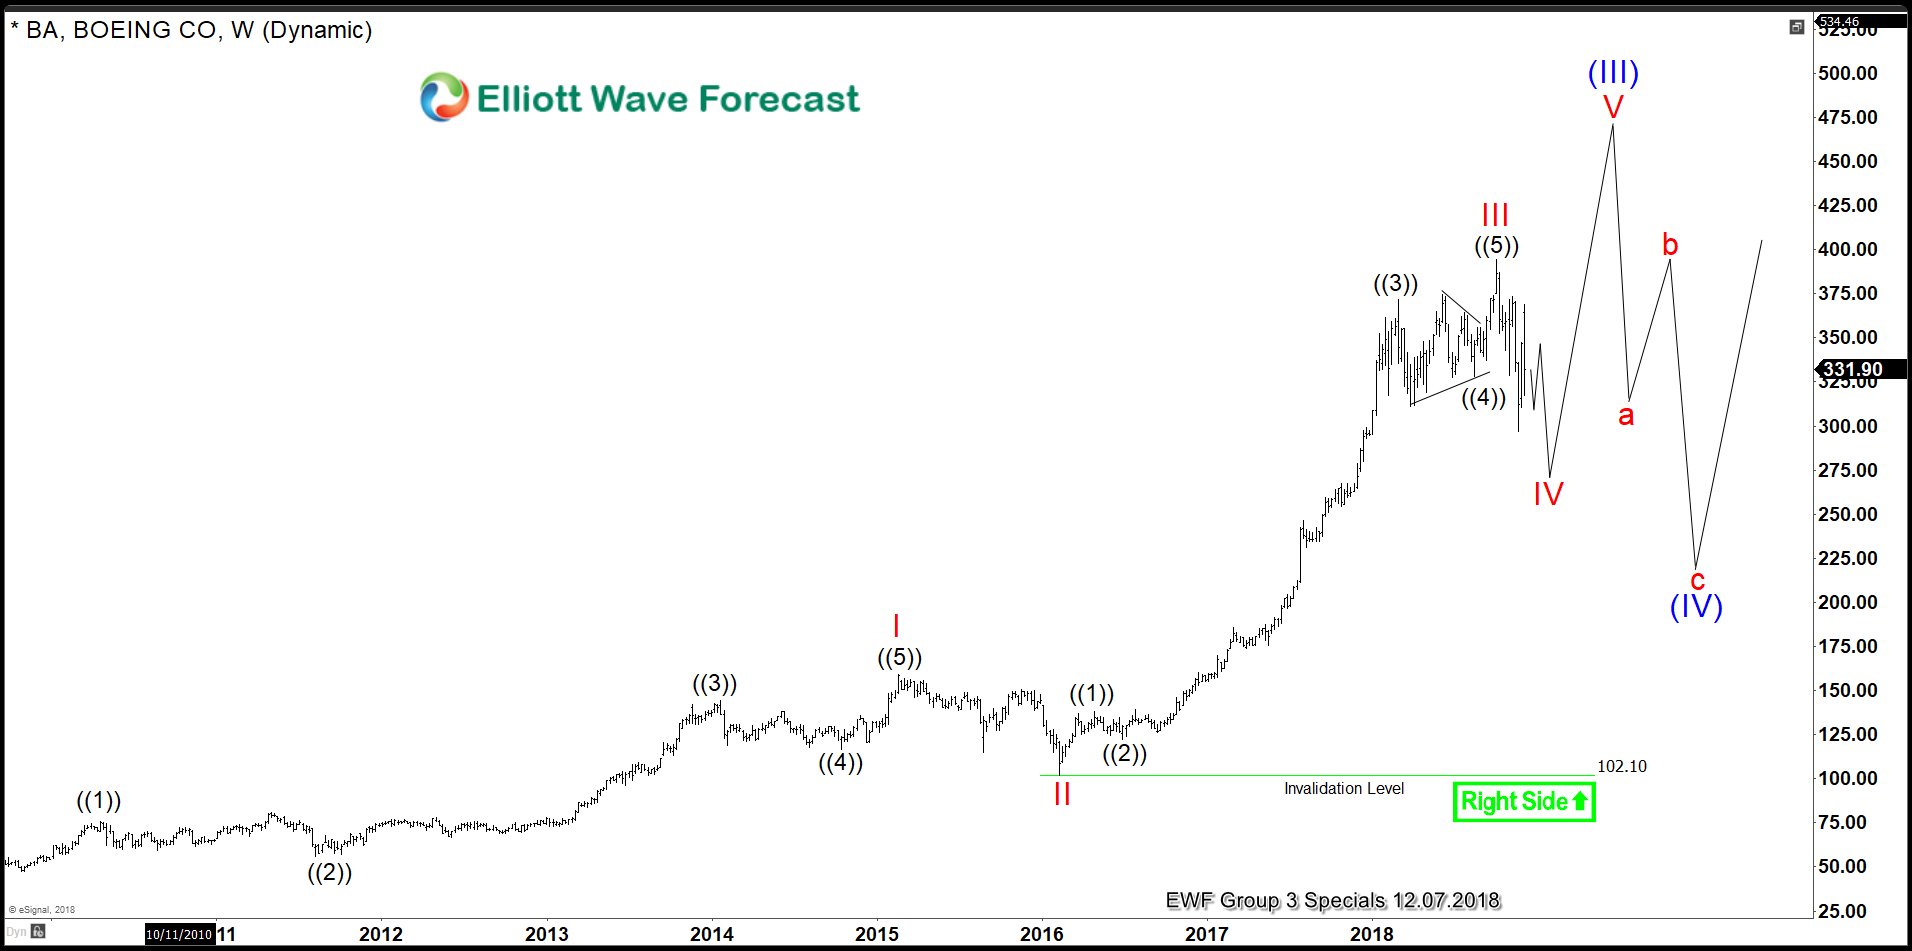
BA has progressed from a single digit stock in the 1980s to reach a high of $107.83 in July 2007. We are calling that top Super Cycle degree wave I (in blue). From $107.83 BA progressed lower in Super Cycle degree wave II (in blue) to a low of $31.40 during February of 2009 when basically everything bottomed during the end of the financial crises.
BA bottomed as well and moved higher in Cycle degree wave I (in red) to $158.83 in February of 2015. Almost an exact year later in February 2016 BA corrected lower to $102.10 to complete Cycle degree wave II (in red). From there it completed another set of first and second waves. This time however it was Primary degree wave ((1)) at the $137.89 high of April 2016 and Primary degree wave ((2)) at the $122.35 low of June 2016.This mean that BA was about to enter the most powerful wave cycle in its history as a 3rd wave on multiple degrees.
Practitioners of Elliott wave analysis are well aware of the power of 3rd waves and this one was no different. From $122.35 BA continued higher three more Primary degree waves to complete the Cycle degree wave III (in red) on October 3, 2018 to an all-time high of $394.28.
So What's Next?
BA is now progressing lower as a proposed double-three correction in Primary degrees ((W)), ((X)), and ((Y)) to complete the Cycle degree wave IV . In the chart below we see from the $394.28 high Primary degree wave ((W)) played out in 3 waves.
Intermediate degree wave (W) (in blue) to the $328.63 low on 10/29/2018. BA then proceeded higher in Intermediate degree wave (X) to $373.39 on 11/02/2018. Intermediate degree wave (Y) then brought prices lower to $296.61 on 11/20/2018 to complete Primary degree wave ((W)).
From the November low BA progressed higher in three waves to $369 on 12/03/2018 that we are proposing is the end of Primary degree wave ((X)).
Where to Look for a Low
The ideal price area for BA to find a low and thus provide us with a target area to go long lies in the blue highlighted area in the chart above. This area signifies the likely endpoint as the length of Primary degree wave ((W)) from the all-time highs projected from the top of Primary degree wave ((X)).
The blue box is an area of high probability that a turn will occur or at least bounce high enough to get in a risk-free position relatively quickly or capture a profitable trade regardless of the accuracy of the wave count.
This measured move should take the last leg of ((Y)) between $271.30 - $211. So, that's where we would like to start building longs to target back above $394.28 in Cycle degree wave V.
Trade Safe,
James