Elliottwave-Forecast

Master Trader
Feb 17, 2017
2,426
9
84
www.elliottwave-forecast.com
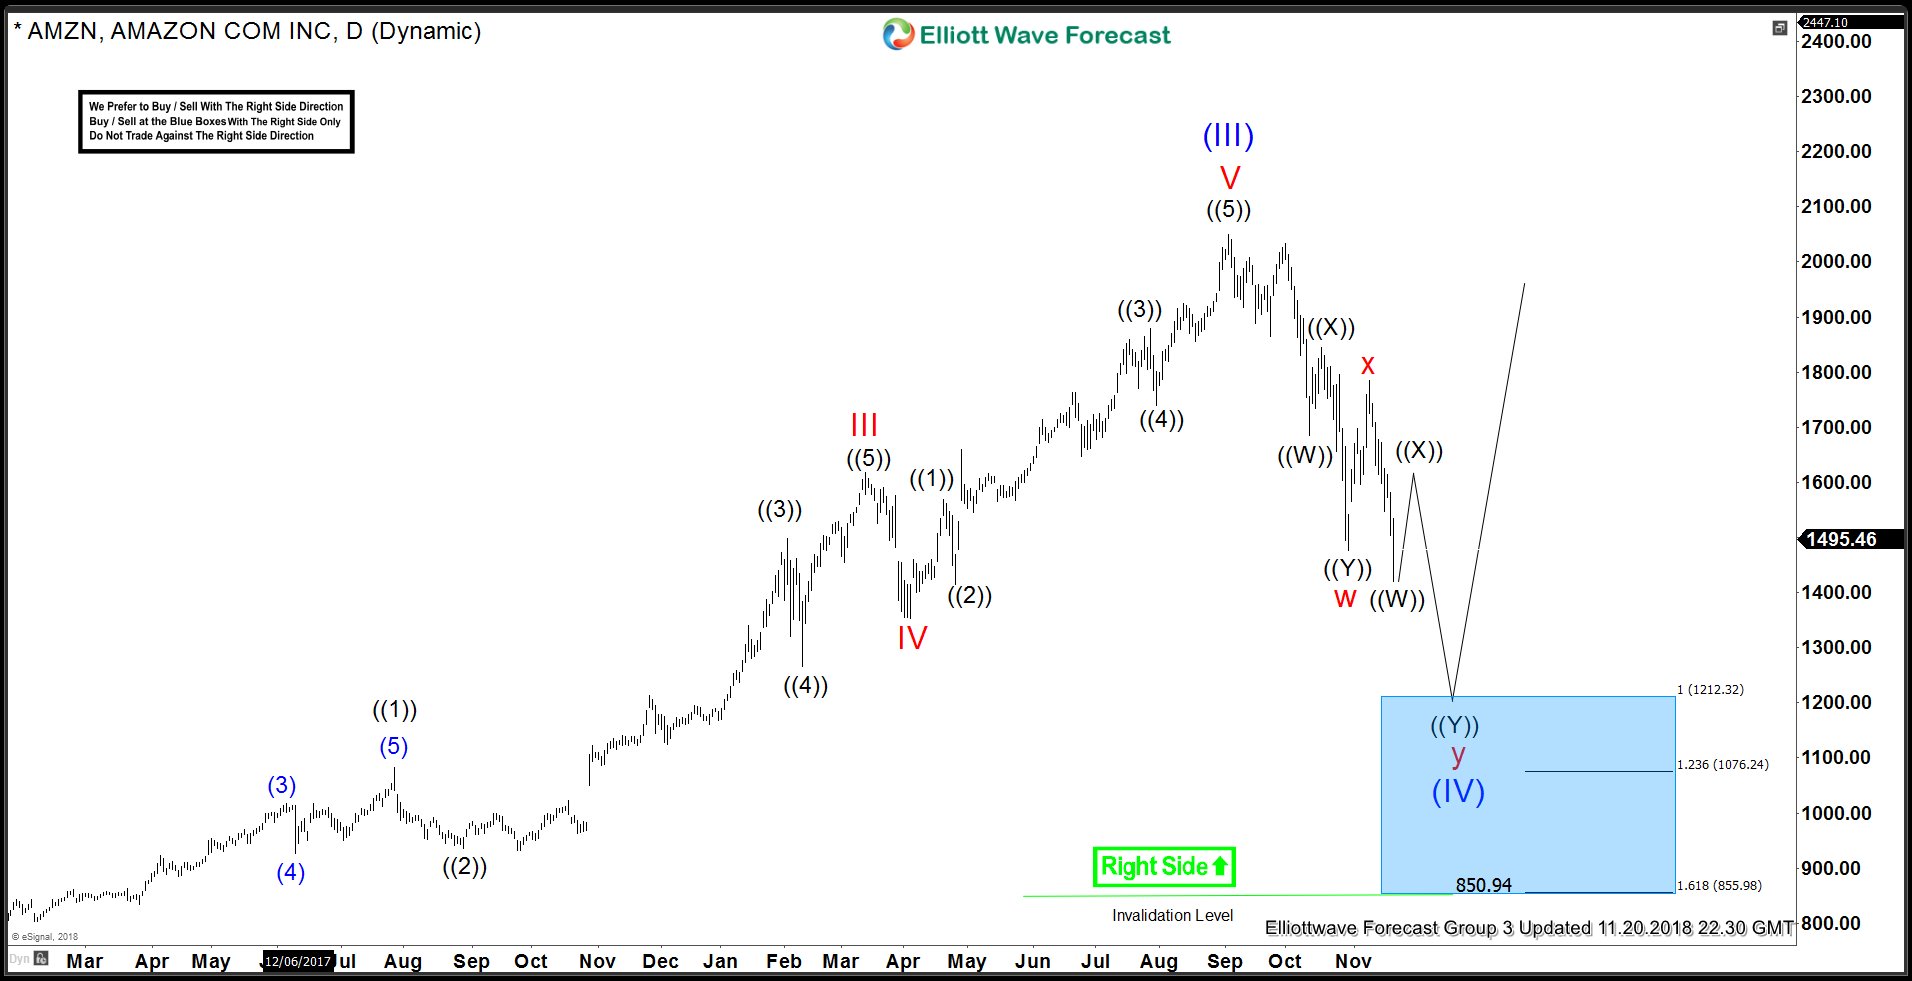
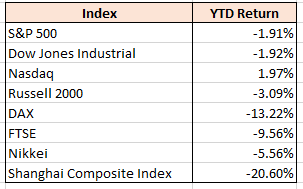
We recently wrote an article explaining why Mr Jeff Bezos had nothing to worry about after being down $45B in October's market sell off and also stated the obvious fact that trend in Amazon (AMZN) is up and pull backs are a buying opportunity. AMZN reached our blue box area starting from $1477 at the end of October and buyers were waiting there as expected. We keep mentioning that once a blue box is reached, two things can happen, either the trend will resume or there will be a minimum 3 waves reaction from the blue box to allow the longs to eliminate risk on the trade by trailing stops or booking partial profits and then trailing stops. Amazon bounce quickly reached 50% Fibonacci retracement of the decline from 9/4/2018 peak which was good enough for the longs from $1477 to get risk free. However, sellers have managed to push price below 10/30/2018 low which creates an incomplete 5 swings sequence down from 9/4/2018 peak. Let's take a look at the chart below

Amazon (AMZN) Elliott Wave Analysis - Daily Time Frame

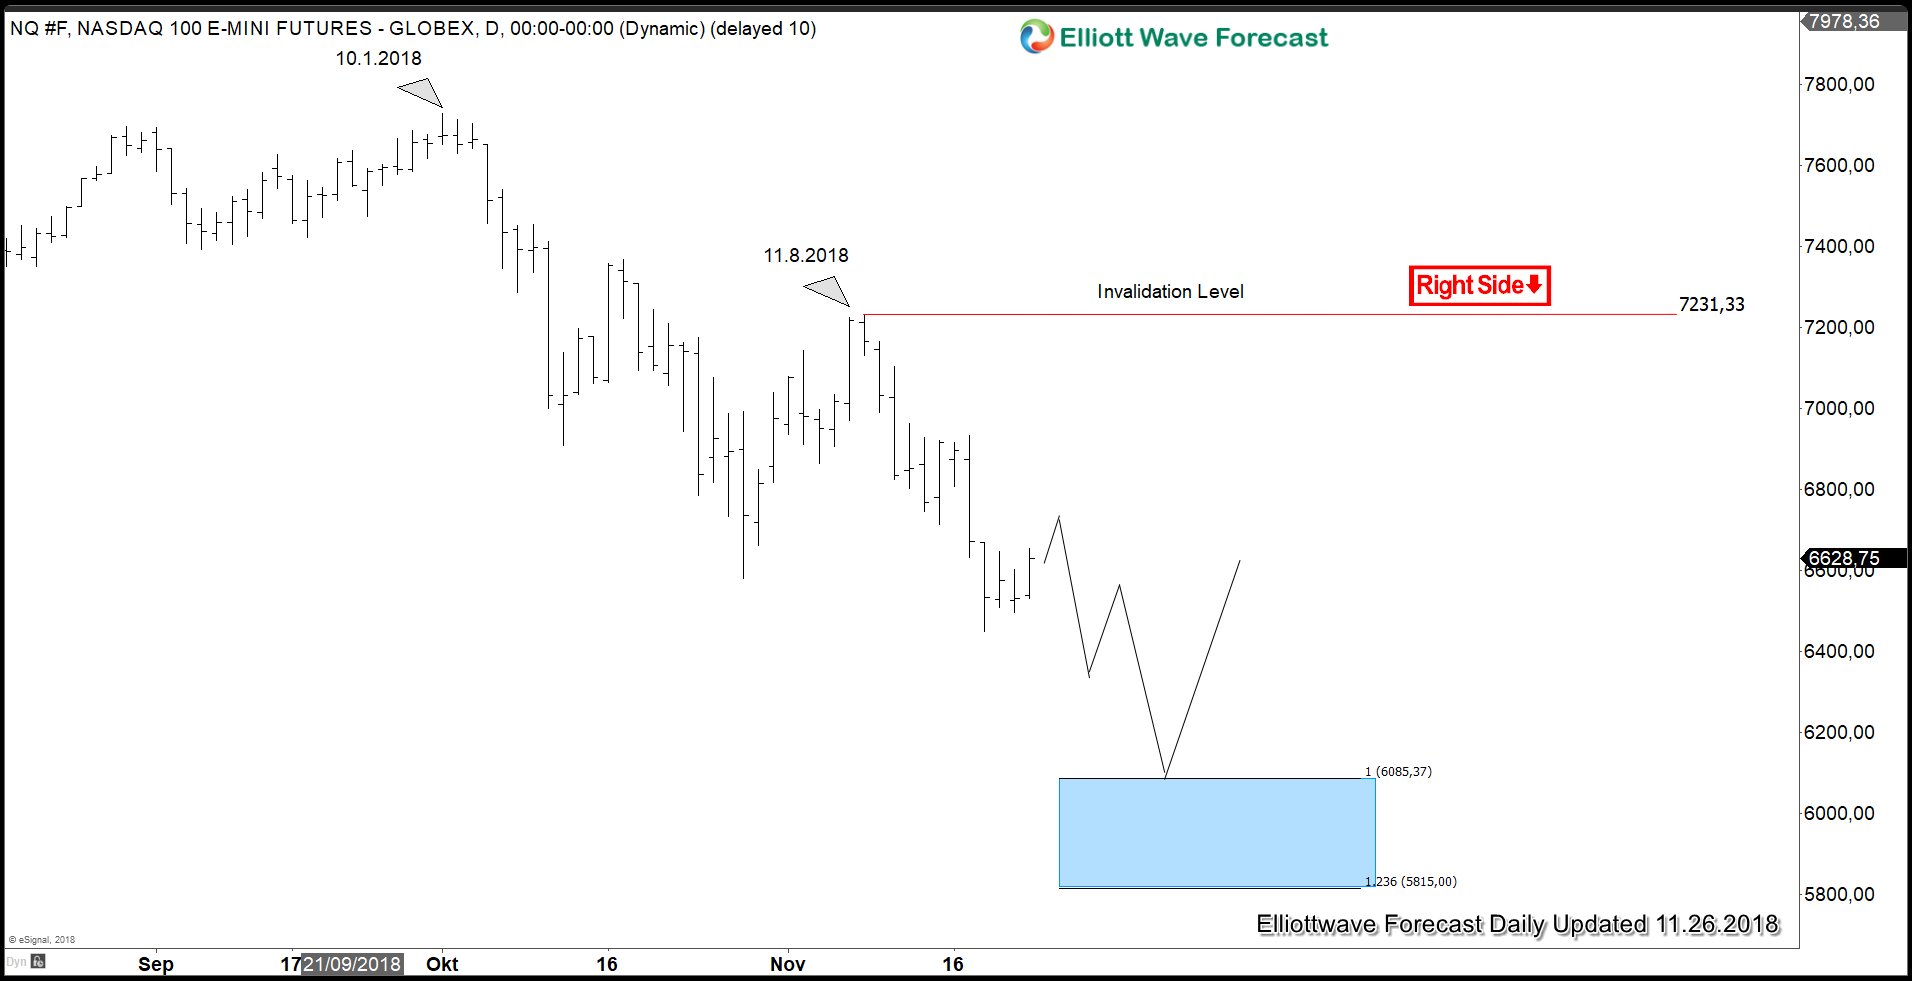
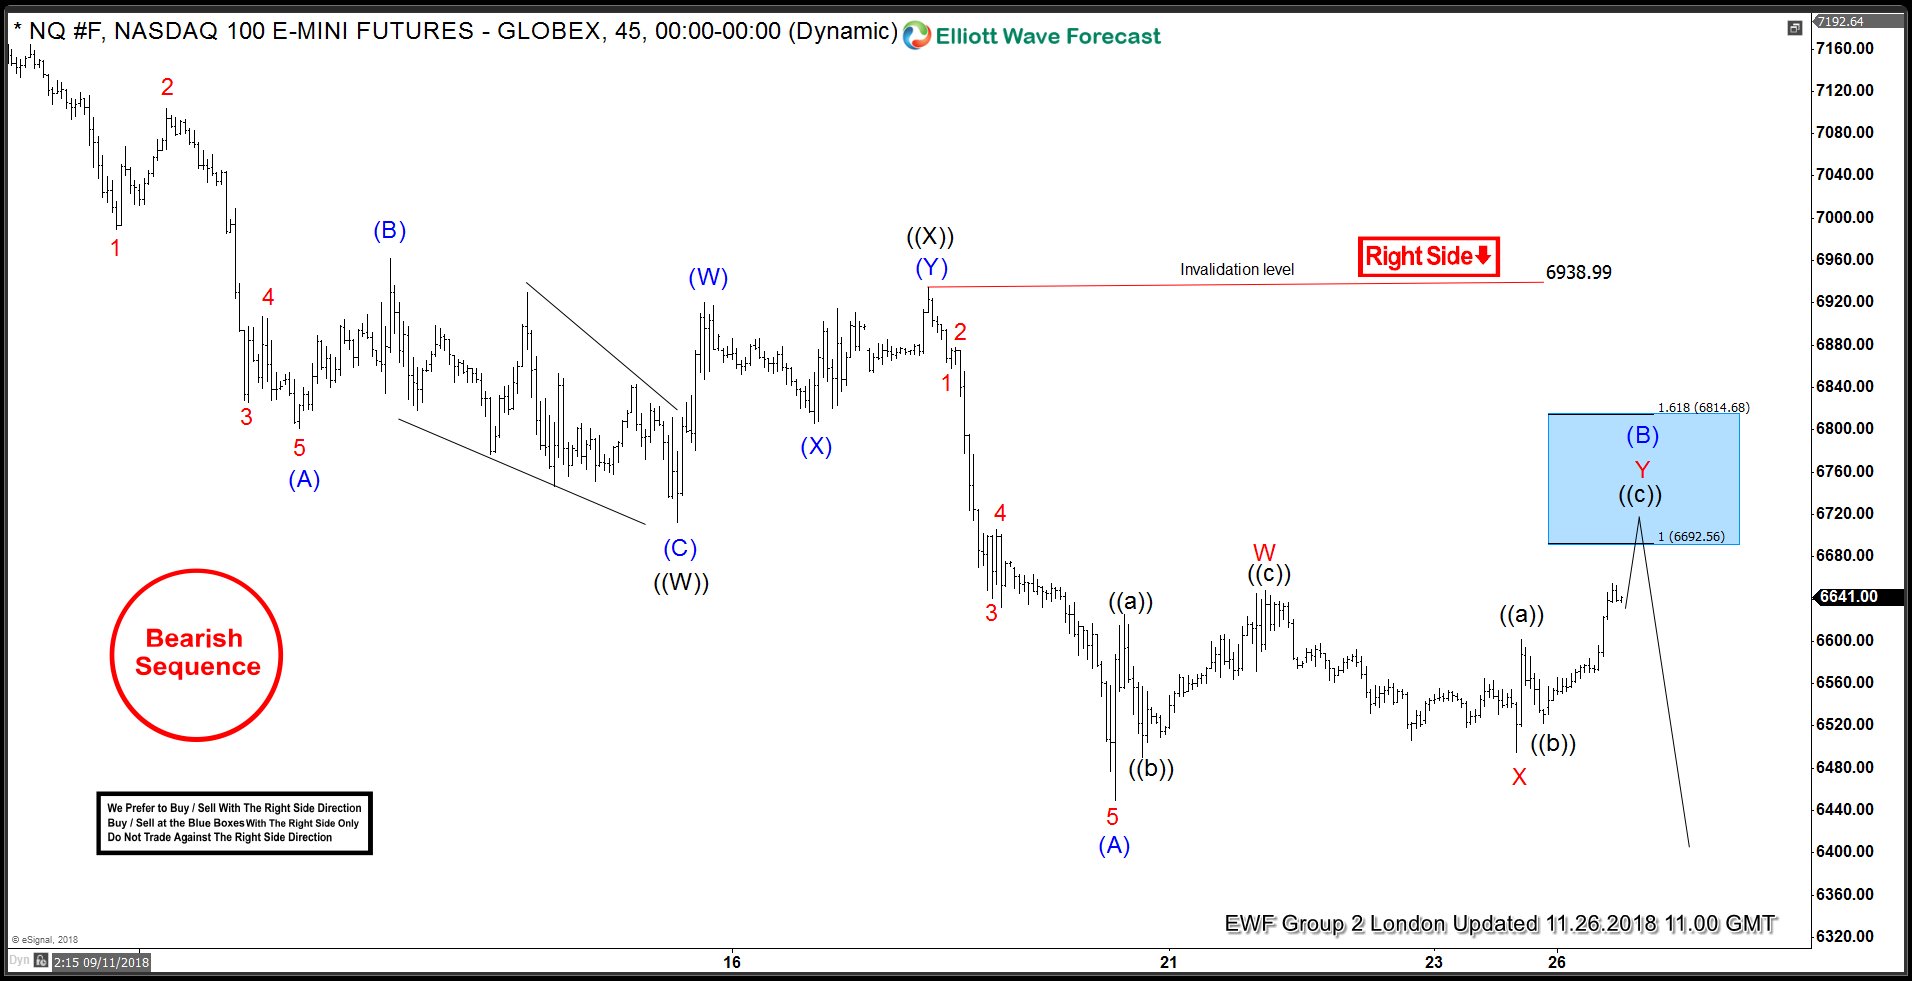
Break below 10/30/2018 low opens up extension lower in Amazon stock. Cycle from red x peak at 11/8/2018 has either already ended at 1420 or would end between 1420 - 1348.39 followed by a bounce which should fail below 11/8/2018 (1784) for another sell off toward 1212.32 - 855.98 area to complete a double three Elliott wave structure down from 9/4/2018 peak. Wave ((X)) bounce should see short-term sellers appearing in the sequence of 3, 7 or 11 swings while area between 1212.32 -855.98 should attract swing traders as that's where we have our blue box and to add to that, at 1212.32, Amazon would have lost 40% of it's value from the all time high of 2050 in September 2018 which means sentiments would be extremely bearish and that should further add to the bullishness of AMZN stock in the above mentioned area.


Elliottwave-Forecast

Master Trader
Feb 17, 2017
2,426
9
84
www.elliottwave-forecast.com
CADJPY short-term Elliott wave view suggests that a bounce to 87.00 on 11/08/2018 high ended intermediate wave (X). Down from there, the decline unfolded as double three structure where Minute wave ((w)) ended at 85.44 low as zigzag structure. A bounce to 86.35 ended Minute wave ((x)). Then a decline to 84.61 low ended Minute wave ((y)) & completed the Minor wave W lower. Also, with this push lower pair made a new low below 10/26/2018 low (84.83). Which made the sequence from 10/02/2018 peak incomplete to the downside favoring more downside against 11/08/2018 peak (87).

Up from 84.61 low, pair is correcting the cycle from 11/08/2018 peak in wave X which is expected to take the form of a double three structure and should ideally reach 86.18 -86.78 area Afterwards, the pair is expected to resume the downside provided the pivot at 11/08/2018 peak (87) stays intact or should produce a 3 wave reaction lower at least. We don’t like buying the pair and expect sellers to appear in the blue box as far as pivot at 87.00 high remains intact.

CADJPY 1 Hour Elliott Wave Chart


Elliottwave-Forecast

Master Trader
Feb 17, 2017
2,426
9
84
www.elliottwave-forecast.com
Hello fellow traders. In this technical blog we’re going to take a quick look at the Elliott Wave charts of USDX published in the members area of The Website. As our members know, USDX has incomplete bullish sequences. Break of August 15th peak has made the structure incomplete to the upside, suggesting the USDX is bullish against the 93.79 low. The index has been bullish against the 95.67 low. Consequently, we advised our members to avoid selling it, keep favoring the long side. In the further text, we’re going to explain the Elliott Wave Structure and Forecast.

USDX 1 Hour Elliott Wave Analysis 11.16.2018

Back then USDX has had a short-term cycle from the 93.79 low incomplete as well. The Index has been bullish against the 95.67 low. As we can see on the chart below, our forecast suggests the price is ending the pull back against the 95.67 low. Equal legs is already reached at 96.42-96.19 ( blue box- buyers area). Due to previous incomplete bullish sequences, we knew that buyers should ideally appear for a 3 wave bounce at least. We don’t recommend selling the Index and favor the long side against the 95.67 low in the first degree and against the 93.79 low in the second degree.


USDX 1 Hour Elliott Wave Analysis 11.24.2018

Eventually, the price has broken 95.67 pivot that tweaked Elliott Wave Count a little bit that now suggests a current pullback is correcting the 93.79 cycle. Anyway, the index still remains bullish against the 93.79 low. The price has reached buyers zone ( blue box ) at 96.42-95.83. Buyers have appeared shortly after and we are getting nice bounce so far. Now we’re calling wave ((2) pullback completed at 96.06 low. However, we need to see a break above 11/12 peak to get confirmation that next leg higher is in progress. Until we get that break, buying short-term dips against the 96.06 low is not recommended. If USDX breaks that short-term low, we would be doing double correction lower from the 11/12 peak.

Note: Market is dynamic and presented view could have changed in the meantime. Best instruments to trade are those having incomplete bullish or bearish swings sequences. We put them in Sequence Report and best among them are shown in the Live Trading Room.


Elliottwave-Forecast

Master Trader
Feb 17, 2017
2,426
9
84
www.elliottwave-forecast.com
Global Indices continue to retreat in the fourth quarter of this year as the combination of Fed’s quantitative tightening and escalating trade wars threatens to derail the 10 year bullish market. Below is the Year-to-Date return of the Global Indices as of Friday Nov 24:


Next week, global Indices will have a chance to find support if the U.S. and China are able to bridge their differences in G20 meeting. Beijing and Washington have engaged in an escalating tit-for-tat trade war since this summer. The U.S imposed tariffs on Chinese goods worth US $250 billion per year, while China imposed tariffs on U.S. goods worth US $110 billion. The IMF warned that rising trade tensions could cost the global economy $430 billion and lower global growth by as much as 0.5% by 2020.


President Trump and Xi will meet on the sidelines on Nov 31 and Dec 1 in Argentina at G20 summit to try to strike a deal. President Trump has threatened to increase the tariffs on $200 billion Chinese imports from 10% – 25% starting January next year if there’s no agreement. On the other hand, China does not show any willingness to bend the knee and lose face. The summit will be an opportunity to broker ceasefire and avoid further escalation, although it remains to be seen if it can reverse the previously announced tariffs.

Should there be a truce made, global Indices can see support after the current selloff is over and see at least a 3 waves rally. However, if the meeting fails to produce any deal, then global Indices could continue to see weakness until the end of the year.

Nasdaq Daily Outlook suggests lower stock market


Despite still showing positive YTD return, Nasdaq has pull back 16% from the peak of 2018 in less than 2 months. The Index shows incomplete bearish sequence from 10.1.2018 high favoring further downside to 5815 – 6085 blue box as far as near term rally stays below 7231.3. We should expect the Index to continue lower next week towards the blue box. If the Index has reached the box prior to the G20 meeting and the outcome is positive, then it can trigger at least a 3 waves rally from the box to at least correct the decline from 10.1.2018 peak.

Nasdaq Short Term Elliott Wave Outlook


Nasdaq shows an incomplete bearish sequence from 10/1 peak (7728.7) as indicated by the bearish sequence stamp and red color right side stamp on the charts. Decline from 10/1 peak is unfolding as a double three Elliott Wave structure where Cycle degree wave W ended at 6580.5 and Cycle degree wave X ended at 7231. Minor wave Y remains in progress, and down from 7231, Primary wave ((W)) ended at 6712.25 and Primary wave ((X)) ended at 6938.99. Near term, while bounces stay below there, and more importantly below 7231, expect the Index to extend lower.
 

Elliottwave-Forecast

Master Trader
Feb 17, 2017
2,426
9
84
www.elliottwave-forecast.com
Cycle from Sept 24 high (1.182) in EURUSD remains in progress as an Elliott Wave impulse structure where Primary wave ((1)) ended at 1.1214 and Primary wave ((2)) is proposed complete at 1.147. Pair, the decline from 1.147 is unfolding in what looks like a leading diagonal Elliott Wave structure.Near term still needs to break below Primary wave ((1)) at 1.1214 to validate this view. Until then, we still can't rule out a double correction in Primary wave ((2)) in the form of WXY.

Down from 1.147, Minor wave 1 ended at 1.1356, Minor wave 2 ended at 1.1434, Minor wave 3 ended at 1.1325, and Minor wave 4 ended at 1.1384. Pair at 1.147 high stays intact.pivot swing as far as 3-7-11, it should bounce in Intermediate wave 2 to correct cycle from 11/20 high (1.147) in before the decline resumes. We don't like buying the pair and expect sellers to appear in Afterwards should soon end Minor wave 5 which also completes Intermediate wave (1).

If pair breaks above proposed Primary wave ((2) at 1.147, then it's doing a double correction and can open further upside towards 1.16 area before the decline resumes. If this happens, we still expect pai at 9/24 high (1.1815) stays intact.pivot to extend lower or at least pullback in 3 waves from 1.16 area as far as

EURUSD 1 Hour Elliott Wave Chart

main-qimg-6d5cffd4426b623079a8326b7abbe708


main-qimg-485be72c69ea45dfdc410d921f85ad16
 

Elliottwave-Forecast

Master Trader
Feb 17, 2017
2,426
9
84
www.elliottwave-forecast.com
In this blog, I want to share some short-term Elliott Wave charts of Copper which we presented to our members in the past. Below, you see the 1-hour updated chart presented to our clients on the 10/20/18 indicating that Copper ended the cycle from 09/21/18 peak in red wave W at 11/01/18 low (2.6435).

As Copper ended the cycle from 09/21/18 peak, we expected a bounce to occur in red wave X. Above from that low 11/01/18 low (2.6435), the bounce unfolded in an Elliott Wave flat structure. We advised members that Copper ideally should continue lower. Therefore, we expected sellers to appear in the sequences of 3, 7 or 11 swings. At the 100 - 1.236 Fibonacci extension of black ((a))-((b)) which came at around 2.8458-2.8894 area and that was the first area for sellers to appear.

Copper 11.20.2018 1 Hour Chart Elliott Wave Analysis


In the last Elliott Wave chart, you can see that the metal reached the blue box area (2.8458-2.8894) and reacted lower and also is close took price below red wave W low. If traded our blue box area shown in the chart above. Then, any trades from that area were risk-free, which means the stop-loss should be moved to break even, targeting lower levels. Do please keep in mind that the 1-hour chart which I presented may have changed already. This blog should just illustrate how accurate our blue boxes are, and how our members trade our 3-7 or 11 swings strategy.

Copper 11.27.2018 1 Hour Chart Elliott Wave Analysis


Elliottwave-Forecast

Master Trader
Feb 17, 2017
2,426
9
84
www.elliottwave-forecast.com
Short term Elliott Wave View in Amazon (ticker: AMZN) suggests that the bounce to 1784 ended Cycle degree wave x. Cycle degree wave y is currently in progress lower as a double three Elliott Wave structure. Down from 1784, Primary wave ((W)) ended at 1420 and Primary wave ((X)) bounce is in progress towards 1631.54 - 1712.09 area before the decline resumes. Internal of Primary wave ((W)) unfolded as a zigzag where Intermediate wave (A) ended at 1546.51, Intermediate wave (B) ended at 1624.82, and Intermediate wave (C) ended at 1420.

Internal of Primary wave ((X)) is unfolding as a double three Elliott Wave structure where Intermediate wave (W) ended at 1550 and Intermediate wave (X) ended at 1502.10. Expect the stock to extend higher in Intermediate wave (Y) of ((X)) towards 1631.54 - 1712.09, then as far as pivot at 1784 high stays intact, the stock should extend lower or pullback in 3 waves at least. We don't like buying the proposed rally.

AMZN 1 Hour Elliott Wave Chart


Elliottwave-Forecast

Master Trader
Feb 17, 2017
2,426
9
84
www.elliottwave-forecast.com
The SPX Index is trading within a Blue Box in our system, these boxes are areas in which the Market needs to define whether it will become an Impulsive sequence which runs in 5-9-13 waves or corrective sequence in which runs in 3-7-11 waves. Many traders who follow The Elliott wave Theory understand the idea of 5 waves followed by 3 waves back as shown in the following chart.


An impulse is 3 advances of 5 waves and 2 pullbacks in 3 waves which make a total of 5 swings. On the other hand, an ABC structure only shows 2 advances of 5 waves and one pullback in 3 waves. It is shown in the following chart.


The difference between an Impulse and ABC is the extension within wave (III) which the SPX Index is not showing at this moment. We are an Elliott Wave Forecasting company but we have developed many other techniques that we use in our analysis and one of them is called the Blue Box system which is based on high-frequency trading. Market is not the same as it was back in 1930's and hence Elliott Wave needs adjustment in current times. Consequently, we developed a system with rules which we added to the Elliott Wave's basic rules which are available at our website. For us, it is really simple, as far as price is above the 100% extension of the first leg i.e. (a) / ( ( I ) related to ( b ) / (II ) but below the 1.618 extension of the same two points, the Market is within a twilight area. In this area, either side could end up being a winner. The following chart shows the Grand Supercycle of the S&P 500 Index which is showing a possible ABC structure and the Grand Supercycle Blue Box area.

SPX Quarterly Elliott Wave Analysis 11/27/18


We do understand that the market makers need to decide in which direction we are heading. Whether we are going to trade above the 3180 area or correct the Grand Super cycle which should be a similar correction to the one from 2000-2009. In that case, a huge peak has been reached. At this moment the Index is trading below the 1.618 Fibonacci extension which is at 3180 but still holding above the trend line from 2009 lows which means we can still be within the powerful wave (III) and finally break the Blue Box to the upside, as shown in the following chart and that is our current view as well.

SPX-WEEKLY20181128200420.jpg


As we always do, we do not forecast tops or bottom at Elliottwave-Forecast but we always understand the areas in which we are trading. We have been recommending trading the long side since 2010 and we still recommend the long. But with caution and always in the sequence of 3-7-11 swings which is the corrective sequence of the Market. All we got is an ABC from the all-time lows into the blue box within the Grand Supercycle and Bulls need to extend the Supercycle degree from 2009 to break the 3180. Then the Market will extend in a series of (IV) and (V). There is no question that we are in dangerous times but knowing the nature will help an investor to navigate in such choppy waters where either side can make the case for a victory. Let's see who is stronger and will win. So far the bulls are still in control and nothing in price and distribution is calling that the Grand supercycle has ended. As far as it stays above the trendline, it is a 4-hour correction and should be bought in 7 or 11 swings. The Index already did 3 waves from the peak and could continue to new highs from here, if it does 7 swings lower, should be a gift to buy at the next Blue Box area.
 

Elliottwave-Forecast

Master Trader
Feb 17, 2017
2,426
9
84
www.elliottwave-forecast.com
Short term Elliott Wave View in USDJPY suggests that the pullback to 112.27 ended Minute wave ((x)). Internal of Minute wave ((x)) unfolded as a zigzag Elliott Wave structure where Minutte wave (a) ended at 113.07, Minutte wave (b) ended at 113.7, and Minutte wave (c) of ((x)) ended at 112.27. Minute wave ((y)) rally is now progressing as a double three Elliott Wave structure. Up from 112.27, Minutte wave (w) ended at 114.04 with internal as a zigzag Elliott Wave structure. Subminutte wave a of (w) ended at 113.23, Subminutte wave b of (w) ended at 112.63, and Subminutte wave c of (w) ended at 114.04. Near term, Minutte wave (x) is expected to find support in 3-7-11 swing as far as pivot at 11/20 low (112.27) remains intact. We don't like selling the pair.

USDJPY 1 Hour Elliott Wave Chart

main-qimg-b0e7f3e1fa6ee97017e64741233b853a


main-qimg-485be72c69ea45dfdc410d921f85ad16
 

Elliottwave-Forecast

Master Trader
Feb 17, 2017
2,426
9
84
www.elliottwave-forecast.com
In the recent 2 years, Micron Technology (NASDAQ: MU) Investors were in the sky as the stock gained +500% in value since 2016 lows. The global corporation is one of largest semiconductor producer in USA behind giants like Intel & NVDIA.

In the recent 6 months, the prices of dynamic random-access memory DRAM and NAND flash memory decreased significantly which was reflected on Micron Technology’s stock which suffered a 45% decline. However, despite the recent decline MU is still up 260% since 2016 low and the technical picture is suggesting a recovery to take place.

One of the most commune corrective structure is the double three 7 swings WXY. The Market does 3 waves move, then it corrects in 3 waves followed with another 3 waves move to the same direction of the previous 3 waves. In total, it has 7 swings which can be seen in the 4H Chart of MU as the stock has been declining since May 2018 in corrective structures. In addition, MU reached the 100% Fibonacci extension $34.63 represented by the blue box area which is a High-frequency areas where markets are likely to end cycles and make a turn.

Micron Technology 4H Chart 12.02.2018

main-qimg-307b6b12689aaeac298e6d47c4c38b92


Consequently, MU is looking at least for 3 waves bounce to correct the cycle from May 2018 peak as a firstMicron Technology (MU) – Reversal Around the Corner highs.all time step of recovery, then based on the rest of the stock market it has the possibility of rallying further targeting new

The move higher can take place based on the weekly bullish trend since 2008 in the Semiconductor sector which is still intact. We can see in the next chart of ETF SMH that an impulsive structure is still in progress and a final wave to the upside is needed before ending an impulsive 5 waves move advance based on Elliott Wave Theory. Therefore a direct correlation between SMH and MU is suggestion will remain supported as long as 2015 /2016 lows are intact.instrument that both

SMH Weekly Chart 12.02.2018

main-qimg-7c95478ec18bb009a9e9df3de918c4f6
 

Elliottwave-Forecast

Master Trader
Feb 17, 2017
2,426
9
84
www.elliottwave-forecast.com
Nvidia Corporation (NASDAQ:NVDA) has grown to become a leader in manufacturing graphic processing units (GPU) for computer and gaming devices as well as Artificial Intelligence (AI). In the recent 2 years, the American company benefited the most from the growth of cryptocurrency and artificial intelligence markets. However, back in October 2018, the stock made a major peak at $292 and started correcting to the downside loosing more than 50% of its value in 2 months.

Nvidia stock wasn’t the only one being hit in recent decline as it’s direct competitor, Advanced Micro Devices (NASDAQ:AMD), suffered a 45% decline in October among other Technology and Semiconductor stocks around the world. Market sentiment started to switch as many investors considered the move to be just the the first leg of a bear market but is that really the case? It could be or it the current decline could end all the correction and start another major rally into new all time highs. We do understand that long-term investors take positions based on fundamentals analysis such as the company’s competitive environment, corporate strategy, management, products, earnings outlook, valuation and / or balance sheet but technical analysis can highlight high probability inflection areas in the market which can act as a great entry points regardless of whether you are a trader looking to hold the stock for a few weeks to a few months or an investor looking for to hold the stock from a few months to a few years. I will present the technical picture based in Elliott Wave and highlight the next inflection area in the stock.

Based on the Elliott Wave Theory, NVDA has been in a bullish trend since IPO low in 1999 and the stock advanced in an impulsive 5 waves move. The multi-year rally finally ended last month representing the Grand Super Cycle wave ((I)) which triggered the current decline taking place in wave ((II)). According to Elliott Wave Theory, when a 5 wave impulse ends, there will be a correction caused by buyers taking profits.

Corrections can take many different forms and in this case correction appears to be taking the form of a double three structure which has a measured move target at $105.54. It is the 100% Fibonacci extension of the decline from $292 high to $176 low projected lower from $222 peak. So, we can see a final leg lower into the measured move target area before Christmas followed by a significant EOY rally. If we do get the final leg lower and the subsequent rally turns out to be the start of a move to new all time high, then it would be a great opportunity to be able to catch such type of a move. Alternatively, it could produce a bounce toward 50 – 61.8 Fibonacci retracement area of the decline from $222 peak.

However at this stage, Nvidia stock is reacting higher from the 61.8 Fibonacci extension area $150 – $133 and there is high chance of the correction already ended at 11/20/2018 low. The idea is supported by the fact that Semiconductor ETF SMH and Advanced Micro Device AMD both reached their respective 100% extension ( Buying Area ) so consequently the sector is ready to resume the rally higher or bounce in larger 3 waves at least.

Nvidia NVDA Daily Chart 12.02.2018
 

Elliottwave-Forecast

Master Trader
Feb 17, 2017
2,426
9
84
www.elliottwave-forecast.com
(RTTNews) — Microsoft Corp. (MSFT) has unseated Apple Inc. (AAPL) to rank as the world’s most valuable listed company. The software giant ended Friday with a market value of more than $851 billion compared with Apple’s $847 billion. Both companies remain well below the $1 trillion milestone that Apple and Amazon hit earlier this year.

On Friday, Microsoft shares gained more than 0.6% to close at $110.89, while Apple shares finished at $178.58, down about 0.54%. Apple’s shares have fallen almost 25% since October amid concerns about slowing smart phone demand and the possibility of additional US tariffs on Chinese-made goods. Microsoft’s ascension to the most valuable company would be its first return to the top spot since 2002. Apple has held the №1 spot as most valuable company since 2012, when it unseated Exxon.

In terms of Elliott Waves, MSFT has reached 161.8 Fibonacci extension of the initially rally from all time low to 2000 peak which means it’s a wave 3 in progress minimum target for which was the 161.8% Fibonacci extension at 112.23 and has been met already. However, nothing yet has confirmed that wave 3 has completed so while above 99.35 low, stock should see further strength toward 120.32–126.86 area which is the inverse 123.6–161.8 Fibonacci extension area of the drop from 116.18 high to 99.35 low. Above 126.86 would expose 135.23 to complete wave 3 of the grand super cycle which is the 200% Fibonacci extension of the initially rally from all time low to 2000 peak.

MSFT Weekly Elliott Wave Analysis
0*ycfUiEp1rt8_LMwL.jpg

MSFT Daily Analysis — Elliott Wave View
Daily chart analysis suggests stock has completed a double three Elliott wave structure down from 116.18 to 99.35 and strong reaction higher suggests wave (IV) pull back has completed at 99.35. Up from there, wave I is closed to completion and after that, we should see a pull back in wave II to correct the rally from 99.34 low before we see further extension to the upside in red wave III of blue wave (V).

0*51Ybr6P3Wo_jKJSg.jpg

MSFT Daily Analysis — Alternate View
Alternate view suggests that impulsive rally from 99.35 low is part of an expanded FLAT Elliott wave correction which started on 10/30/2018 (100.11) low and once completed, it would result in another drop below 99.35 low to complete wave (IV) as double correction before MSFT would have another chance to make new high above 116.18 to complete wave ((III)) grand super cycle.
 

Elliottwave-Forecast

Master Trader
Feb 17, 2017
2,426
9
84
www.elliottwave-forecast.com
NIFTY is showing an incomplete sequence to the upside in the short term, favoring more upside while above 11/26 low (10487.1). Near term, cycle from 10/26 low (10004) remains in progress as a zigzag Elliott Wave structure. Intermediate Wave (A) ended at 10774.7 as 5 waves impulse Elliott Wave structure and Intermediate wave (B) ended at 10487.13 low.

Internal of wave (A) unfolded as an impulse where Minor wave 1 ended at 10285.1, Minor wave 2 ended at 10105.10, Minor wave 3 ended at 10619.55, Minor wave 4 ended at 10440.55, and Minor wave 5 of (A) ended at 10774.7. Intermediate wave (B) pullback unfolded as a double three Elliott Wave structure where Minor wave W ended at 10562.35, Minor wave X ended at 10646.25 and Minor wave Y of (B) ended at 10487.13.

Up from 10487.13 low, Intermediate wave (C) is in progress as a 5 waves impulse Elliott Wave structure where Minor wave 1 ended at 10941.20. The Index is now correcting cycle from 11/26 low within wave 2 in 3, 7, or 11 swing before the rally resumes. We don't like selling the pullback and expect to find buyers in 3, 7, or 11 swing for more upside as far as pullback stays above 10487.13 low

NIFTY 1 Hour Elliott Wave Chart
upload_2018-12-4_20-55-2.gif


upload_2018-12-4_20-55-2.gif
 

Elliottwave-Forecast

Master Trader
Feb 17, 2017
2,426
9
84
www.elliottwave-forecast.com
G20 Meeting Produces Trade War Truce between US and China — Will it last?
During the dinner meeting at G20 summit in Buenos Aires last weekend, the U.S. and China agreed to suspend new tariffs for 90 days. The market reacts positively with stock market rallying around the world, creating a risk on environment for potential Santa Claus rally in December. However, has a real significant breakthrough made during the meeting and how sustainable is it?

President Trump previously threatened to increase the tariff for the $200 billion of Chinese goods from 10% to 25% on 1 January. The truce buys time for both countries to reduce their trade imbalance between the two countries. The thornier issues however relate to the dispute on China’s predatory intellectual property and forced technology transfer practice.

Under the agreement, the two countries have 90 days to resolve their differences over Beijing’s tech policies. If they can’t, the U.S. will go ahead and increase the tariffs on Chinese goods to 25%. The Chinese has already agreed to buy a substantial amount of agricultural, energy, and industrial products to reduce the trade imbalance. President Trump also said in his personal twitter account that China will reduce the auto tariff. China previously increased the tariff for U.S. cars to 40% from 25% as a form of retaliation.

0*2xXQZ_HNHZoliJdq.png

Both sides also agree to immediately begin negotiations on structural changes with respect to forced technology transfer and intellectual property protection. The U.S. also says that Beijing agreed to designate Fentanyl as a controlled substance. The opioid, which is believed to be largely made in China, has been driving a huge rise in drug addiction in the US.

However, make no mistake, this truce is not the end of the trade war but merely a suspension of the escalation of the trade war. The current tit-for-tat tariffs still remain in effect and the truce hasn’t undo it as the chart below shows. Future escalation is also still possible depending on how far Beijing will allow International access to its market that satisfy Trump and his administration.

0*j7zBolZB3D9UIuZZ.png

Even if we assume the U.S. and China can make a grand deal within 90 days, trade war is not the only factor driving the market. An even bigger major factor is quantitative tightening by the Fed. As of November this year, the QT or Quantitative Tightening is still running at a maximum pace of US $50B per month. This works the opposite of Quantitative Easing (QE). If QE is responsible for the rally in equity market in the past 10 years, then QT may have the opposite effect of it.

We will take a look at a few World Indices below

S&P 500 E-Mini Futures Technical Outlook
0*Bfqfile5nSuSYO4M.jpg

Short Term reaction in the world index is a risk-on rally. However, world Indices must break to all-time new high above the Sept peak to confirm that a new bullish leg has started. In the shorter term, ES_F (S&P 500 E-Mini Futures) may see more upside to 2840–2890 which will be the decision area for the Index either to pullback and extend higher or to do double correction and breaks below 10.29.2018 low.

Dow Futures (YM_F) Technical Outlook
0*flHXwoxn18rqAKwB.jpg

Same outlook can be seen in Dow Futures (YM_F). The Index needs to break above 10.3.2018 high to confirm that a new bullish leg has started. Until then, a double correction (Path #1) still can happen. Near term, the Index has scope to extend higher towards 26436 area which will decide the next path in the Index.

Nikkei Futures (NKD_F) Technical Outlook
0*cpu0ywcFelXPHaYH.jpg

Nikei Futures (NKD_F) also show the same outlook. It rallies in response to the trade war truce. However, in order to confirm a new bullish cycle, it must break above 10.1.2018 peak. Until then, a double correction (Path #2) can not be ruled out. Near term, the Index has scope to extend to 22948–23365 area which will determine the next 4 hour move in the Index.

Keep in mind that market is dynamic and the outlook may have changed since this article is written.
 

Elliottwave-Forecast

Master Trader
Feb 17, 2017
2,426
9
84
www.elliottwave-forecast.com
Short term Elliott Wave view in USDJPY suggests that cycle from 11/12 peak (114.21) remains in progress as a double three Elliott Wave structure. Down from 114.21, Minute wave ((w)) ended at 112.27 and Minute wave ((x)) bounce ended at 114.03. Internal of Minute wave ((x)) unfolded as a zigzag Elliott Wave structure where Minutte wave (a) ended at 113.23, Minutte wave (b) ended at 112.63, and Minutte wave (c) of ((x)) ended at 114.03.

Minute wave ((y)) lower is currently in progress and the internal is unfolding as a double three Elliott Wave structure in lesser degree. Down from 114.03, Minutte wave (w) ended at 112.54 as a zigzag Elliott Wave structure, and Minutte wave (x) bounce is correcting cycle from 11/29 high before the decline resumes. We expect sellers to appear after Minutte wave (x) bounce is complete in 3, 7, or 11 swing as far as pivot at 114.03 high stays intact.

USDJPY 1 Hour Elliott Wave Chart


Elliottwave-Forecast

Master Trader
Feb 17, 2017
2,426
9
84
www.elliottwave-forecast.com
Hello fellow traders. Another instrument that we have been trading lately is BABA Stock from Group 3. In this technical blog we’re going to take a quick look at the Elliott Wave charts of BABA, published in members area of the website. As our members know, BABA has been correcting larger cycle from the 59.5 low. We expected the stock to find buyers in 3,7,11 swings due to previous bullish trend. Consequently, we advised members to avoid selling it and keep on buying the dips in the sequences of 3,7,or 11 swings whenever get chance. In further text we’re going to explain Elliott Wave Count and Trading Setup.

BABA Daily Elliott Wave Analysis 10.13.2018

Current Elliott Wave analysis suggests BABA is correcting the cycle from the 59.5 low. Pull back seems to be unfolding as Elliott Wave Zig Zag Pattern, when we can still be in wave (c) leg. Buying zone is already reached at 140.82 , however we see possibility of another wave down to complete 5 waves in (c) leg. Although we expect move down, we don’t recommend selling BABA against the main bullish trend. Strategy is buying the dips at marked extremes : 140.8-130.0 area. As the main trend is bullish, we expect to see reaction in 3 waves up from the blue box at least. As soon as the bounce reaches 50 fibs against the (b) blue high, we will make long positions risk free and let the profit run.


BABA 4 Hour Elliott Wave Analysis 11.15.2018

Eventually BABA has given us another wave down as we forecasted. Buyers have appeared shortly after and we got turn higher. Now calling pull back completed at 130.03 low. Bounce has reached 50 Fibonacci retracement against the (b) blue high. As a result members who took long trades are now enjoying profits with risk free positions. Recently we got break of November 2nd peak, which means we should ideally get further extension higher, confirming next leg up wave (3) is in progress.

Note: Market is dynamic and presented view could have changed in the mean time. Best instruments to trade are those having incomplete bullish or bearish swings sequences. We put them in Sequence Report and best among them are shown in the Live Trading Room.


Elliottwave-Forecast

Master Trader
Feb 17, 2017
2,426
9
84
www.elliottwave-forecast.com
Hello fellow traders. In this technical blog we’re going to take a quick look at the Elliott Wave charts of Wheat Futures, published in members area of The Website. As we can see at the charts below, ZW #F is doing short term recovery against the 521'0 peak, labelled as wave X red . Proposed short term bounce seems to be unfolding as a Elliott Wave Double Three pattern. Currently the bounce is showing incomplete sequences from the lows, when we have 5 swings as of right now. Proposed X red recovery is missing another swing up toward blue box area 511'+ to complete proposed Double Three ( 7 swings structure) and then it should resume the decline or turn lower in 3 waves at least.

ZW #F 1 Hour Elliott Wave Analysis 11.26.2018


ZW #F 1 Hour Elliott Wave Analysis 11.27.2018
X red recovery gave us proposed 7th swing up , however it missed blue box area by a few points. Sellers appeared early and we got sharp decline as expected in 3 waves at least.


Elliottwave-Forecast

Master Trader
Feb 17, 2017
2,426
9
84
www.elliottwave-forecast.com
In this technical blog, we are going to take a look at the past 1-hour performance of Soybean ticker symbol: ZS_F Elliott Wave charts that we presented to our clients. We are going to explain the structure and the forecast below.

Soybean Elliott Wave 1 Hour Chart From November 21.2018

main-qimg-bd462aa321e9367da09181e91dfee431


Above is the 1-hour Chart from 11/21/2018 Asia update, in which instrument was expected to correct the short-term cycle from 10/31/2018 low (832.6) in Minute wave ((b)). The internals of that pullback was expected to unfold in lesser degree double three structure. And see a push lower towards 860.4-837.6 100%-161.8% Fibonacci extension area of a Minutte wave (w)-(x) before next leg higher within Minute wave ((c)) starts.

Soybean Elliott Wave 1 Hour Chart From November 28.2018

main-qimg-7c4e0607b62ab661d7840caedfa7bb2d


Soybean 1-hour Chart from 11/28/2018 Asia update, the instrument reached the blue box area last week in 7 swings at 860.4-837.6 as expected and ended the Minute wave ((b)) at 857 low. While above there, the instrument was expected to resume the next leg higher within Minute wave ((c)) of a proposed zigzag structure coming from 10/31/2018 low.

Soybean 1 Hour Elliott Wave Chart From December 02.2018

main-qimg-bd20de31e4c19d00464df55be55eed61


Here's the 1-hour update from 12/02/2018 Weekend update. Showing instrument breaking to new highs already, after finding buyers from the blue box area confirming the next extension higher.
 

Elliottwave-Forecast

Master Trader
Feb 17, 2017
2,426
9
84
www.elliottwave-forecast.com
USDCAD has broken above 11/29/2018 high (1.336) as well as above 6/27/2018 high (1.3386) creating incomplete bullish sequence. Short term Elliott Wave view suggests the rally to 1.336 on 11/29 ended Intermediate wave (W) and the pullback to 1.3157 ended Intermediate wave (X). Internal of Intermediate wave (X) unfolded as a zigzag Elliott Wave structure where Minor wave A ended at 1.324. Minor wave B bounce ended at 1.333, and Minor wave C of (X) ended at 1.3157 low.

Up from 1.3157, pair has made a new high above Intermediate wave (W) at 1.3157, suggesting the next leg higher has started. The rally is unfolding as a 5 waves impulse Elliott Wave structure where Minute wave ((i)) ended at 1.322 and Minute wave ((ii)) ended at 1.316. Expect pair to do 1 more leg higher to end the 5 waves impulse and complete Minor wave A of larger degree. Pair should then pullback in Minor wave B to correct cycle from 12/3/2018 low in 3-7-11 swing before the rally resumes.

USDCAD 1 Hour Elliott Wave Chart


v
 

Elliottwave-Forecast

Master Trader
Feb 17, 2017
2,426
9
84
www.elliottwave-forecast.com
In this blog, I want to share some short-term Elliott Wave charts of Palladium which we presented to our members in the past. Below, you see the 1-hour updated chart presented to our clients on the 11/30/18 indicating that Amazon ended the cycle from 11/23 low (1094.70) in black wave ((a)) at 11/30 peak (1198.1).

As Palladium ended the cycle from 11/23 low in black wave ((a)). It started a pullback lower in black wave ((b)). The pullback proposed to unfolded as an Elliott Wave Zig Zag correction. Due to the right side bullish stamp, which you can see in the chart below. We advised members that we like buying Palladium at the equal legs from 11/30 peak. Therefore, we expected buyers to appear in the dips in the sequences of 3, 7 or 11 swings. At the 100 - 1.236 Fibonacci extension of blue (a)-(b). Which came at around 1148.62-1142.76 area. The commodity reached that blue box in the chart below and we opened a long position in that area. As that was the first area for buyers to appear to take prices to new highs above wave 1 peak or a larger 3 waves bounce at least.

Palladium 11.30.2018 1 Hour Chart Elliott Wave Analysis

In the last Elliott Wave chart, you can see that Palladium bounced nicely higher from the equal legs area (blue box). Our members bought the equal legs from 1148.6+ areas and any trade from that area are risk-free which means the stop should be at breakeven, targeting higher levels. Do please keep in mind that the 1-hour chart which I presented may have already changed.

Palladium 12.04.2018 1 Hour Chart Elliott Wave Analysis