Elliottwave-Forecast

Master Trader
Feb 17, 2017
2,451
9
84
www.elliottwave-forecast.com
Elliott Wave Analysis: Oil (CL_F) Looking to Extend Higher in Wave 3

March 21, 2018 By [URL deleted] EWFHendra

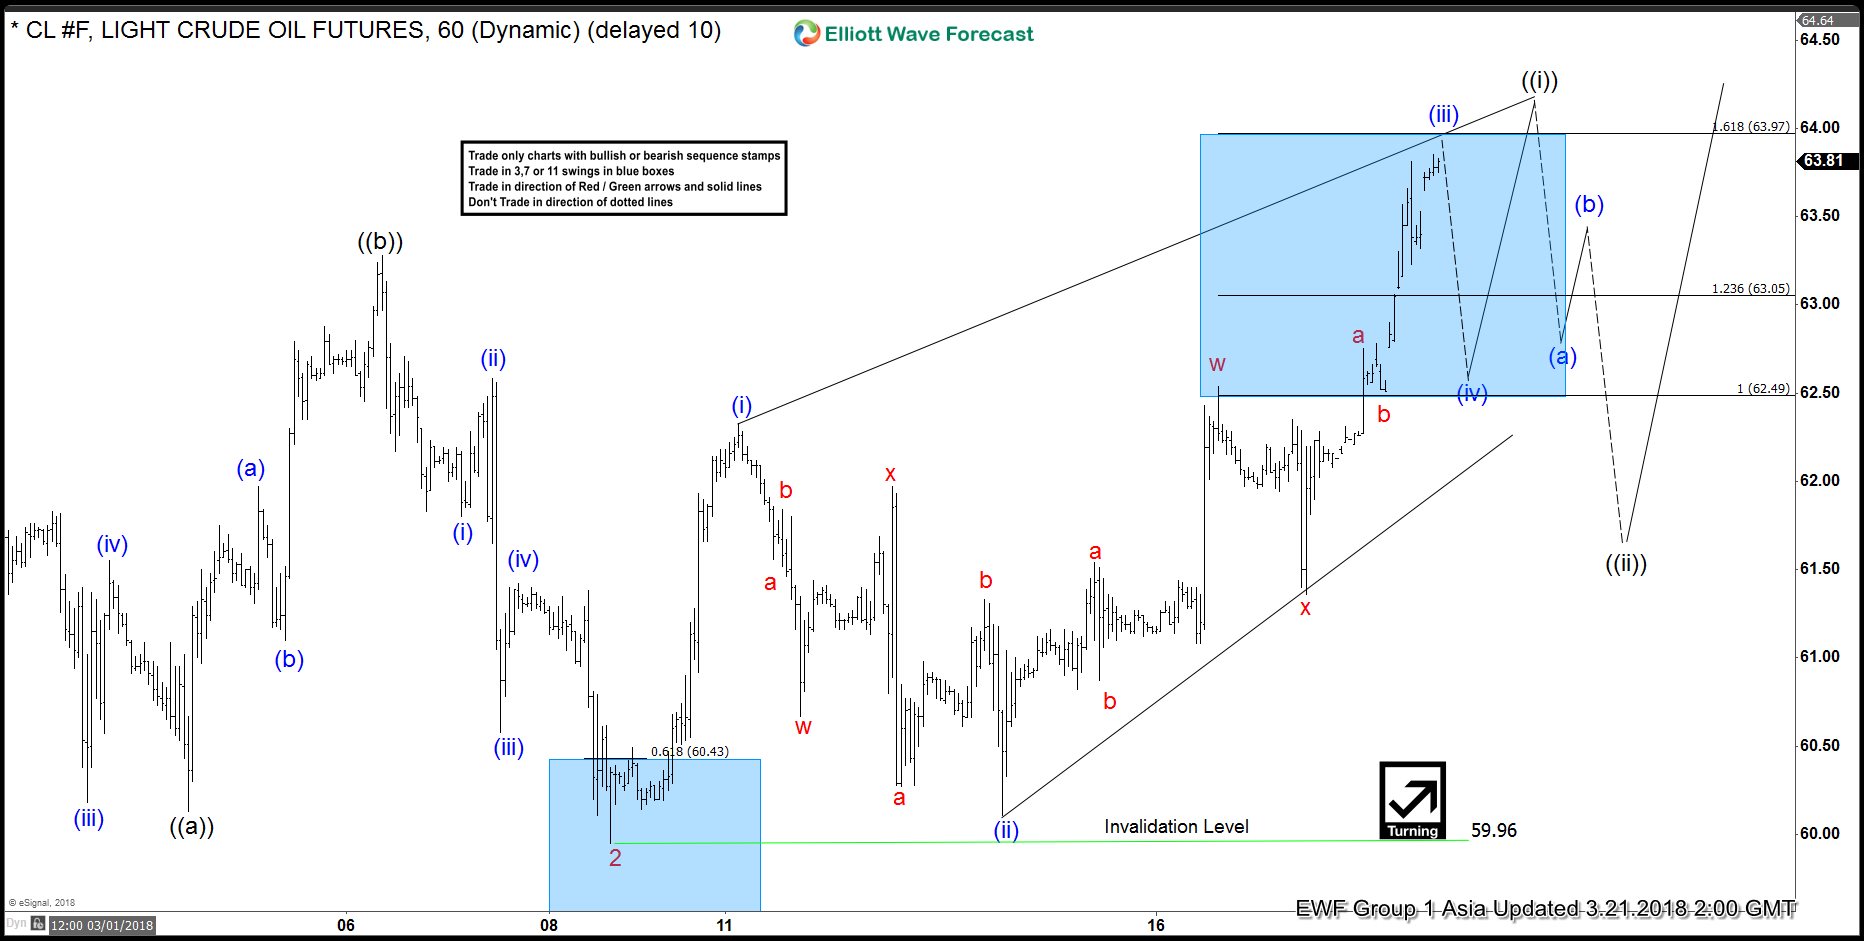
Oil (CL_F) Short Term [URL deleted] Elliott Wave view suggests that the decline to 59.95 on 3/9 ended Minor wave 2. Minor wave 3 is unfolding as a [URL deleted] 5 waves impulse Elliott Wave Structure where Minute wave ((i)) of 3 is currently in progress as a [URL deleted] leading diagonal. Up from 59.96, Minutte wave (i) ended at 62.33, Minutte wave (ii) ended at 60.11, and Minutte wave (iii) should end soon. Expect a pullback in Minutte wave (iv) to be followed by another leg higher in Minutte wave (v) before Oil completes Minutte wave (v) and ends cycle from 3/9 low (59.96). The five waves higher from 59.96 should form Minute wave ((i)) of a larger degree as a diagonal. Afterwards, Oil should pullback in Minute wave ((ii)) to correct cycle from 3/9 low in 3, 7, or 11 swing before the rally resumes. As far as pivot at 3/9 low (59.96) stays intact during the pullback, expect Oil to extend higher.

Oil (CL_F) 1 Hour Elliott Wave Chart


Last edited by a moderator:

Elliottwave-Forecast

Master Trader
Feb 17, 2017
2,451
9
84
www.elliottwave-forecast.com
Elliott Wave Analysis: AUDJPY Calling the Decline

March 20, 2018 By [URL deleted] EWFSanjay

In this blog, we will have a look at some past Elliott Wave structures of the instrument AUDJPY.

In the chart below, you can see the 1-hour weekend update presented to our members on the 03/10/18. Calling for a double correction in an [URL deleted] Elliott Wave Flat correction as the internals from black ((a))-((b))-((c)) proposed to be unfolding in 3-3-5.

We said to our members that AUDJPY has reached already the minimum equal legs target of around 83.843. (100% Fibonacci extension from black ((a))-((b))-((c))). But due to the flat correction, we mentioned also that it can extend within the blue box as part of a flat correction in black wave ((c)). And that the bigger picture wave 4 could be soon in place. Therefore, we advised members that the right side remains to be to the downside. As we were looking for another similar 1-hour push lower.

AUDJPY 03.10.2018 1 Hour Chart Elliott Wave Analysis


In the Elliott Wave chart below, you can see that AUDJPY made another push higher within the blue box to the 1.236 Fibonacci Extension from black ((a))-((b)). It bounced from the 83.843-84.282 area mentioned above and continued the short-term weakness to the downside very nicely. Confirming that the bigger picture red wave 4 is in place. From that top, the market is possibly unfolding as a [URL deleted] 5 waves impulse Elliott Wave structure move lower. We should ideally end soon black wave ((i)) followed by a bounce in black wave ((ii)). As long as the pivot at 84.548 in our distribution system stays intact. The market should continue its weakness.

[URL deleted]

AUDJPY 03.17.2018 1 Hour Chart Elliott Wave Analysis


I hope you liked this blog and I wish you all good trades. [URL deleted]

We believe in cycles, distribution, and many other tools in addition to the classic or new Elliott wave Principle. [URL deleted]
 
Last edited by a moderator:

Elliottwave-Forecast

Master Trader
Feb 17, 2017
2,451
9
84
www.elliottwave-forecast.com
CADJPY Forecasting Decline After Elliott Wave Flat


Hello fellow traders. In this technical blog we’re going to take a quick look at the past Elliott Wave charts of CADJPY published in members area of the website. In further text we’re going to explain the short term Elliott Wave view. As our members know, we have been syaing saying that the pair has reached the extreme area from the 09/15 2017 peak. However due to incomplete swings sequences we have had in USDJPY and NZDJPY, we knew that CADJPY decline should extend further.

CADJPY Elliott Wave 1 Hour Chart 3.10.2018
Cycle from the September 2017 peak is still in progress as [URL deleted] Elliott Wave Flat structure. We’re doing wave 4 of (C) of FLAT. Correction is already at the extremes from the wave 3 red low ( 03/05) and we believe wave 4 red of (C) is also unfolding as a FLAT. The pair has reached 23.6-38.2 Fibonacci retracement zone at 83.28-84.45. We expect wave 4 red to complete there, however another marginal push up would be ideal. That way the price structure will have 5 waves in wave ((c)) of 4. Although the pair should resume decline ideally , selling the pair is tricky as the pair has already reached extremes from the September peak. We call it lower due to correlation with other JPY pairs like USDJPY and NZDJPY, that still showing incomplete structures.


CADJPY Elliott Wave 1 Hour Chart 3.20.2018
The pair has found sellers at proposed area 83.28-84.45 and found sellers there. The pair completed wave 4 red recovery at the 83.5 peak and gave us expected decline. As a result the price has made new low , duggesting another extension to the downside. Keep in mind the pair is at the extreme from the September 2017 peak and this chart is not trading recommendation. Best instruments to trade are those having incomplete bullish or bearish swings sequences. They are shown in Sequence Report and best among them are presented in the [URL deleted] Live Trading Room.


[advertisement deleted]

Elliott Wave Forecast

We cover 78 instruments in total and present Official Trading Recommendations in [URL deleted] Live Trading Room. [URL deleted]

Through time we have developed a very respectable trading strategy which defines Entry, Stop Loss and Take Profit levels with high accuracy and allows you to make position Risk Free, shortly after taking it. If you want to learn all about it and become a professional Trader. Our technical analysts stand ready 24 hours from Monday – Friday to provide the latest market update and answer your market question.

Trade Safe & Good Luck!
 
Last edited by a moderator:

Elliottwave-Forecast

Master Trader
Feb 17, 2017
2,451
9
84
www.elliottwave-forecast.com
Elliott Wave Analysis: USDJPY Resumes Lower to 104

USDJPY Elliott Wave view suggests that the decline from 11.6.2017 high is unfolding as a 5 waves impulse Elliott Wave structure. Down from 11.6.2017 high (114.73), Intermediate wave (1) ended at 110.84, Intermediate wave (2) ended at 113.75, Intermediate wave (3) ended at 105.55, and Intermediate wave (4) ended at 107.3. Intermediate wave (5) is in progress as an Ending Diagonal Elliott Wave structure. Down from 107.3, Minute wave ((w)) ended at 105.76 and Minute wave ((x)) ended at 106.64. Subdivision of Minute wave ((w)) unfolded as a zigzag Elliott Wave structure where Minutte wave (a) ended at 106.37, Minutte wave (b) ended at 106.75, and Minutte wave (c) of ((w)) ended at 105.76. Subdivision of Minute wave ((x)) unfolded as an Expanded Flat Elliott Wave structure where Minutte wave (a) ended at 106.41, Minutte wave (b) ended at 105.57, and Minutte wave (c) of ((x)) ended at 106.64. Near term, expect pair to bounce in Minutte wave (x) to correct cycle from 106.64 high, then as far as pivot at 3.13.2018 high (107.3) stays intact, expect pair to extend lower towards 104 area.


USDJPY 1 Hour Elliott Wave Chart


Elliottwave-Forecast

Master Trader
Feb 17, 2017
2,451
9
84
www.elliottwave-forecast.com
Elliott Wave Analysis: SPX Should See More Weakness

SPX rally to 2801.9 on 3.13.2018 ended Primary wave ((X)). Since then, the decline from there is unfolding as a double three Elliott Wave structure where Minor wave W ended at 2694.59 and Minor wave X ended at 2739.14. A double three is a WXY structure where the subdivision of each leg is corrective. Subdivision of Minor wave W unfolded as a zigzag Elliott Wave structure where Minute wave ((a)) ended at 2744.38, Minute wave ((b)) ended at 2761.85, and Minute wave ((c)) of W ended at 2694.59. Subdivision of Minor wave X unfolded as another zigzag where Minute wave ((a)) ended at 2724.22, Minute wave ((b)) ended at 2710.05, and Minute wave ((c)) of X ended at 2739.14. Minor wave Y is currently in progress as a zigzag Elliott Wave structure where Minute wave ((a)) ended at 2661.78 and Minute wave ((b)) ended at 2690.07. Near term focus is on 2606.2 – 2631.59 area to complete Minute wave ((c)) of Y. The next move lower also should complete Intermediate wave (W) of higher degree and end cycle from 3.13.2018 high. Index should then bounce in Intermediate wave (X) to correct cycle from 3.13.2018 high in 3, 7, or 11 swing before the decline resumes.

SPX 1 Hour Elliott Wave Chart
 

Elliottwave-Forecast

Master Trader
Feb 17, 2017
2,451
9
84
www.elliottwave-forecast.com
Will Trade War Weigh on the Market?

Trade war with China Hurt Global Economy
Last week global stock market slumped due to the prospect of all-out trade war which could destabilize global economy. US market closed sharply lower for the week with S&P 500 falling 5.6% and Dow Jones Industrial Average falling 6%. Asia markets also skidded with Nikkei 225 falling 6.3%, Hang Seng dropping 6.4%, and Shanghai Composite shed 6.4%. On Thursday, the White House moved forward with the long promised anti-China sanctions with the announcement of new tariffs on up to $60 billion in Chinese imports.

Trump said this measure is to penalize Beijing for allegedly stealing U.S companies’ intellectual property. The tariffs follow after the result of investigation in Chinese policies last August. The review found unfair practices in China, including restriction on foreign ownership without the transfer of technology. The administration says that the theft of intellectual property has been happening for decades. The new trade sanctions has identified more than 1000 Chinese products which can be potential target of 25% tariffs. The US is also trying to limit Chinese investment in the US and purse legal action against China at the World Trade Organization.

China’s promise to retaliate
Beijing has said that it is not afraid of a trade war, but it hopes to avoid it through continued dialog. On Friday, China gave initial counter proposal of 128 US products as potential retaliation targets. The products include wine, groceries, and aluminium scrap which have an import value of $3 billion. China’s response is still quite restrained so far as it tries to avoid a full blown trade war.

Despite potential retaliation by China, the White House believes China has more to lose in the event of a full blown trade war. The US imports billions more goods from China every year than it exports, creating a deficit of $375 billion in 2017. On Thursday Trump said that he has asked China to cut the deficit by $100 billion immediately. China is the third largest market for US exports and a very big buyer of American soybeans, corn, pork, and aircraft. In the event of a full-blown trade war, many US industries will be affected and no one will win.

Best and Worst Case of Trade War for Financial Market
In the best case scenario, the latest trade war declaration is Trump’s attempt to use it as a bargaining tactic to force China to negotiating table. We have an example from the last controversial import tariffs on steel and aluminium. In the previous steel tariff, six major trading partners have since been excluded, including the EU, Canada, South Korea, and Mexico. Thus, it’s possible that China’s tariff could be subject to revision and even exemptions after extensive talks with Chinese leadership. In this scenario, after the initial shakeout and fear in financial market, it can quickly recover and even extend the 9 year rally. However, Trump’s deal-making nature can also lead to miscalculation. In the worst case scenario, we could be in a full-blown trade war with increasing retaliatory tariff hikes and sanctions. In this case, global economy could come into halt and financial markets would have further correction.

Short Term Forecast for US Market


Our Elliott Wave Forecast for XLP, a consumer staple sectors ETF, suggests the market has further downside. The fund’s top holdings include stocks such as Procter & Gamble, Coca Cola, PepsiCo, and Walmart. XLP shows incomplete bearish sequence from 1.29.2018 peak ($58.95). It has further downside to at least $48.03 – $49.52 to complete Elliott Wave Double Three Structure. A double three Elliott Wave Structure has a WXY label. Down from 1.29.2018 high ($58.95), Intermediate wave (W) ended at $52.66 and Intermediate wave (X) ended at $55.84. Intermediate wave (Y) is in progress towards $48.03 – $49.52 before the instrument see support for a 3 waves bounce at least.
 

Elliottwave-Forecast

Master Trader
Feb 17, 2017
2,451
9
84
www.elliottwave-forecast.com
Bitcoin Elliott Wave Analysis Looking for Short Term Recovery

Bitcoin Elliott Wave Analysis in the short term is showing an interesting corrective structure suggesting a recover to take place after it finishes the current move.

The digital instrument is correcting the cycle from 03/18 low in 3 waves as a Zigzag structure which reached the 100% – 161.8% Fibonacci extension area $8093 – $7520 from where it’s expected to resume a new cycle to the upside or at least bounce in 3 waves as long as it remain above $7320 low.

Bitcoin Elliott Wave 1H Chart 03.27.2018


If Bitcoin manage to break above 03/23 peak then it will continue the bounce higher toward $9550 – $10080 area correcting the cycle from 02/20 peak before another pullback can be seen. In case the short term bounce fail and BTC breaks below $7320 low, then it will open an extension lower toward $6600 – $6000 area.

Bitcoin Elliott Wave views can be used for trading purpose if certain conditions are met which we do provide for our clients. Moreover, the blue box areas in our charts are a high frequency areas where the Markets are likely to end cycles and make a turn. Consequently, BTC most likely will react from current levels.
 

Elliottwave-Forecast

Master Trader
Feb 17, 2017
2,451
9
84
www.elliottwave-forecast.com
Did Data scandal Sink Facebook, The Social Networking Website?

Facebook has been on the news lately when the world discovered that more than 50 million users had their personal data breached with the downloading of Kogan’s Application, a data harvesting route, which due to the lax of structure of Facebook’s APIs at the time, allowed the foreign political consultancy firm to acquire information on more than 50 million Facebook users according to the Observer reports. Facebook has lost around $80 billion in Market value since the data scandal become public and creating fear among investors. As we keep mentioning that news and scandals come at the right time when the Market is ready for a pullback. We have been saying that the financial world was ready for a multi-month correction in 2018 and Facebook is also part of that world. Facebook trades the same side as many World Indices do and consequently, the data breach is the perfect case to justify the correction. We know it’s hard to digest that the Market follows a code and they work in a perfect sync, but we do understand the concept and see the patterns develop and happening with a perfect timing. Facebook is showing an impulsive Elliott wave advance since it’s IPO back in 2012 and can be counted completed based just in Elliott wave Theory. However, we do understand The One Market concept and consequently, we believe Facebook stock is currently doing a wave (IV) pull back and another high within this cycle remains a possibility and would be the ideal scenario. The chart below shows the Impulse advance since the lows at 2012 and how the instrument is within the channel and how we like still another high to happen from the Blue Box.

Facebook Elliott Wave Analysis: Weekly View
FB-Monthly-blog20180328094522.jpg


Based in World Indices sequences, we expect Facebook stock to push higher when the World Indices renew the trend after finishing the current pull back which started back in January 2018 and rally into the 2020-2022. It is from there, that we can see the biggest correction in World Indices and also in Facebook stock when it could pull back to correct the entire cycle from 2012 low. As we said earlier, based on subjective nature of Elliott Wave Theory, cycle from 2012 low could be counted completed as well but given a choice between calling the cycle completed or another high to end the cycle, we are going with another high because when we overlay Facebook with the $Nikkei Index’s incomplete sequences, we can see another high to end the cycle in Facebook makes more sense. The following chart shown the $Nikkei sequences overlaid with Facebook.

NI225-sequences20180328095416.jpg


We tend to see the trend and the logic which implies that the Data scandal should not sink the company and in fact it is just another opportunity for the bulls to buy the stock for a new all time high or a larger 3 waves bounce at least to get into a risk free position.
 

Elliottwave-Forecast

Master Trader
Feb 17, 2017
2,451
9
84
www.elliottwave-forecast.com
GBPUSD Elliott Wave View: Calling The Bounce Higher

GBPUSD Elliott Wave short-term sequence from 3/01 low (1.3709) ended as a Leading Diagonal structure in Minor wave 1 at 1.4248 high in 5 waves. Down from there, the pair is correcting that cycle in Minor wave 2 pullback in 3, 7 or 11 swings before it resumes the upside. So far pair is showing 3 swings back from the peak, which we are labeling as a Zigzag correction. Where Minute wave ((a)) ended with internal distribution of 5 waves at 1.4065 low and Minute wave ((b)) bounce ended in 3 swings at 1.4199 high.

Below from there, Minute wave ((c)) remain in progress with internal distribution of another 5 waves. Where Minutte wave (i) of ((c)) ended at 1.4133, Minutte wave (ii) of ((c)) ended at 1.4181. Then Minutte wave (iii) of ((c)) ended at 1.4059 and Minutte wave (iv) of ((c)) ended at 1.4095. And below from there, Minutte wave (v) of ((c)) remain in progress which has managed to reach the 100%-123.6% ext area of ((a))-((b)) already at 1.4018-1.3975 area. And soon as far as a pivot from 3/01 low (1.3709) remains intact pair is expected to resume the upside once again. We don’t like selling the pair into a proposed pullback and expect buyers to appear again at 1.4018-1.3975 for 3 wave bounce at least.

GBPUSD Elliott Wave 1 Hour Chart


Elliottwave-Forecast

Master Trader
Feb 17, 2017
2,451
9
84
www.elliottwave-forecast.com
SPX Elliott Wave View: Further Weaknesses Likely

SPX Elliott Wave view suggests rally to 2801.90 on 3/13/2018 ended Primary wave ((X)). Decline from there is unfolding as a double three Elliott Wave structure where Intermediate wave (W) ended at 2585.89 and Intermediate wave (X) ended at 2674.22. Subdivision of Intermediate wave (W) unfolded as another double three of a lower degree where Minor wave W ended at 2694.59, Minor wave X ended at 2739.14, and Minor wave Y of (W) ended at 2585.89. Subdivision of Intermediate wave (X) unfolded as a zigzag Elliott Wave structure where Minor wave A ended at 2639.26, Minor wave B ended at 2601.81, and Minor wave C of (X) ended at 2676.54.

Intermediate wave (Y) is currently in progress as a zigzag Elliott Wave structure. A zigzag is a 5-3-5 Elliott Wave structure with ABC label. The subdivision of wave A is in 5 waves and the subdivision of wave C is also in 5 waves. In the case of SPX, decline from 2676.54 is unfolding as 5 waves impulse Elliott Wave structure where Minute wave ((i)) ended at 2593.06, Minute wave ((ii)) ended at 2659.07, Minute wave ((iii)) ended at 2553.80, and Minute wave ((iv)) is proposed complete at 2586.38.

Expect Index to extend lower 1 more time to end Minute wave ((v)) towards 2509.45 – 2540.78 and this next leg lower should also complete Minor wave A of a zigzag from 3.28.2018 high (2676.54). Afterwards, expect Index to bounce in Minor wave B in 3, 7, or 11 swing to correct cycle from 3.28.2018 high before the decline resumes. We don’t like buying the Index.

SPX Elliott Wave 1 Hour Chart
 

Elliottwave-Forecast

Master Trader
Feb 17, 2017
2,451
9
84
www.elliottwave-forecast.com
Elliott Wave View: Copper Starts a New Leg Higher

Short Term Elliott Wave view in Copper suggests that the decline to 2.938 on 3.26.2018 ended Minor wave IV. The metal started a new leg higher from there in Minor wave V. Subdivision of Minor wave V is unfolding as an impulse Elliott Wave structure. An Impulse Elliott Wave structure is a 5 waves structure where wave 1, 3, and 5 subdivision are also internally in 5 waves (impulsive). In the case of Copper, up from 2.938, Minutte wave (i) ended at 3.024, Minutte wave (ii) ended at 2.968, Minutte wave (iii) ended at 3.072, and Minutte wave (iv) ended at 3.037.

Near term focus is on 3.081 – 3.095 to complete Minutte wave (v). This next leg higher in Minutte wave (v) should end Minute wave ((i)) of a larger degree. Copper should then pullback in Minute wave ((ii)) in 3, 7, or 11 swing to correct cycle from 3/26/2018 low before the rally resumes, provided pivot at 2.938 low stays intact. We don’t like selling the proposed pullback and expect buyers to appear while Minute wave ((ii)) dips stay above 2.938 low.

Copper Elliott Wave 1 Hour Chart
 

Elliottwave-Forecast

Master Trader
Feb 17, 2017
2,451
9
84
www.elliottwave-forecast.com
Elliott Wave Analysis: Further Strength in USDJPY

USDJPY short term Elliott Wave view suggests that the decline to 104.54 low on March 26 ended Intermediate wave (3). Wave (4) correction is in progress as a double three Elliott Wave Structure. A double three is a 7 swing corrective structure with WXY label. In the case of USDJPY, minor wave W of (4) ended at 107.01 and minor wave X of (4) ended at 105.62. As near term pullback stays above there, expect pair to extend higher within wave Y of (4).

Subdivision of Minor wave W of (4) in USDJPY unfolded as a zigzag Elliott Wave structure where Minute wave ((a)) ended at 105.9, Minute wave ((b)) ended at 105.29, and Minute wave ((c)) of W ended at 107.01. Subdivision of Minor wave X of (4) also unfolded as a zigzag Elliott Wave structure where Minute wave ((a)) ended at 106.09, Minute wave ((b)) ended at 106.45, and Minute wave ((c)) of X ended at 105.62.

Minor wave Y of (4) is currently in progress as a double three Elliott Wave structure where the rally from 105.62 ended at 107.49 in Minute wave ((w)). Expect pair to pullback within Minute wave ((x)) in 3, 7, or 11 swing to correct cycle from 4/3 low before the rally resumes.

USDJPY Elliott Wave 1 Hour Chart
 

Elliottwave-Forecast

Master Trader
Feb 17, 2017
2,451
9
84
www.elliottwave-forecast.com
North and South Korean peace in the Horizon based in Elliott Wave

North and South Korean peace in the Horizon
The Leaders of the North and South Korea will meet on April 27, 2018 for the first time since 2007 and hope for North and South Korean peace, the two countries announced last month. The meeting between President Moon Jae-in and Kim Jon Un will be held at the Freedom House on the southern side of the Demilitarized Zone (DMZ), according to the joint statement issued after the talks. We understand the whole world will be looking at the summit, but most importantly the Technical Market is showing the outcome which will result in a rally across the Market and weakness in the Yen. So, all will be good news. Many fundamental traders look at events like this to trade, but we look at the sequences and cycles and also at The One Market concept to look for trading opportunities.

The Nikkei Index from Japan is showing a multi-year bullish sequences which started at 2009 low and is currently in the 6th swing of the sequence. This calls for more upside towards 28764 technical level ideally by 2020-2020, the rally in the $Nikkei will mean the YEN will be weak for at least 2 years and consequently the World Indices will rally. $KOSPI ( KOSPI Composite Index ) which is the Index from South Korea also is in need of more upside which is supporting the sequences in the $Nikkei and should be reaching the 100% Fibonacci extension of the rally from 1980 low related to 2008 low. To explain better the Summit, which appears to be a sharp contrast to 2017 when the peninsula appeared to be in a conflict mode, has nothing to do with the Market. That was used as an excuse for many market selloffs, but the truth is that the market continues to be very technical and is pointing to another rally which makes the case for a positive outcome in the Summit. Besides the Summit between the two Korean leaders, later the North Korean leader will meet with President Trump which should ideally provide further fuel to the rally, so $KOSPI will rally into the 2891-3365 by 2020-2020, then something will happen around the World to justify another Market correction like in 2017 the escalation of of missiles and nuclear tests did. The Fire and Furry by President Trump justified the selling in early 2018. At the end, the Market is purely technical and Political events are nothing more than events which are used to fill the headlines by the Market Makers.

The following chart shows the Elliott wave count in $KOSPI since 1980 and the target which should be seen by 2020-2022, the Index is currently, like every world index, in a correction since 1.2018 and should rally soon, maybe by the Summit end around 4.27.2018 which coincides with the window for a turn in our timing cycles which lies between 4.25.2018 and 5.5.2018.

$KOSPI Long-Term Elliott Wave Analysis
KOSPI-KOR20180403093505.jpg


The Following chart show the Weekly Elliott wave sequences in $NIKKEI showing the target and the current correction which also should end by the time the minor wave (4) ends in $KOSPI.

NI225-sequences-time-and-price20180403093709.jpg


The Following chart show the overlay of $NIKKEI and $KOSPI showing The One market Only concept and the direction in both Indexes.

NI225-sequences20180403094136.jpg


Our strategy remains to buy the dips and let the Summit to fuel the rally which will happen not matter what the result. The Elliott wave Technique we use is favoring an outcome from the Summit which would be favorable to the World Indices and thus, the Horizon for the North and South Korean peace is looking good.
 

Elliottwave-Forecast

Master Trader
Feb 17, 2017
2,451
9
84
www.elliottwave-forecast.com
Market Nature and The Elliott wave Theory

The human nature by definition is the general psychological characteristics, feelings, and behavioral traits of humankind. As such, everyone shares this nature. Similarly, the market also has a market nature and since it is created by humans, we can try to understand what the market nature is. Today’s market is the result of either manual trades by individual traders or automated computer’s algorithm which itself is also created by humans. The computer follows the same technique in each time frame and repeats the same condition over and over again.

Ralph Nelson Elliott, a professional accountant, discovered the underlying social principles and developed the analytical tools in the 1930s. He proposed that market prices unfold in specific patterns, which practitioners today call “Elliott waves“, or simply “waves”. Elliott published his theory of market behavior in the book The Wave Principle in 1938, summarized it in a series of articles in Financial World magazine in 1939, and covered it most comprehensively in his final major work, Nature’s Laws: The Secret of the Universe in 1946. Elliott stated that “because man is subject to a rhythmical procedure, calculations having to do with his activities can be projected far into the future with a justification and certainty heretofore unattainable.” We can relate the last paragraph to the Human Nature and as a result, the Market Nature is the Market created by Humans.

We believe the Market follows their own Natural code which we call sequences. Mr. Elliott calls it the Pattern or the Fractal nature of the Market. The Market advances in 2 sequences, the Impulse which comes in sequences of 5-9-13 or the corrective sequences which come in 3-7-11. What we have developed at Elliotwave-Forecast (EWF) is a new understanding of The Elliott wave Theory which states that trend can advance in 5 waves or 3 waves and that at the end, every 5 waves becomes a 3 waves.

After doing more than 7000 charts every month, it is clear that the Market follows a rhythmical movement and repeats itself time after time. As humans, we do have a Biorhythm which by definition is a person’s biological cycles that affect his or her ability in various domains such as mental, physical and emotional activity. These cycles begin at birth and oscillate in a steady (sine wave) fashion throughout life, and by modeling them mathematically, it is suggested that a person’s level of ability in each of these domains can be predicted from day to day. This theory is built on the idea that the biofeedback chemical and hormonal secretion functions within the body could show a sinusoidal behavior over time. The relation here is the word cycles.

We at EWF believe that the Market follows cycles like Human’s Biorhythm and also creates repetition like the Human Nature, so it is easy to see and understand that The Market has its own Nature. The Nature is a relationship between the Sequences, the cycles in prices and time and also the repetition of the patterns which need to be related in time and prices. This relationship between sequence and cycle occur in multiple time frames, thus we can have an instrument ending a sequence in one time frame, but this sequence is part of a higher sequence. After ending a sequence, the instrument can correct then it can keep trading at the same side, or the instrument can also reverse the direction after ending the sequence if the higher time frame is against the lower time frame.

The Elliott wave Theory helps us a lot to understand The Market Nature, but without a proper understanding of The Market Nature, there is no way the Elliott wave Theory can be applied. Elliott wave is very subjective and one of the reasons is because it was developed in the 1930 and has not gone into any revision. Traders keep following the same rules and we improve and add to the rules at Elliottwave-forecast so that it works better with today’s Market Nature.

Market Nature: The Five Waves Pattern (Motive and Corrective)
A Classic Elliott wave Theory’s pattern which runs a sequence of 5 waves and 3 waves back. In this sequence, the Market ends 5 waves in the smaller time frame, but follow the direction of the 5 waves to develop either 9 swings or 3 waves from the beginning of the lesser degree 5 waves.


$FTSE did a 5 waves move from the lows at 3.2009 in the Daily Time frame. It has a higher Bullish sequence in the Weekly charts which makes the 5 waves move valid and result in more upside after a Flat correction in wave “b”. This is the case of 5 waves rally in the initial leg from 3.2009 low to wave “a”. After the initial 5 waves rally, we have a 3 waves pullback in wave “b” as a FLAT, followed by another 5 waves rally in wave “c” ending at 4.2015 high. The entire rally from 3.2009 to 4.2015 becomes a 3 waves, so an Impulse since 3.2009 low to wave “a” end up becoming a corrective zigzag structure when it ends at 4.2015 high.


Corrective Market Nature: 7 Swing WXY Elliott Wave Structure
In the Classic 7 swing WXY structure, the Market does 3 waves move, then it corrects in 3 waves followed with another 3 waves move to the same direction of the previous 3 waves. In total, it has a 7 swing structure or WXY in the Elliott Wave Theory.


In this case. HG#F did what we call a 7 swing structure lower which is corrective by Nature. The trend since 12.2017 peak until 3.2018 low is bearish, but this bearish trend is only in the lower time frame (1 hour and 15 minute time frame) The higher time frame is impulsive and has a Bullish sequences, so we recommend buying at the Blue Box.


Understanding how the Market Nature provides an edge to traders. We can pick the right side in different time frames and relate them to create a reliable or higher probability forecast. Nobody can forecast the Market 100% correct, but understanding the Nature will help you tremendously in becoming a better trader and remove some of the subjective nature of The Elliott wave Theory.
 

Elliottwave-Forecast

Master Trader
Feb 17, 2017
2,451
9
84
www.elliottwave-forecast.com
Nifty 50 Index Bullish Sequence to the All Time Highs

April 11, 2018 By EWF Lewis (Edit)

The Nifty 50 Index has a bullish sequence from the lows to the all time highs. The index currently shows nine swings up from the all time lows into the 2018 highs. It is now correcting the cycle higher from the February 2016 lows. This is noted on the chart with the red 8 label. In this article there is not an Elliott Wave count on the chart as it’s the natural swing count the price and momentum indicators suggest. Notice from the all time lows to the 2008 highs appears to be 3 swings as noted with the red 3 on the chart. Next, the dip into the 2008 lows was strong enough to suggest it was then correcting the whole cycle from the beginning. That was the 4th swing.

From the point of the 2008 lows there are a couple of preferred ways to put Elliott Wave labels on the move. I will focus toward the possibility of there having been a leading diagonal wave one with the 2008 lows being a wave two. If so, then it already saw a wave three that subdivided in three swings into the 2015 highs. That is marked with the red 7 and is similar to the wave one.

Continued below chart.

Nifty 50 Index Swing Sequence


The dip into the 2016 lows was strong enough to suggest it was correcting the cycle from the 2008 lows. This affirms the idea wave four is at the 2016 lows marked with the red 8. The bounce from there into the 2018 highs of course is the swing marked with the red 9. At this point of the 9th swing high, another option is possible as far as an Elliott Wave count. This 2018 high can be the larger wave three high of the cycle that started in 2008. The other is it only half of the fifth wave which would still need another swing higher.

In conclusion, there are several other correlated instruments and world indices with bullish sequences. All of these are only correcting the cycle up from the 2016 lows. It is all one market and his index should be no different. The longer term bullish up trend has temporarily stalled. After this correction of the cycle up from the 2016 lows it should see another move higher.
 

Elliottwave-Forecast

Master Trader
Feb 17, 2017
2,451
9
84
www.elliottwave-forecast.com
Elliott Wave Analysis: Gold in Sideways Range


Gold short term Elliott Wave view suggests that the yellow metal is in a sideways move, typical characteristic of a triangle Elliott Wave structure. A triangle is a sideways range structure with ABCDE label. In the case of Gold, decline from 1/25/2018 peak ($1366.06) ended in Minor wave A at $1302.6. Minor wave B bounce ended at $1356.83. Minor wave C is currently in progress and while bounces stay below $1356.83, the metal is expected to extend lower.

Internal of Minor wave C is unfolding as a double three Elliott Wave structure where Minute wave ((w)) ended at $1321.1, Minute wave ((x)) ended at $1348.4, and Minute wave ((y)) of C is in progress towards $1303.97 – $1312.44 before the metal turns higher and resume the consolidation. Near term, expect Minutte wave (b) bounce to end at $1342.91 – $1346.74 area before the metal turns lower in 3 waves at least. Due to the sideways range, we prefer to stay on the sidelines waiting for break above $1366.06 or below $1302.6. The current view suggests that Gold is in a bullish triangle, thus it’s best to wait for a break above $1366.06 to signal the end of the triangle before looking to buy dips in 3, 7, or 11 swing.

Gold (XAUUSD) Elliott Wave 1 Hour Chart


Elliottwave-Forecast

Master Trader
Feb 17, 2017
2,451
9
84
www.elliottwave-forecast.com
Ruble Falls Following US Sanctions Against Russia


New U.S. Sanctions Hurt Russia’s Ruble and Benchmark Index
Last Friday, as part of the U.S. effort to punish Moscow for “malign activity around the globe”, the U.S Treasury Department targeted numerous Russian oligarchs, officials, and companies by freezing their assets under U.S. jurisdiction. In addition, the U.S. also prohibits U.S. citizens or entities from doing business with the sanctioned Russian entities. The Russian Ruble continues to plunge for the second day in a row by more than 4.5% after the sanctions. The Ruble’s 1 month volatility jumped 2.6% points to 11.9%, the highest among the world’s currencies after South Africa’s Rand.


The sanctions not only hurt the Ruble, but it also hurts the stock and bond markets as well. Benchmark MOEX Russia Index plunged by 8.7% on Monday following the sanction. Rusal, a Russian aluminum producer targeted by the sanctions fell by 50% in the Hong Kong stock exchange. Yields for the ruble-denominated bonds sky rocketed on the news of the new U.S. sanctions.

The new measures come amid deteriorating relationship between Russia and the West over the poisoning of Russian ex-spy Sergei Skripal In U.K last month. Mr. Sergei was killed using a military grade nerve agent that London and United States link and put the blame on Moscow. In addition, the U.S has also accused Russia of meddling in the 2016 U.S. presidential election. Then in the latest chemical attack outside Syria linked to Assad, President Donald Trump has warned of a “big price to pay” as he accused Kremlin sharing the responsibility for backing Syrian President Assad.

Ruble (USDRUB) Long Term Elliott Wave View


Long Term Elliott Wave view of Ruble suggests that the rally from all time low could be unfolding either as an impulse (5 waves) or a zigzag (ABC) Elliott Wave structure. The rally from Grand Super Cycle wave ((II)) to wave ((III)) has an extension compared to wave ((I)), with more than 161.8% extension, suggesting that it is possible that the move to Jan 21, 2016 high at 85.84 is only wave ((III)) and thus it should have more upside to finish wave ((V)) from all time low. The decline to wave ((IV)) at 55.76 on Feb 26, 2018 falls between 38.2 and 50% retracement of wave ((III)). As far as USDRUB stays above 55.76, it can resume higher to new all time high in wave ((V)) or at least do larger 3 waves bounce to correct cycle from Jan 21, 2016 peak. Alternatively, the move to 85.84 on Jan 21, 2016 could be ending a zigzag ((a))-((b))-((c)) from all time low. In this scenario, the pair should be correcting the entire rally from all-time low and thus any rally should fail below Jan 21, 2016 peak (85.84) for further downside at least another leg.
 

Elliottwave-Forecast

Master Trader
Feb 17, 2017
2,451
9
84
www.elliottwave-forecast.com
EURNZD Forecasting The Decline after Elliott Wave Flat


Hello Fellow Traders. In this technical blog we’re going to take a quick look at the Elliott Wave charts of EURNZD published in members area of the website. We’re going to explain the forecast and Elliott Wave Pattern. Before we take a look at the real market expample of Expanded Flat, let’s explain it in a few word.

Elliott Wave Expanded Flat is a 3 wave corrective pattern which could often be seen in the market nowadays. Inner subdivision is labeled as A,B,C , with inner 3,3,5 structure. Waves A and B have forms of corrective structures like zigzag, flat, double three or triple three. Third wave C is always 5 waves structure, either motive impulse or ending diagonal pattern. It’s important to notice that in Expanded Flat Pattern wave B completes below the start point of wave A, and wave C ends above the ending point of wave A which makes it Expanded. Wave C of expanded completes usually close to 1.236 Fibonacci extension of A related to B, but sometimes it could go up to 1.618 fibs ext.

At the graphic below, we can see what Expanded Flat structure looks like.


EURNZD Elliott Wave 1 Hour Chart 04.06.2018

As our members know, we’re labeling short term cycle from the 1.71645 peak as 5 waves structure. Wave ((ii)) ended at 1.71423 high and now the pair remains is correcting short term cycle against that peak. As far as proposed pivot stays intact we should ideally see another leg lower in wave ((v)). Currently wave ((iv)) recovery is in progress. It’s unfolding as Elliott Wave Expanded Flat structure, with inner labeleing (a)(b)(c) blue. As we can see wave (b) has broken below the start point of wave (a),while wave (c) has broken above ending point of wave (a) which makes this structure Extended. Currently the pair is ending wave (c) as 5 waves rally from the low. The pair is expected to find sellers at 1.6884-1.6921 area for another leg lower wave ((v)) .


Eventually EURNZD has found sellers at proposed area :1.6884-1.6921 and gave us decline in wave ((v)). On April 10th, the pair has made the new low as we expected.
 

Elliottwave-Forecast

Master Trader
Feb 17, 2017
2,451
9
84
www.elliottwave-forecast.com
Elliott Wave Analysis: USDCAD Moving in Impulsive Structure


USDCAD Short Term Elliott Wave view suggests that the decline from 3/19 high (1.313) is unfolding as a 5 waves impulse Elliott Wave structure. Down from 1.313, Minor wave 1 ended at 1.2819, Minor wave 2 ended at 1.2943, and Minor wave 3 is in progress. Internal of Minor wave 3 also unfolded as an impulse with a nest. Minute wave ((i)) of 3 ended at 1.2771, Minute wave ((ii)) of 3 ended at 1.2847, and Minute wave (((iii)) is unfolding as a 5 waves of lesser degree.

Down from Minute wave ((ii)) at 1.2847, Minutte wave (i) of ((iii)) ended at 1.274, Minutte wave (ii) of ((iii)) ended at 1.2819, and Minutte wave (iii) of ((iii)) should complete with 1 more leg lower. Afterwards, expect pair to do minor bounce in Minutte wave (iv) of ((iii)) before turning lower again. While Minor wave 2 pivot at 4/2 high (1.2943) stays intact, expect pair to extend lower a few more legs before ending the entire 5 waves structure from 3/19 high. We don’t like buying the pair.

USDCAD Elliott Wave 1 Hour Chart


Elliottwave-Forecast

Master Trader
Feb 17, 2017
2,451
9
84
www.elliottwave-forecast.com
Geopolitical Tension Could Be Catalyst for Gold’s Rally

Rising Geopolitical Tension between U.S. and Russia
The geopolitical tension between the United States and Russia escalated rapidly in the past two weeks. Two weeks ago, the U.S. Treasury Department announced fresh sanctions against Russian oligarchs and companies due to “Russia’s malign activity around the globe”. This new sanctions have caused economic pain to Moscow with Russian Ruble and MOEX benchmark index plunging.

The tension between the two countries escalated further after the use of nerve agent to poison a Russian ex-spy and his daughter in England in March, which is blamed on Russia. This then follows the alleged chemical weapons attack at the town of Douma in Syria on April 4 by the Assad’s regime. More than 80 civilians were reported dead and hundreds suffered symptoms consisted with reaction to a nerve agent chlorine and sarin. President Trump condemned the attack to Assad, Russia, and Iran in his personal tweet and threatened a big price to pay


The verbal exchange continued as Russia responded by saying they could shoot down missiles from the United States if they attack Syria. President Trump in turn followed up in his tweeter:


Late last week President Trump seemed to dial back from his threat of imminent strike, perhaps as criticisms come that he should not tip this kind of decision in social media as it will eliminate any element of surprise. Or perhaps President Trump wants to wait for the weekend to carry the strike to reduce the impact on the market and allows market participants to digest the development without over-reaction.


War Breakout in Syria
Over the weekend however, President Trump followed up on his threat. The coalition forces of the United States, U.K, and France launched a precision military strike in Syria. The strike was limited in scope and target three Syrian chemical weapons facilities. The U.S. was particularly focused on targets which do not involve Russian forces in Syria and reduce the risk of civilian casualties.

The military action was designed to be limited in scope to deter the use of chemical weapons. The U.S and its allies do not want to get involved in the civil war which has raged for years in Syria involving militias, terrorist groups, and other world powers. It remains to be seen if the goal could be achieved and it will be interesting to see the global market’s reaction when it opens next week.

Gold’s Technical View
Gold traditionally is seen as a a safe haven instrument in times of uncertainty and turmoil. Technically, the long term technical picture appears bullish and the current geopolitical turmoil could be the catalyst needed for the next leg up

Gold vs Yen (XAUJPY) Technical Chart


Weekly chart of XAUJPY above shows that the instrument has been trading in sideways triangle Elliott Wave structure for 5 years since year 2013. Triangle is typically a continuation structure. and as the previous trend before 2013 is higher, it’s likely to resume higher again once the sideways consolidation is complete

Gold vs USD (XAUUSD) Technical Chart


Weekly chart of XAUUSD above shows that the metal has ended cycle from 2011 peak, as seen in the break above the trend line. In addition, it has formed a 5 year base, an inverse head and shoulder like pattern. In the near term, it has not been able to break the neckline, but a break above 1/25/2018 peak ($1366) should give signal the next leg higher has started.

Gold 5 swing bullish sequence from 2016 low


In addition to the weekly chart which shows a 5 year basing pattern, XAUUSD daily sequence chart above also shows a 5 swing sequence from 2016 low, favoring further upside towards $1451 – $1529 area to complete 7 swing double three Elliott Wave Structure (WXY), provided that pullbacks stay above 12.2017 low ($1236.66). Please note that the number on the chart represents on the swing count, not an Elliott Wave count.