Elliottwave-Forecast

Master Trader
Feb 17, 2017
2,453
9
84
www.elliottwave-forecast.com
Elliott wave Theory and Market Timing

In this blog, we will talk about the concept of Market Timing. Market is a wild animal which always, is in full control. Many traders want to trade every day and always getting in and out of the market which ends up more like gambling than trading. We at Elliottwave-Forecast have practiced the Elliott wave Theory for years and we have been guilty of many early entries into the Market following the Theory. Years ago, we started practicing The One Market only concept which allow us to see the Market as a whole. The Idea allows you to be able to pick 1 or more instruments showing a clear structure within either the 3-7-11 or 5-9-13 sequences and using them as a guideline to trade the other instruments within the same group and sometimes within other groups also. In other words, we are able to use the correlation among instruments to pick the right timing to enter the trade. We have developed a system as like many others, we have fallen victim to the suggestive nature of the Elliott wave Theory. It is almost impossible to trade based in the Theory alone and it gets even more difficult when you are trading based in the Theory alone and without correlation i.e. analysing and trading instruments in isolation rather than using correlation and One Market Only concept. Our system divides the market in groups and within the groups we locate the instruments with a better structure, we locate the cycles and sequences and then identify the areas in which the market should turn, we call these areas ceilings or floors. This technique helps tremendously with the timing both as a forecaster and trader and without this technique, it’s extremely difficult to trade using the Elliott wave Theory. The difference now compared to when the Theory was developed is that now, we are able to see many instruments as compared to only a few before so why not taking advantage and use groups and correlation to get an edge in the market.

Most World Indices dipped early in the year and $IBEX entered the correction early in 2017, we knew that $IBEX was the Floor and we told members to wait for the Index to reach the Floor to gather the timing in World Indices to end their respective corrections.

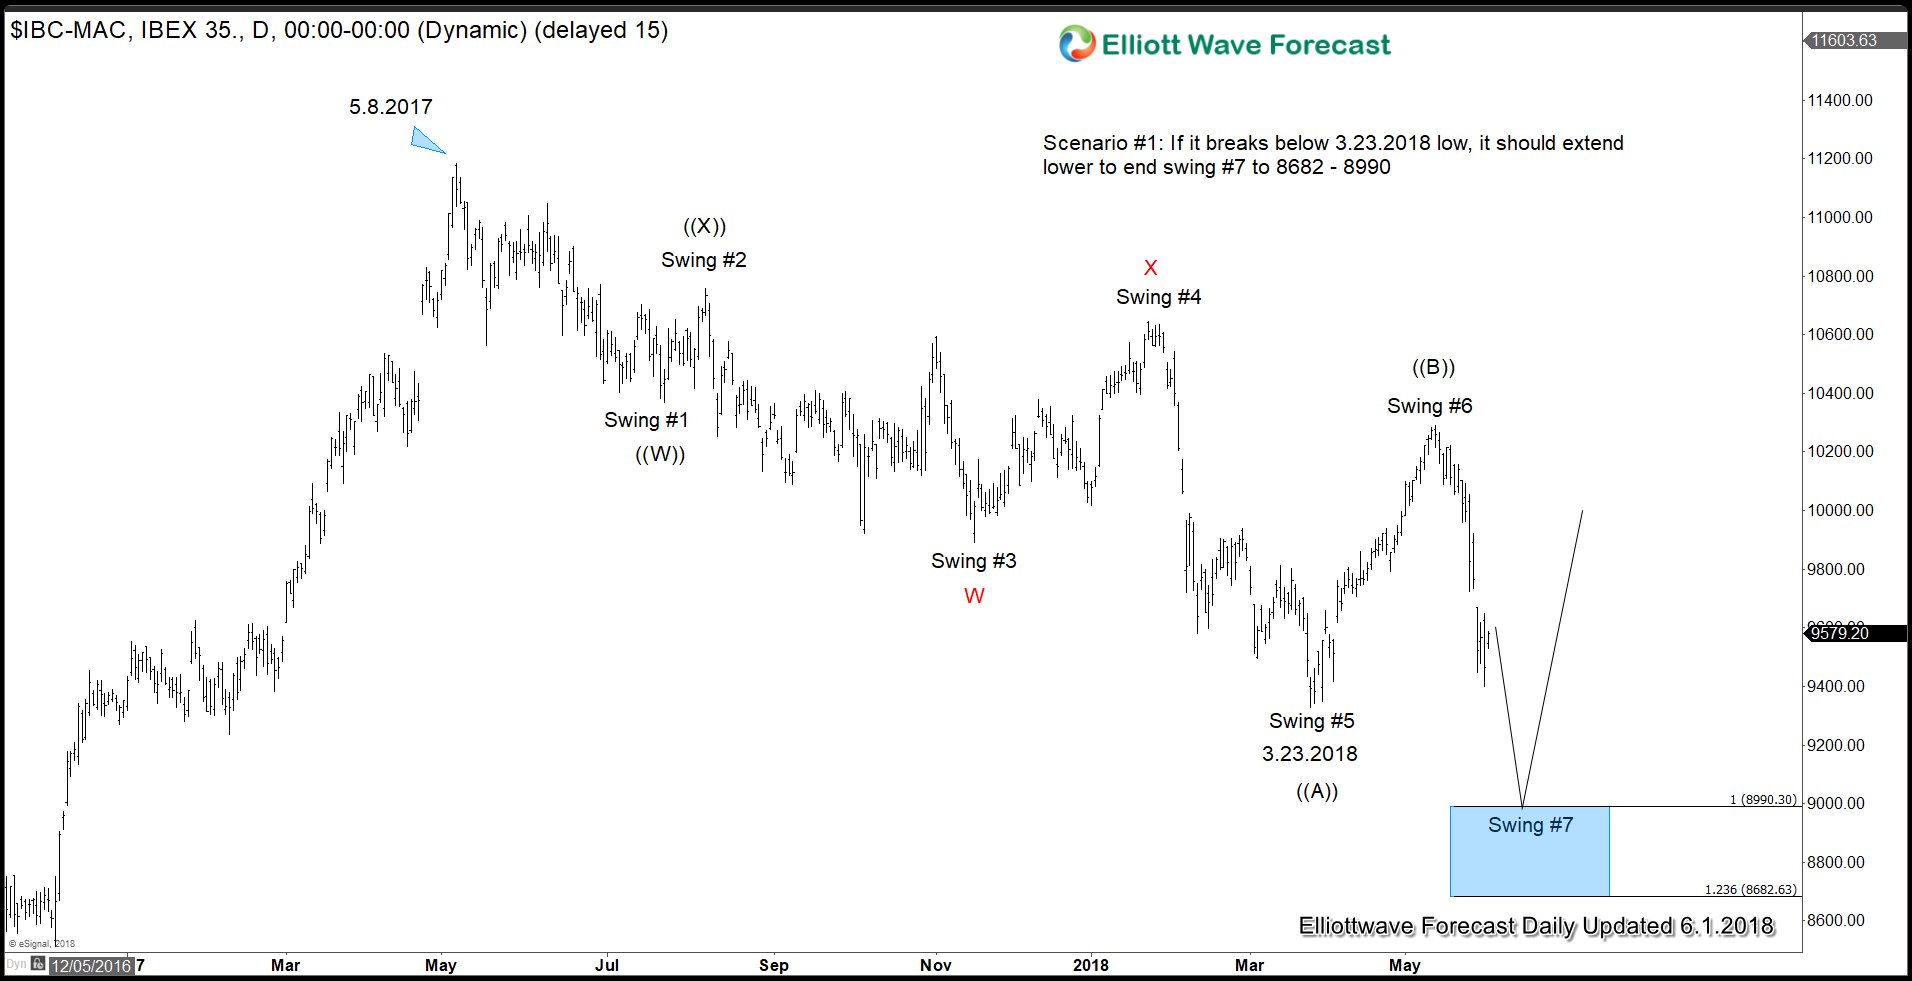
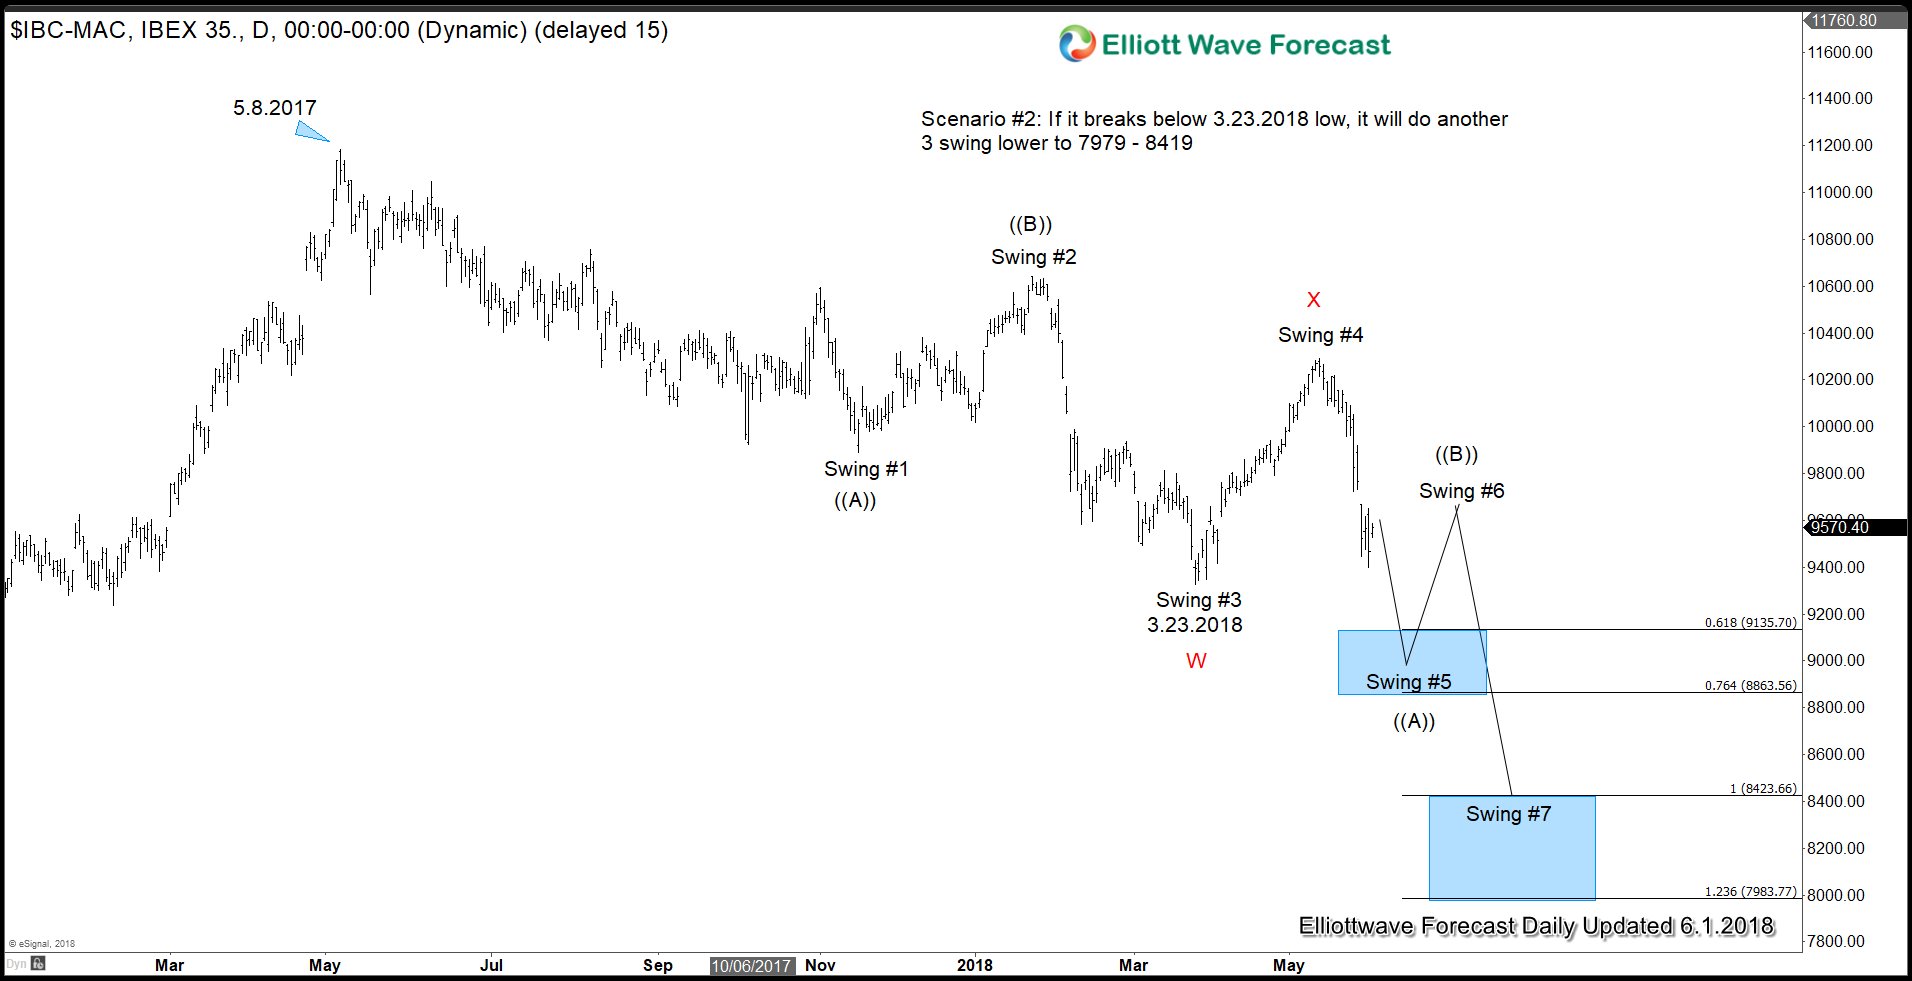
Below is the Daily chart of $IBEX at 1.2018 when the Index was doing a (X) wave, we were calling lower knowing the rest were about to peak.

IBEX Daily Elliott Wave Analysis – Market Timing – January 2018
IBEX-Yearly-forecast.png

Below is the $FTSE Daily chart at 1.2018, we knew have reached the Blue Box and a dip was about to happen, it was only a matter of time.

FTSE Elliott Wave Analysis – Daily Time Frame – January 2018
FTSE-January-2018-daily-chart.jpg


Here is the latest chart of $IBEX showing the bounce from the Blue Box after reaching the floor. Blue box represented the buying area from where we have already seen a reaction higher and any longs from the blue box should already be in a risk free position now.

IBEX-DAILY20180512100911.jpg

Here is the $FTSE latest Daily chart showing the reaction higher. $FTSE Index is about to break above the previous peak seen in January 2018 and a break of that peak would be the confirmation that next leg higher has started. To know the targets, check out this blog about $FTSE leading the World Indices higher.

UKX-FTSE-DAILY20180512114414.jpg


This is a text book Market timing and understanding Market nature which without is impossible to ride the Wild Horse named Market. The Reason why Indices like $FTSE have been rallying since early February have nothing to do with Fundamentals or anything else, it is all about the Timing which in this case was $IBEX, We hope you guys understand our ideas and become a better trader understanding that nothing is perfect, but having a system help a lot and understanding the nature even more.
 

Elliottwave-Forecast

Master Trader
Feb 17, 2017
2,453
9
84
www.elliottwave-forecast.com
Elliott Wave Analysis: EURJPY Has a Bearish Sequence

EURJPY short-term Elliott Wave view suggests that the bounce to 5/14 high at 131.38 ended Minor wave B. Down from there, the decline is unfolding as Elliott wave impulsive structure in Minor wave C lower. The internal sub-division of each leg lower is showing 5 waves structure in lesser degree cycles, which is characteristic of an an impulse. Also, it’s important to note here that the below chart is showing a bearish sequence tag, which refers to the incomplete downward structure in the pair.

Below from 131.38 high the lesser degree Minutte wave (i) of ((i)) ended in 5 waves structure at 129.49. Above from there, the bounce to 131.35 high ended Minutte wave (ii) of ((i)) as a double three structure. Then the decline to 128.22 low ended in Minutte wave (iii) of ((i)) with another 5 waves structure. Up from there, the lesser degree Minutte wave (iv) of ((i)) ended at 129.06 high. Down from there, Minutte wave (v) of ((i)) ended at 127.94 low in another 5 waves. Above from there, the pair is correcting the short-term cycle from 131.38 high within Minute wave ((ii)) bounce which is epxected to fail in 3, 7 or 11 swings for further downside extension. We don’t like buying it into a proposed bounce.

EURJPY Elliott Wave 1 Hour Chart
 

Elliottwave-Forecast

Master Trader
Feb 17, 2017
2,453
9
84
www.elliottwave-forecast.com
EURUSD Elliott Wave View: Bounces Are Expected To Fail

EURUSD short-term Elliott wave view suggests that the decline from ( 1.1996 ) 5/14/2018 peak is unfolding as ending diagonal structure in Intermediate wave (5) lower as mentioned in the previous post here. The internals of each of leg in ending diagonal structure is the combination of a 3 waves corrective structure i.e the internal of wave 1, 2, 3, 4 & 5 unfolds as double three, zigzag etc. Ending Diagonal usually appears in the sub-division of the wave 5 of impulse or wave C of Zigzag or Flat.

Down from 1.1996 high, the decline to 1.1715 low ended Minor wave 1 lower. Then the bounce to 1.183 high ended Minor wave 2 bounce as double three structure. Below from there, Minor wave 3 remains in progress as Elliott wave double three structure where internal Minute wave ((w)) of 3 ended at 1.1644. The bounce to 1.173 at yesterday’s high ended Minute wave ((x)) of 3. Near-term focus remains towards 1.1544-1.1500, which is 100%-123.6% Fibonacci extension area of Minute ((w))-((x)) to end the Minute wave ((y)) of 3. Afterwards, the pair is expected to do a bounce in Minor wave 4 which should then fail below 1.1833 high in 3, 7 or 11 swings for more downside. We don’t like buying it the pair.

EURUSD 1 Hour Elliott Wave Chart
 

Elliottwave-Forecast

Master Trader
Feb 17, 2017
2,453
9
84
www.elliottwave-forecast.com
The CAC 40 Index Long Term Bullish Cycles

Firstly the CAC 40 index long term bullish cycles have been trending higher with other world indices. In September 2000 it put in an all time high. From there it followed the rest of the world indices lower into the March 2003 lows which was a larger degree pullback. From there the index rallied with other world indices again until June 2007. It then corrected the rally again as did most other world stock indices. It ended this larger degree correction in March 2009. From those 2009 lows, the index shows a 5 swing sequence that favors further upside.

Secondly, in January 2018 price had nearly reached the area of 5623 – 6034 which is the .618 – .764 Fibonacci extension of the 2008 to 2015 cycle. This is a usual area for a 5th swing of a cycle. The thought here is that momentum indicators suggest it ended the cycle from the 4th swing low which was in February 2016. The dip to the March 2018 lows in the 6th swing corrected the cycle up from February 2016 lows. The analysis continues below the chart.

CAC 40 Index Monthly Chart


I would like to briefly mention how the extension areas are measured which is as follows. Use a Fibonacci extension tool on a charting platform. On this chart, point 1 will be at the beginning of the cycle at the 2009 lows. From there on up to the 2015 highs, marked with a 3, will be point 2. The point 3 will be down at the 2016 lows. This point is marked with a 4. The extension areas shown are the same as long as price remains above the 2016 lows. At the time of writing it is thought the index has finished the 6th swing pullback at the March 2018 lows. It should stay above there while continuing the trend higher.

Lastly in conclusion, the extension areas higher shown on the chart is where the index should be able to reach during this period of multiple world indices bullish trends higher. Conservatively the chart shows a usual target area for a 7 swing at the 6699-7364 area which likely will be surpassed before it ends the bullish cycle up from the March 2009 lows.
 

Elliottwave-Forecast

Master Trader
Feb 17, 2017
2,453
9
84
www.elliottwave-forecast.com
Nikkei Elliott Wave Analysis: Pullback Remains In Progress

Nikkei short-term Elliott wave view suggests that the rally to 23060 on May 20 high ended Intermediate wave (1) as an impulse. Down from there, the index is pulling back in Intermediate wave (2) pullback to correct cycle from March 23, 2018 low in 3, 7 or 11 swings before the rally resumes. The decline from 23060 high is unfolding as Elliott wave double three structure.

Double three is a 7 swing pattern, which is a combination of two corrective patterns, including Flats, Triangles, Triple three, Zigzag etc. The two corrective patterns combine together to form the double three structure. In the case of Nikkei, the decline from 23060 high to 22075 low ended Minute wave ((w)). The internals of Minute wave ((w)) unfolded as a Zigzag structure where Minutte wave (a) ended at 22475, Minutte wave (b) ended at 22640, and Minutte wave (c) of ((w)) ended at 22075.

From 22075 low, the bounce to 22560 high ended Minute wave ((x)) recovery as zigzag structure. The Index has since made a new low below 22075 and shows 5 swings bearish sequence from May 20 high (23060). Please note that 5 swing sequence is not the same as 5 waves impulse. 5 swing sequence refers to the swing count and refers to 7 swing WXY (double three structure). The 5 swing sequence favors more downside & confirms Minute wave ((y)) lower has started. The internals of Minute wave ((y)) is also unfolding as a Zigzag structure where Minutte wave (a) ended at 21920. Near-term, while bounces fail below 22560 high, expect the Index to see another extension lower towards 21350 – 21579, which is 100%-123.6% Fibonacci extension area of Minute ((w))-((x)). Afterwards, expect the Index to at least see a 3 waves bounce. We don’t like buying the Index.

Nikkei 1 Hour Elliott Wave Chart
 

Elliottwave-Forecast

Master Trader
Feb 17, 2017
2,453
9
84
www.elliottwave-forecast.com
Elliott Wave View: Russell (TF_F) Pullback Around The Corner?

Russell (TF_F) index short-term Elliott Wave view suggests that the rally from April 02.2018 low (1482.6) is taking a form of an Elliott wave leading diagonal structure within Intermediate wave (1) higher. Leading diagonal structure usually appears as the sub-division of a wave (1) of an impulse or wave (A) of a Zigzag structure. The internal sub-division of a leading diagonal can either be 5,3,5,3,5 or 3,3,3,3,3.

In Russell’s case, the internal sub-division of Intermediate wave (1) is unfolding in 3.3.3.3.3. Minor wave 3 of (1) ended at 1643.3 as corrective 3 waves (zigzag) structure. Where Minute wave ((a)) of 3 ended at 1616.2. Minute wave ((b)) of 3 ended 1591.2. And Minute wave ((c)) of 3 ended at 1643.3. Down from there the pullback to 1607.23 low ended Minor wave 4 of (1) with internals also as a zigzag structure. When the Minute wave ((a)) of 4 ended at 1618.1 and Minute wave ((b)) of 4 ended at 1639.

Above from 1607.23 low the index has already made a new high confirming Minor wave 5 of (1) has resumed. The rally is expected to take the form of another zigzag structure. As far as near-term dips remain above 1607.23 level, the index has scope to extend higher towards 1680.67 area before ending Intermediate wave (1). Afterwards, the index is expected to do a pullback in intermediate wave (2) in 3, 7 or 11 swings before further upside is seen. We don’t like chasing it here because it has already reached the minimum extension area for Minor wave 5. I.e it has reached inverse 1.236-1.618% Fibonacci extension area of 4 at 1652.50-1666.59 area.

Russell 1 Hour Elliott Wave Chart
 

Elliottwave-Forecast

Master Trader
Feb 17, 2017
2,453
9
84
www.elliottwave-forecast.com
World Uranium Index Suggesting Higher price for the metal

World Uranium Index (URAXPD) and Uranium Futures contract tracking the spot price of the metal which ended the downtrend cycle from 2007 peak and been bouncing higher since 2016 lows. The two instrument may have different dates for the peak or low but they share the same swings and URAXPD is the one leading move at current stage to the upside.

World Uranium Index vs UX1 (Uranium Futures)


In the next chart, we overlay the majority of main commodities including Oil and precious metals which had the same low in 2016. We can notice that URAXPD is up 80% at current stage, it’s considered one of the outperforming instrument among the rest.


Looking at the daily chart of URAXPD from 2016 low, we can count 5 swings ( red count ) to the upside (which is different from the regular Elliott wave count) and we consider it as an incomplete sequence to the upside missing the final 7th swing higher toward equal legs area $337.2 – $368.5. We also can see another 5 swing ( blue count ) from 2017 low suggesting also more upside to take place toward a similar target area $314 – $332.

World Uranium Index URAXPD Elliott Wave Daily Chart


Consequently both sequence from 2016 & 2017 are bullish and suggesting that Uranium price will remain supported in the coming few months to see higher levels. Uranium does not trade on an open market like other commodities. But you can get exposure by trading a related Etf like URA or a related stock like CCJ.
 

Elliottwave-Forecast

Master Trader
Feb 17, 2017
2,453
9
84
www.elliottwave-forecast.com
USDJPY Elliott Wave view: Calling For Bounces To Fail Ahead of NFP?

USDJPY Short-term Elliott Wave view suggests that the rally to 111.40 on May 21 ended intermediate wave (A) as a Diagonal structure coming from March 26 low (104.52) cycle. Pair is currently correcting cycle from 3/26 low within Intermediate wave (B). The pullback shows overlapping price structure suggesting that it is taking the form of a corrective structure i.e either as W,X,Y or W,X,Y,X,Z structure.

Down from 111.40 high, the decline to 108.94 low ended Minute wave ((a)) of W in 5 waves. The bounce to 109.83 high then ended Minute wave ((b)) of W in 3 waves bounce. Afterwards, the decline to 108.10 low ended Minute wave ((c)) and also completed Minor wave W as an Elliott Wave Zigzag structure. Up from there, Minor wave X bounce is in progress to correct the cycle from 111.40 high. The rally should fail in 3, 7 or 11 swings for further downside correction as far as pivot at 111.4 high stays intact. Near-term focus remains towards 109.35-109.59 to finish Minor wave X. This is the 100%-123.6% Fibonacci extension area of Minute wave ((a))-((b)) of a zigzag structure. Once wave X is complete, pair should resume lower provided the pivot at 111.40 high stays intact or should react lower in 3 swings at least. We don’t like buying the proposed rally.

USDJPY 1 Hour Elliott Wave Chart
 

Elliottwave-Forecast

Master Trader
Feb 17, 2017
2,453
9
84
www.elliottwave-forecast.com
European Political Turmoil Headwind to Stock Market

Most World Indices spend time trading sideways in 2018. There are some exceptions such as FTSE from the U.K. and Russel from the U.S. which have been able to make a new high. Several factors however could slow down the move higher in Stock Market and even make the weakest among the group to turn negative on the year. These factors are:

Trade War between the U.S. and the Rest of the World could Derail Economic Growth
The Trump Administration has been engaged in trade war with China and other key allies including Canada and Europe. Earlier this month, there was a high level meeting between the U.S. and China over trade and intellectual property issue. The first round meeting produces no consensus, and US Secretary Mnuchin said that the trade issue is “on hold”. However, on Tuesday, President Trump said he would go ahead and impose 25% tariffs on $50 billion of Chinese import and restrict investment in the American high-tech industry. China threatened to retaliate.

Just today the U.S. will also go ahead and impose tariffs on steel and aluminum imports from Canada, Mexico, and European Union. They have previously been exempted and the enactment got delayed for 1 month. Condemnation from U.S allies immediately poured in and the EU threatens to introduce countermeasure. The exemptions for Canada and Mexico end because NAFTA talks took longer than expected.

Political Turmoil in Peripheral European Countries Headwind to Stock Market
Italy, the Euro zone’s third largest economy is in the midst of ongoing power struggle. Italy has been without a government since early March after inconclusive vote. The election saw two populist and euroskeptic parties perform well – the Five Star Movement (M5S) and the far-right wing Lega. Both these parties want to leave the Euro zone and if they form a coalition, or if one party wins outright, there will be a fear of potential European Union breakup. The prospect of new election have rattled investors as Italy might effectively vote to leave the Euro. Italian bonds suffered their worst day since 1992, with two year bond price falling and yields surging to 2.73%. Italy’s FTSE MIB Index is down 12% on the year.


Spain, on the other hand, faces a no-confidence vote for Prime Minister Mariano Rajoy this Friday. Last week, a former treasurer and close friend of the president was convicted of money laundering and fraud. The country’s ruling party has also been involved in an illegal kickback scheme. The recent report suggests that Basque political party would back a no-confidence vote, which if true, would guarantee the Rajoy’s downfall. Rajoy’s departure could trigger second political crisis in southern Europe. Spain’s Index $IBEX has reacted negatively with the looming vote and could continue to be under pressure if there’s uncertainty as a result of the vote.

Those factors above may provide temporary headwind to the stock market, especially the peripheral European countries.

Scenario 1: $IBEX Extending Lower in Seventh Swing


$IBEX is close to breaking below 3.23.2018 low (9327.6). A break below should open up more downside in the Index. There are two scenario that can play out assuming the Index can break below 3.23.2018. The first scenario above is the more bullish scenario where the Index just continues lower to 8682 – 8990 to finish the seventh swing. Recall that 7 swing is a WXY or commonly called double correction Elliott Wave structure.

Scenario 2: $IBEX extending lower in Fifth Swing


The second scenario above is the more bearish scenario if we assume $IBEX can break below 3.23.2018 low (93276.6). In this scenario, the decline from 5.8.2017 to 3.23.2018 low ended in 3 swing. Thus if $IBEX breaks below the pivot, it should be only still within swing #5 and can potentially extend much lower to 7983 – 8423
 

Elliottwave-Forecast

Master Trader
Feb 17, 2017
2,453
9
84
www.elliottwave-forecast.com
XLI Elliott Wave View: Dips Can Remain Supported

XLI: Industrial sector ETF short-term Elliott wave view suggests that the decline to 70$ on May 03 low ended cycle degree wave IV pullback. Above from there, the instrument rallied higher as an impulse and has scope to resume the cycle degree wave V higher. In an impulse structure, the subdivision of wave 1, 3, and 5 is also an impulse structure of a lesser degree. On the other hand, wave 2 & 4 are corrective in nature i.e double, triple three, Flat etc.

Down from 70$ low, the rally to 71.80$ high ended Minor wave 1 in 5 waves and pullback to 70.83$ low ended Minor wave 2 pullback. Above from there the rally to 75.12$ high ended Minor wave 3 in 5 waves structure and the pullback to 74.01$ ended Minor wave 4. A rally from there to 7.80$ high ended Minor wave 5 and also completed the intermediate wave (1) of an impulse. Below from there, the ETF is correcting the cycle from 5/03 low (70$) in 3, 7 or 11 swings.

Near-term focus remains towards 73.19$-72.56$ 100%-123.6% Fibonacci extension area of Minor W-X to end the intermediate wave (2) pullback as Elliott Wave double three. Afterwards, the ETF is expected to resume the upside ideally provided the pivot at 5/03 low (70$) stays intact or should do a 3 wave bounce at least. We don’t like selling it into a proposed pullback.

XLI 1 Hour Elliott Wave Chart
 

Elliottwave-Forecast

Master Trader
Feb 17, 2017
2,453
9
84
www.elliottwave-forecast.com
SPX Elliott Wave Analysis: Close To A Pullback?

SPX short-term Elliott wave view suggests that the rally from 4/02/2018 low (2553.8) is extending higher in 5 waves structure. These 5 waves are expected to be part of a leading diagonal structure within intermediate wave (1) higher. The move higher from 2553.8 low has the characteristic of a diagonal where the internal distribution of each leg higher shows sub-division of 3 waves and there’s an overlap between Minor wave 1 & 4 .

The internals of a rally from 2553.8 low ended Minor wave 1 at 2717.49 in 3 waves corrective sequence. Down from there, the pullback to 2594.62 low ended Minor wave 2 as Elliott wave double three structure. Above from there, the rally to 2742.1 high ended Minor wave 3 as Elliott Wave Zigzag structure. Below from there, the pullback to 2676.81 low ended Minor wave 4 as zigzag structure. Near-term focus remains towards 2752.9 – 2765.33, which is 100%-123.6% Fibonacci extension area of Minute wave ((a))-((b)) to end Minor wave 5. The move higher should also complete the cycle from 4/02/2018 low (2553.8) within Intermediate wave (1). Afterwards, the index is expected to do a pullback in Intermediate wave (2) and expected to find buyers in 3, 7 or 11 swings for further upside. We don’t like selling the index.

SPX 1 Hour Elliott Wave Chart
 

Elliottwave-Forecast

Master Trader
Feb 17, 2017
2,453
9
84
www.elliottwave-forecast.com
FTSE Elliott Wave View: Buying Opportunity Soon

FTSE short-term Elliott wave view suggests that the rally to 7903.50 high on 5/22/2018 peak ended primary wave ((1)). This rally to 7903.5 starts from 3/23/2018 low and took the form of an impulse Elliott wave structure. The index is currently in Primary wave ((2) pullback to correct cycle from 3/23/2018 low.

So far the decline from the peak shows an overlapping internal structure, suggesting the index is pulling back in corrective sequence i.e either as W,X,Y or W,X,Y,X,Z structure. Down from 7903.5 high, the decline to 7610.66 low ended the first leg of the pullback in Intermediate wave (W). The internals of Intermediate wave (W) unfolded as Elliott wave Zigzag structure where Minor wave A ended at 7703.26, Minor wave B ended at 7738.46, and Minor wave C of (W) ended at 7610.66.

Above from 7610.66, the bounce to 7772.12 high ended Intermediate wave (X). The internals of Intermediate wave (X) unfolded as Elliott wave double three structure where Minor wave W ended at 7727.45, Minor wave X ended at 7651.412, and Minor wave Y of (X) ended at 7772.12. Near-term, while below 7772.12 Intermediate wave (X) high, expect the Index to extend lower in Intermediate wave (Y). Intermediate wave (Y) should see more downside towards 7477.94-7408.77, which is 100%-123.6% Fibonacci extension area of Intermediate wave (W)-(X). This move lower should also end Primary wave ((2)) pullback & Index should resume higher again. We don’t like selling the index.

FTSE 1 Hour Elliott Wave Chart
 

Elliottwave-Forecast

Master Trader
Feb 17, 2017
2,453
9
84
www.elliottwave-forecast.com
Copper Elliott Wave View: Next Extension Higher may have started

Copper ticker symbol: HG_F short-term Elliott wave view suggests that the pullback to 3.0101 on 5/30/2018 ended Intermediate wave (2). The internals of Intermediate wave (2) unfolded as Elliott wave double three structure where Minor wave W ended at 3.0195. Minor wave X ended at 3.1485 high and the decline to 3.0101 low ended Minor wave Y of (2).

Above from there, the metal has started the next extension higher in intermediate wave (3). The rally looks to unfolding as Elliott wave impulse with extension in Minor wave 3 higher. The internal sub-division of Minor wave 1 and 3 show 5 waves distribution, confirming the impulse structure. Up from 3.0101 low, the rally to 3.093 high ended Minor wave 1 in 5 waves structure. Afterwards, the pullback to 3.046 low ended Minor wave 2 and Minor wave 3 rally remains in progress and expected to complete soon. Once Minor wave 3 ends, Minor 4 pullback should take place in 3, 7 or 11 swings to correct cycle from 5/31 low before the metal extends higher again in Minor wave 5 to complete the 5 waves impulse structure from 3.0101 low within intermediate wave (3) higher. We don’t like selling the metal into a proposed pullback.

Copper 1 Hour Elliott Wave Chart
 

Elliottwave-Forecast

Master Trader
Feb 17, 2017
2,453
9
84
www.elliottwave-forecast.com
Australia Economy Beat Expectation

Australia Economy Posts Strong Q1 Growth
Australia’s 1st quarter 2018 Gross Domestic Product is growing at 1.01%, beating the expectation of 0.9%. This is the largest increase since late 2011 and brings the year-on-year growth rate to 3.1%, up from 2.4% in the previous quarter. Chart below shows the year-on-year growth of Australia’s GDP:


The figure from Bureau of Statistics suggests that the strong growth is driven primarily by exports of mining commodities. Half of the increase in GDP can be attributed to mining export growth, which is recovering from temporary supply disruptions at the end of last year. Government spending also contribute a solid one third to the economy’s growth.

Despite the strong growth, wage or price pressure remains soft. Until wage growth and inflation start to pick up materially, the RBA (Reserve Bank of Australia) should keep the cash rate on hold. However, if the above-trend growth can be sustained this year, it should feed into wages and gradually lift wages growth and inflation.

The good economic data from Australia may provide support to Australian Dollar in the short term. Below is an Australian cross pair which may benefit from today’s good news.

AUDCAD Short Term Elliott Wave Sequence


Cycle starting from 5.10.2018 low in AUDCAD shows a 5 swing bullish sequence favoring further upside as far as pullback stays above 0.9702. Pair has scope to reach 0.999 – 1.0057 area before ending cycle from 5.10 low and seeing profit taking and a 3 waves pullback.

AUDCAD 1 Hour Chart – New York Update


AUDCAD had a 3 swing pullback to 0.9848 which may have ended Minute wave ((b)). Pair should now break above Minute wave ((a)) at 0.9925 to confirm this view and to avoid a double correction in Minute wave ((b)). If pair turns lower and break below Minute wave ((b)), then it is doing a double correction (7 swing structure) and should open further downside, but as far as the dips stay above 0.9702 low, more upside is expected.
 

Elliottwave-Forecast

Master Trader
Feb 17, 2017
2,453
9
84
www.elliottwave-forecast.com
Google (GOOGL) : Elliott wave structure looking for $1250.00

Google is still within a powerful wave ((III) and in the process of ending a super cycle degree in the next few years. We believe the cycle which started at 2009 low will end sometimes between 2020-2022. By that time, Google would have reached the minimum target of $1250. It can extend even higher, and we do not see any reason yet to sell.

In contrary, the stock provided us a nice long opportunity earlier this year. We believe the stock will make a new all time high, which consequently makes it a buy in 3-7-11 waves back. The following chart provides an illustration of our view and the video also explains The One Market Concept and how Google should still trade higher within wave ((III)).

Google (GOOGL) Monthly Elliott Wave Analysis


As can be seen in the chart above, we are labelling the rally from all-time low as an impulse Elliott Wave Structure. The stock is proposed to be in super cycle degree wave ((III)). The rally to $1179.86 on January 2018 high ended Cycle Degree wave III of ((III)), and the pullback to $980.64 on March 2018 low ended Cycle Degree wave IV of ((III)). While pullback stays above $980.64, expect Google to extend higher to $1250.97 – $1322.02 to end Cycle Degree wave V of ((III)). Then the stock should pullback in Super Cycle degree wave ((IV)) to correct cycle from 2009 low before the rally resumes. We don’t like selling the stock.
 

Elliottwave-Forecast

Master Trader
Feb 17, 2017
2,453
9
84
www.elliottwave-forecast.com
Nifty Elliott Wave View Showing Perfect 5 Waves Advance

NIFTY is trading in the powerful super cycle degree wave ((III) and should have further upside in the next few years. The rally started at 2009 low and we believe the cycle will continue until 2020-2022. The minimum target of the cycle is $11507, but it can extend even higher to 12634 area, which is where 1.618 Fibonacci extension within the Grand Super cycle degree will be reached.

We do not see any reason to sell yet, and in contrary, the Index gave us a good long opportunity earlier this year. The Index should continue to make a new all time high, and the right side still remains to buy in 3-7-11 waves back. The following chart shows our view and the video also explains The One Market Concept and how The Index should still trade higher within wave (III).

NIFTY long term Elliott Wave Analysis
NIFTY-NSE-WEEKLY20180609100116.jpg


From the chart above, we can see the rally from all-time low is unfolding as an Impulse Elliott Wave Structure. The Index is currently within Super Cycle degree wave (III). The rally to 11171.55 on January 2018 high ended Primary Degree wave ((3)) of V, and the pullback to 9958.55 on March 2018 low ended Primary Degree wave ((4)) of V. While pullback stays above $9958.55, expect the Index to extend higher to $11507-12634 to end Cycle Degree wave V of (III). Then the Index should pullback in Super Cycle degree wave (IV) to correct cycle from 2009 low before the rally resumes. We don’t like selling the Index.
 

Elliottwave-Forecast

Master Trader
Feb 17, 2017
2,453
9
84
www.elliottwave-forecast.com
Dow Jones Nearing Completion of 5 Waves Impulse

Dow Jones futures ticker symbol: $YM_F short-term Elliott wave view suggests that the pullback to 24227 low on 5/29/2018 ended Minor wave 4 pullback. Above from there, the rally is unfolding as impulse Elliott wave structure with extension in 3rd wave higher. As impulse, the internal of Minute degree wave ((i)), ((iii)) and ((v)) should also unfold as an impulse with 5 waves structure.

Up from 24227 low, Minute degree wave ((i)) ended in 5 waves structure at 24715. Down from there, the pullback to 24342 low ended Minute degree wave ((ii)). The rally from there shows a strong reaction to the upside which could end Minute wave ((iii)) at 25418 high. The subdivision of Minute wave ((iii)) show lesser degree impulse structure where Minutte wave (i) ended at 24863, Minutte wave (ii) ended at 24709, Minutte wave (iii) ended at 25327. Minutte wave (iv) ended at 25093 and Minutte wave (v) of ((iii)) ended at 25418 high. Near-term, Minute degree wave ((iv)) pullback is in progress in 3, 7 or 11 swings. As far as a pivot from 24337 low stays intact, expect the Index to see another push higher in Minute wave ((v)) to end 5 waves impulse structure from 5/29/2018 low. The move higher should also complete Minor degree wave 5. We don’t like selling the proposed pullback.

Dow Jones 1 Hour Elliott Wave Chart
 

Elliottwave-Forecast

Master Trader
Feb 17, 2017
2,453
9
84
www.elliottwave-forecast.com
The Sensex Index Long Term Bullish Cycles

The Sensex Index long term bullish cycles have been trending higher with other world indices. Firstly in it’s base year 1978 to 1979 the index’s point value was set at 100. From there it rallied with other world indices trending higher into the January 2008 highs. It then corrected the bullish cycle as did most other world indices. It ended that larger degree correction in October 2008. From those 2008 lows, the index shows a 5 swing sequence that favors further upside. Price has reached and exceeded the .618 Fibonacci extension of the 2008 to 2015 bullish cycle.

Secondly, this Fibonacci extension is measured is as follows. Use a Fibonacci extension tool on a charting platform. Point 1 will be at the beginning of the cycle at the 2008 lows. From there on up to the 2015 highs will be point 2. The point 3 will be down at the 2016 lows. As earlier mentioned, the index in January 2018 saw the .618 Fibonacci extension of the 2008 to 2015 cycle. In most cases a fifth swing will end in this .618 – .764 Fibonacci extension area. The analysis continues below the chart.

Sensex Index Monthly Chart


The currently favored view is the Sensex index dip lower from the 5th swing high ended the cycle up from the 2016 lows. It did a 3 swing pullback to the March 2018 lows to complete the 6th swing. Thus at this point it is favored to remain above there during dips. The most bearish near term case is if it remains below the January 2018 highs it can continue a pullback in the 6th swing in 3 more swings. This would make a possible 7, or 11 swings to correct the cycle up from the 2016 low which should be similar to the 2nd swing pullback of 2011 or the 4th swing of 2016.

In conclusion. Either way while price is above the February 2016 lows the Fibonacci extension areas remain the same. Afterward of completion of the 6th swing pullback it should see more upside in the 7th swing toward the 44792-50078 area.
 

Elliottwave-Forecast

Master Trader
Feb 17, 2017
2,453
9
84
www.elliottwave-forecast.com
Intraday Elliott Wave Analysis: SPX Due for Pullback Soon

SPX short-term Elliott wave view suggests that the rally to 2742.24 high ended Minor wave 3 as Elliott wave impulse. Below from there the pullback to 2676.81 on 5/29/2018 low ended Minor wave 4 as Zigzag structure. Up from there, Minor wave 5 rally is unfolding as impulse Elliott wave structure with extension in 3rd wave higher. As an impulse, the internal subdivisions of Minute degree wave ((i)), ((iii)) and ((v)) should unfold as 5 waves structure. On the other hand, the corrective Minute degree wave ((ii)) & ((iv)) should unfold in any 3 wave corrective sequence i.e double three, triple, flats etc.

The first leg of the rally from Minor wave 4 at 2676.81 low ended Minute wave ((i)) as 5 waves structure at 2729.34. Then the pullback to 2700.88 low ended Minute wave ((ii). Above from there, the index rallied higher in extended Minute wave ((iii)) which ended at 2790.21 high. Down from there, Minute wave ((iv)) pullback looks complete at 2778.78 low and index can now see the last push higher towards 2801.31-2820.07 area before ending Minor wave 5. The last push higher should also complete Intermediate wave (1). Afterwards, the index is expected to do an intermediate wave (2) pullback in 3, 7 or 11 swings to correct cycle from April 3 low before further upside is seen. We don’t like selling the proposed pullback.

SPX 1 Hour Elliott Wave Chart
 

Elliottwave-Forecast

Master Trader
Feb 17, 2017
2,453
9
84
www.elliottwave-forecast.com
Nike Ending Elliott Wave 5 Waves Soon?

Nike ticker Symbol: $NKE short-term Elliott wave view suggests that the rally to 73.47 high ended intermediate wave (3) as impulse. Down from there, the stock made a pullback in intermediate wave (4) pullback as Zigzag correction when internal Minor wave A ended at 71.65. Minor wave B ended at 72.53 high and Minor wave C ended at 70.42 low which also completed the intermediate wave (4) their.

Above from 70.42 low, the rally is taking place into another impulse structure in intermediate wave (5) high. The internals of each leg higher in impulse sequence has sub-division of 5 waves structure with extension in 3rd wave higher thus favored it to be an impulse. In which, Nike case Minor wave 1, 3 & 5 has sub-division of 5 waves structure. The internal Minor wave 1 completed in 5 waves at 72.27 high, Minor wave 2 completed at 71.24 as a Flat structure. Minor wave 3 completed in another 5 waves structure at 75.91 high. Below from there, Minor wave 4 pullback is expected to complete already at 74.31 low.

Near-term, while dips remain above that level the stock is expected to see another leg higher. Approximately towards 76.14-76.58 Minor 5=1 target area to complete the Minor wave 5 of (5). And also expected to complete the primary wave ((1)) as well. Then the stock is expected to do a primary wave ((2)) pullback in 3, 7 or 11 swings before further upside is seen. We don’t like selling the stock into a proposed pullback.

Nike 1 Hour Elliott Wave Chart