
If you are trying to visualize a currency pair's trend in Forex, one way you can do it is by adding the Volume Weighted Average Price (VWAP) indicator to your charts. This guide will explain what the VWAP is, how it is calculated, what it shows us, and how you can use it in your Forex trading.
What is the VWAP indicator?
The Volume Weighted Average Price is a technical indicator that shows you the average of the price of a currency over the course of a session. The average is weighted by volume. At the start of every intraday open, the VWAP resets.
On your chart, the VWAP will look like a single line. It is easy to mistake for a moving average at a glance, but it tends to be smoother.
How is the VWAP calculated?
Here is how to calculate the VWAP:
Multiplying the tick price by the tick volume gives you the dollars traded for the transactions. Then you total those together by taking the sum, after which you divide by the total sum of tick volume.
Running this calculation by hand would involve significant time and effort. Luckily, you don't need to, as major charting platforms can do it for you. You just put in the settings you prefer, and it takes care of the math.
What does the VWAP indicator show us?
The VWAP shows you an important price level. It serves mainly as a pivot point, but can also act as a support or resistance during strong trends.
Keep in mind that the VWAP is a lagging indicator. So, sometimes, price might move in the opposite direction, breaking the trend.
Some platforms let you add lines at standard deviations from the VWAP to show overbought and oversold levels. But if your platform or indicator does not support this, you can simply add a different indicator to your chart to show overbought and oversold levels. We will give an example later on in this post with the Williams' Percent Range indicator.
It is possible to trade the VWAP on its own, but many people use it with confluence from other indicators. Showing overbought/oversold levels is optional, but it works quite well with VWAP strategies, so you may want to consider it.
How to plot the VWAP on your charts
MetaTrader 5 doesn't include a VWAP indicator in its default collection of pre-installed indicators. Neither we offer it among our custom indicators. Luckily, there are plenty of free VWAP implementations available on MQL5 Market. That means that you need to start by navigating to the Market so you can get a VWAP indicator. There, you can search for VWAP to find various free and paid VWAP indicators.
Choose which VWAP indicator you want, then download and install it. You will now be able to access it in the menu and add it to your chart.
- In the Navigator, look under Market to find the VWAP indicator you installed. Double-click on it.
- In the window that opens, click on Inputs. Here you will find whatever options the VWAP indicator you installed makes available.
To give you an example, the VWAP we installed lets you set the period, how the price is calculated, how the volume is determined, and how weekends are handled. It has options for timezone offset and visibility, as well as colors.
By default, it is set for the daily period, with price being calculated with (High + Low + Close) / 3.
Choose the settings you want, then click OK. Remember, the VWAP indicator you install could have different settings than the one that I just described.
You will now see the VWAP plotted on your chart.
Note that the line will appear "broken". This is because every period, the VWAP resets. There is nothing wrong with it, it just will look a bit odd.
How to use the VWAP while you trade
Now let's talk about how you can trade with the help of the VWAP. It's easiest to understand by taking a look at some example setups.
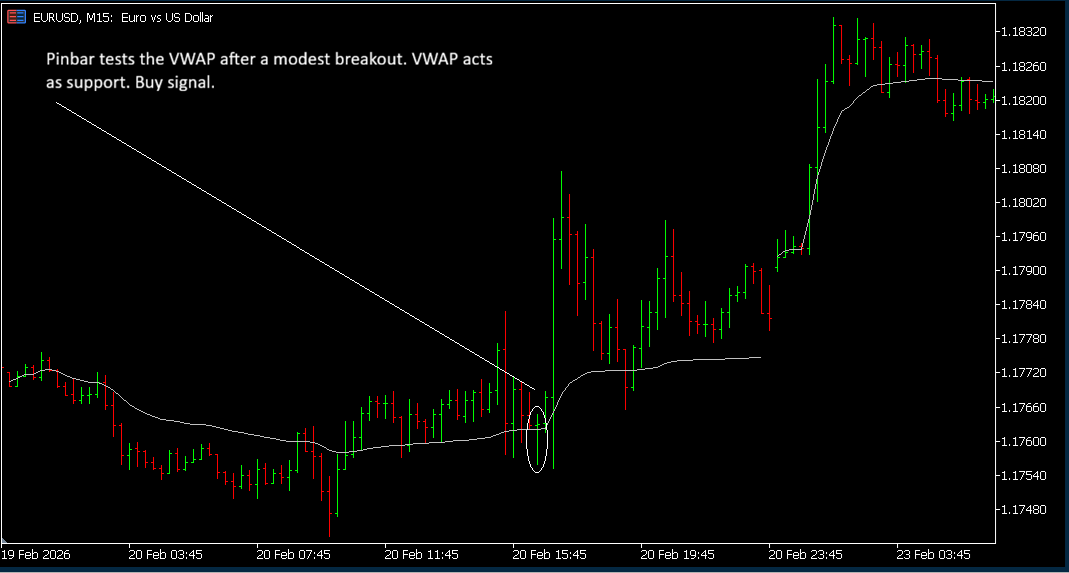
Here is an example of how you could trade with the VWAP. Originally, the VWAP was acting as resistance, with the currency pair trading below it. Then, it broke out in a modest way, and the VWAP started acting as support. A pinbar forms right at the VWAP. This shows a failed test of support, and signals you to buy. As you can see, you'd have caught a nice move upward for some quick profit.
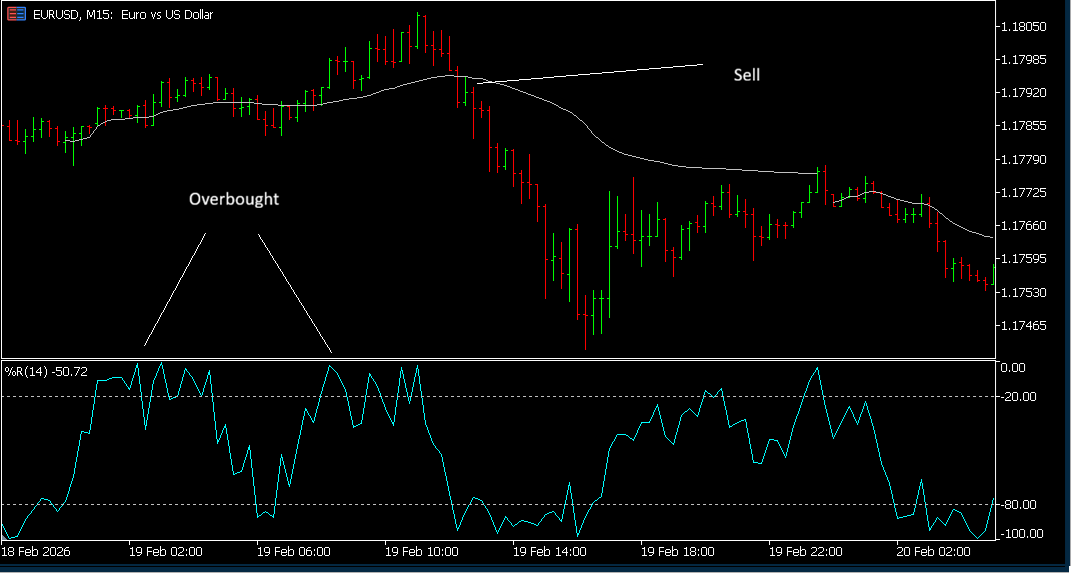
Let's check another example. Below, you see a chart with the Williams' Percent Range indicator at the bottom. When the line moves above -20, the market is overbought. When it moves below -80, it is oversold. As you can see, both times price moved above the VWAP line, the Williams' Percent Range indicator moved into the overbought territory, suggesting that price was unlikely to keep going up. The next time price dipped below the VWAP line, it took a sharp drop. That would have been a good place to enter short.
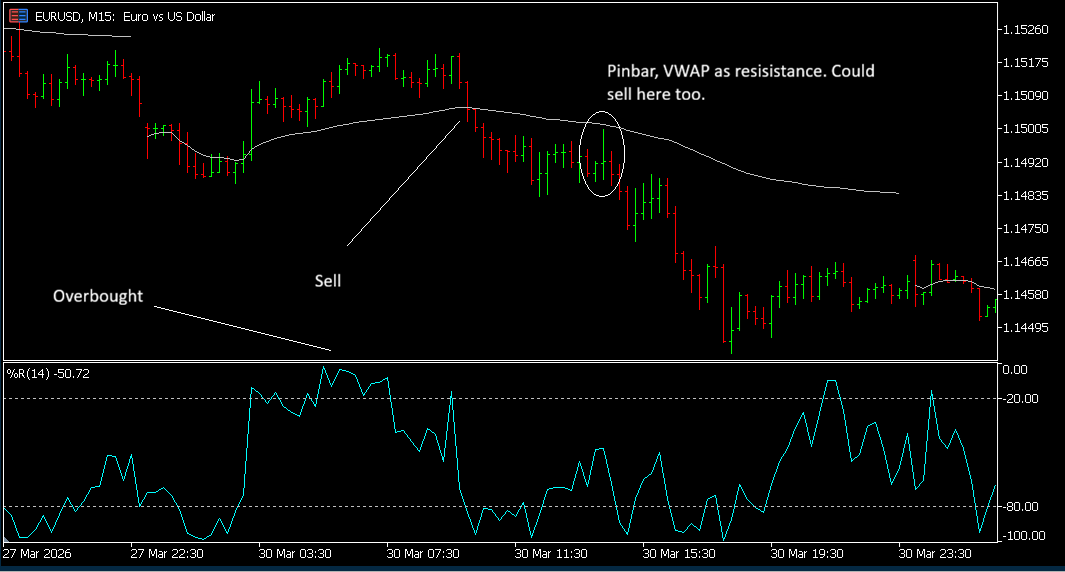
Here is another chart showing a similar scenario. You can see that the market is oversold. Price then drops below the VWAP line. You could buy there, or you could wait for the retracement. It takes the form of a pinbar, bouncing off of the VWAP, which is now acting as resistance. That would make another good entry point. You can check the Williams' Percent Range indicator at the time the pinbar formed. It is hovering halfway between the lines, so you can see it isn't oversold yet, and price still has room to drop.
General tips for using the VWAP
- Consider using the VWAP in combination with price action or other indicators for confluence.
- Remember that the VWAP is a lagging indicator, and that in volatile markets, it might not be as useful an indicator as it is in markets where price is not moving as fast. You should avoid using it if you see a lot of whipsaws (to be fair, you should generally avoid trading in those conditions with most systems).
- Come up with a trading method that uses the VWAP that allows you to replicate successes. Backtest it and demo test it before you attempt to use it with a live account funded with real money.
- Try out a free VWAP indicator before you pay for any. Make sure that VWAP strategies suit you before spending money.
If you are interested in the Volume Weighted Average Price indicator, you might also be interested in our Anchored VWAP indicator, which works as an advanced version of VWAP where you can choose where to anchor the indicator's starting point.
Conclusion
The VWAP is a handy volume indicator for visualizing the pivot price, producing a smooth, lagging line you can use in crossover strategies. Because of the lag, it works best when paired with other indicators, and/or price action patterns.


