If you are in search of a leading indicator that can help you to identify breakouts or confirm existing trends, you might consider adding the On-Balance Volume (OBV) indicator to your Forex charts.
This guide will introduce you to the OBV, one of the volume-based indicators in trading. We will tell you what it is, how it is calculated, how to add it to your charts, and how it can help you profit in the Forex markets.
What is On-Balance Volume indicator?
On-Balance Volume is a momentum indicator. When you plot it on your chart, it will appear below as a line that ranges up and down.
OBV was introduced by Joseph Granville in his book Granville's New Key to Stock Market Profits, which was published in 1963.
The theory Granville came up with was that by tracking changes in volume, we are able to make predictions about when price will move upward or downward.
The OBV line gives us a visualization of volume changes. When we see it moving up or down without price doing the same thing, Granville says it is like "a spring being wound tightly." Not long after this type of divergence occurs, we can expect price to snap like a spring in the direction of the volume change.
Key point: OBV is a momentum indicator that lets us track changes in volume. As a leading indicator, it can help us get in on breakouts early.
How is On-Balance Volume indicator calculated?
How you calculate OBV depends on how today's close compares to yesterday's close.
For our calculations:
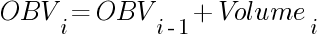
- OBVi — the current period's indicator value
- OBVi-1 — the prior period's indicator value
- Volumei — the current bar's volume
Here are the calculations:
Use this formula if today's close is greater than yesterday's close:
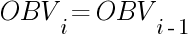
Use this formula if today's close is less than yesterday's close:

Use this formula if today's close is equal to yesterday's close:
You do not need to worry about doing this math for yourself. When you select the On-Balance Volume indicator in your charting software, it will take care of the equations for you.
Key point: The formulas above can be used to calculate OBV, but you do not need to do it. Your software will handle it.
What does On-Balance Volume indicator show?
As we discussed in our section defining OBV, it shows us changes in volume. The significance of those changes is best understood in context of what we see happening with price.
In some cases, it shows us when an existing trend is still going strong. In other cases, it lets us know that trend may be slowing down and reversing direction.
Key point: The OBV line illustrates volume changes. Its meaning depends on context.
How to plot On-Balance Volume indicator?
The On-Balance Volume indicator comes with MetaTrader 4. Here are the steps to add OBV to your chart:
- Open a chart and set it up the way you like.
- In the menu, go to Insert->Indicators->Volumes->On-Balance Volume.
- This will bring up a box where you can set your parameters. You will see that there is not a lot here to modify. Make sure to click on the Scale tab so you can choose the minimum and maximum values that display. When you are all done, click on OK.
- You will now see the indicator at the bottom of your chart. It will look like a line that moves between a negative and positive value.
Key point: It is easy to add the OBV to your charts in MT4. You can do so with a few quick clicks through the menus.
How to use On-Balance Volume indicator?
There are a few different ways you can make use of the OBV once it is on your chart. Here are your options:
Search for divergence
Much of the time, you will notice that the OBV line and price move in approximately the same direction. But sometimes, you may spot divergence.
When there is divergence, either of two things may be occurring:
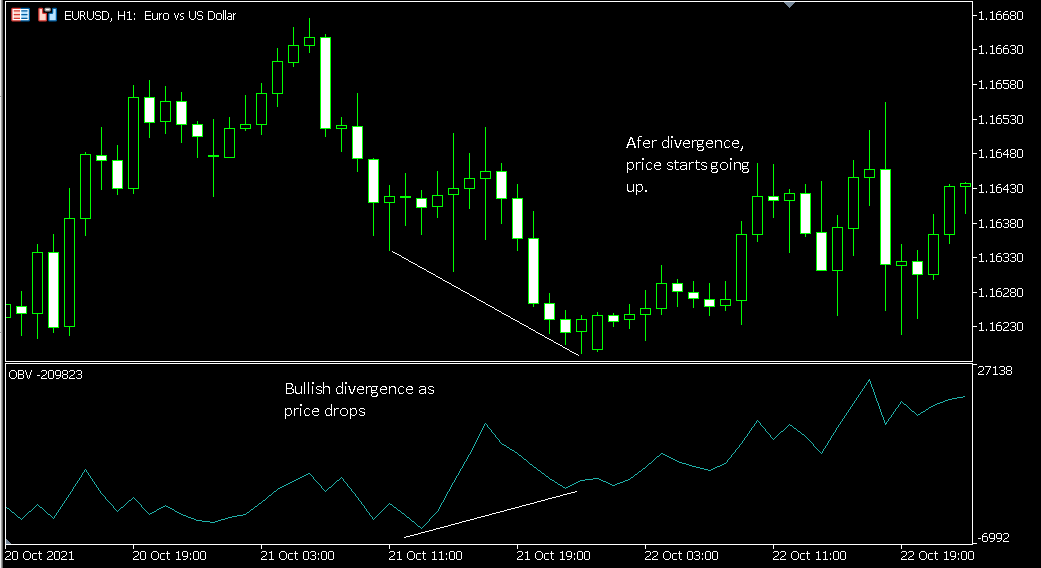
- Divergence may be bullish. In this situation, price is moving downward, but the OBV is moving upward.
- Divergence may be bearish. In this situation, price is moving upward, but the OBV is moving downward.
Both of these divergence patterns indicate that what price is doing is doing is about to change.
If price is dropping, making lower lows, while the indicator is rising, it is likely that the bearish trend is reaching an end. It may even reverse into a bullish move.
Likewise, if price is rising, making higher highs, while the indicator is falling, it is likely that the bullish trend is nearing an end. You could even see a bearish move form shortly.
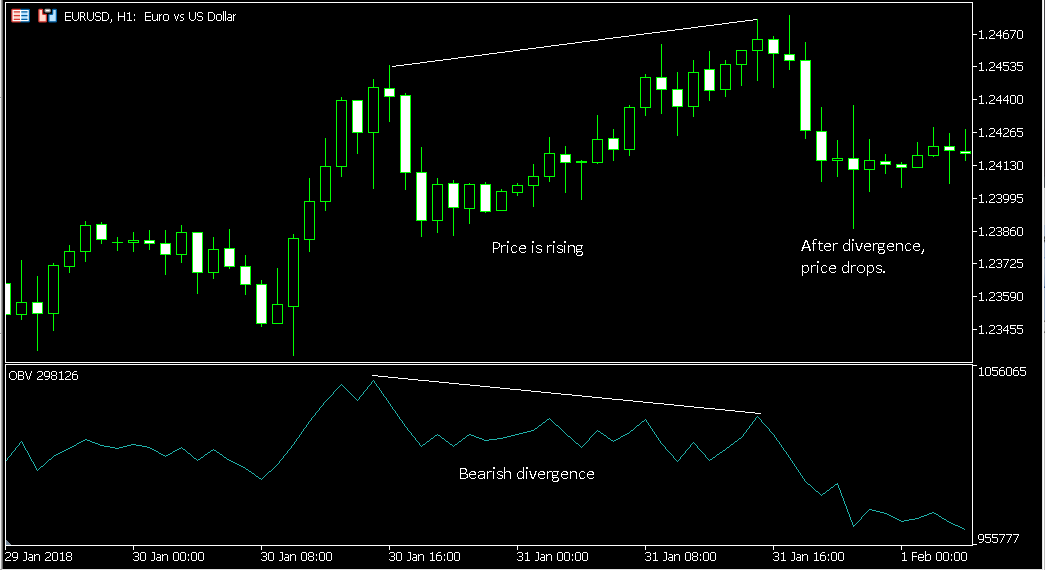
Note that when you are looking for bullish divergence, you should draw the trendline across the lows of the OBV indicator. When you are looking for bearish divergence, you should draw the trendline across the highs of the OBV.
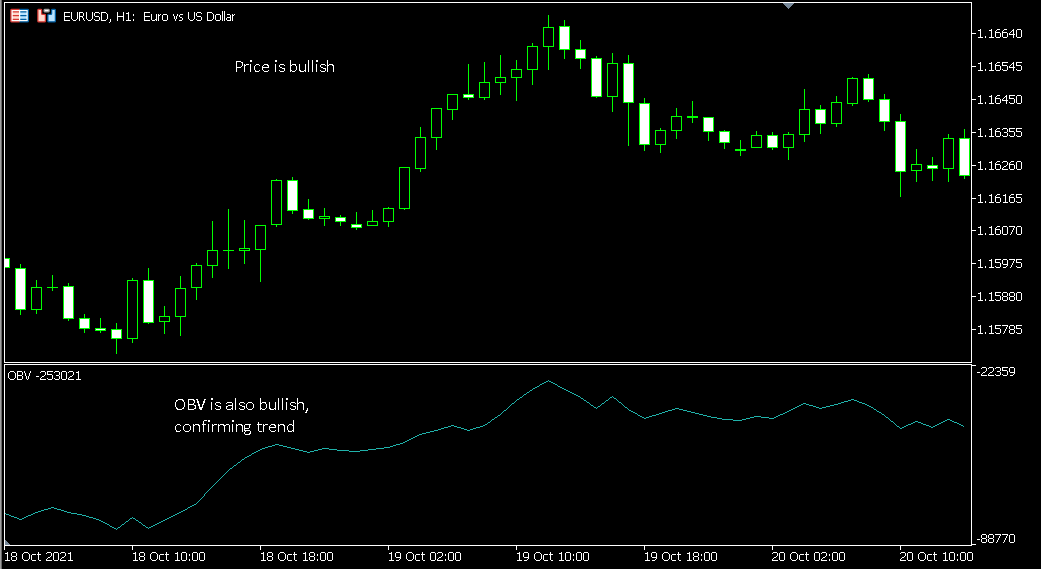
Confirm existence of trend
Something else you can do with this indicator is confirm the existence of a current trend. For instance, say that price has been trending upward. If you continue to see a matching upward movement in the OBV, then the indicator is confirming the bullish trend.
Likewise, if price has been trending downward, a matching downward movement in the OBV confirms a bearish trend.
Confirming a trend can be useful in a situation where, for instance, you might already be in a trade. You may be trying to decide whether to get out at your existing take profit or trail your stops. If the OBV confirms the trend, you might feel comfortable trailing your stops.
Ranging breakouts
So far, we have discussed using this indicator in the context of trending markets. But you can also find it useful when price is ranging.
You can think of this as a less dramatic form of divergence. Look for scenarios where price is sideways, but the OBV is beginning to move upward or downward. In either case, a breakout could be on the way.
Key point: OBV is a versatile indicator they can help you to spot breakouts, reversals, and trend continuations.
General tips for using On-Balance Volume indicator
- This indicator works best on a slower timeframe. Volatile conditions can reduce its accuracy, producing "noise" in the indicator. Indeed, for that reason, you should be cautious if you are using it during any time of high volatility, even on a slower time frame. So, for instance, when economic reports are released, you might have a harder time getting reliable results with OBV.
- You should consider using OBV alongside other indicators. While the On-Balance Indicator can give you some useful insights as you trade, on its own, it may not provide you with sufficient information to trade profitably. So, try it out with other indicators. Find a reliable way to establish confluence for stronger trades.
- As always, backtest or demo test. With any trading strategy, you should conduct extensive testing before you risk real money. That is the case when you are trading with OBV as well.
Key point: The recommendations above can help you to make the most of the On-Balance Volume indicator.
Conclusion
The OBV indicator can help you spot breakouts early. If you want to catch profitable moves in Forex, you can get in early on breakouts with the help of the On-Balance Volume indicator.
This leading indicator also can help you to confirm trends or spot situations where they might be slowing down or about to change directions.
Make sure that you incorporate the OBV into a comprehensive trading strategy with tested rules for entering and exiting your trades.