
If you want to understand what the so-called smart money is doing and catch big moves, you can try applying the Wyckoff method to Forex. In this guide, we will go over what you need to know to get started putting the Wyckoff method into practice.
What is the Wyckoff method?
The Wyckoff method is named after its creator, Richard D. Wyckoff, who came up with it early in the 20th century. It's a type of price analysis framework that identifies market cycles and shows you what institutional traders are doing. Based on the analysis you do with the Wyckoff method, you can use it to get in on breakouts or reversals.
The Wyckoff method was created with stock trading in mind, but you can adapt it to Forex and other markets too.
Wyckoff's fundamental concepts
Using the Wyckoff method for Forex trading starts with an understanding of its underlying fundamental laws.
The Law of Supply and Demand
This is a basic fundamental you probably are familiar with already. When demand is higher than supply, price for an asset increases. When supply is higher than demand, the price decreases. When supply and demand are about the same, price moves sideways.
The Law of Cause and Effect
The Law of Cause and Effect states that price moves ("effects") are created by prior periods of accumulation or distribution ("causes").
- Cause: The time and activity spent in a trading range, during which institutions are building positions.
- Effect: The price move that follows, which can be either a markup or markdown.
In general, the longer and more defined the range, the larger the potential move will be once price breaks out. Forex traders can estimate this by looking at how long price consolidates and how well support and resistance hold.
The Law of Effort vs. Result
"Effort" here refers to volume, and "result" refers to price movement.
- When volume and price are both increasing, conditions are harmonious.
- When volume is rising, but price is not moving in accord with it, a reversal may be on the way.
- If volume is declining, while price movement is increasing, conditions are not sustainable.
The Composite Man concept
"The Composite Man" is an imaginary entity that accumulates prior to the markup, and distributes prior to the markdown. It represents the sum total of the actions that institutions are taking. You could basically think of it as the smart money.
Wyckoff Market Cycles
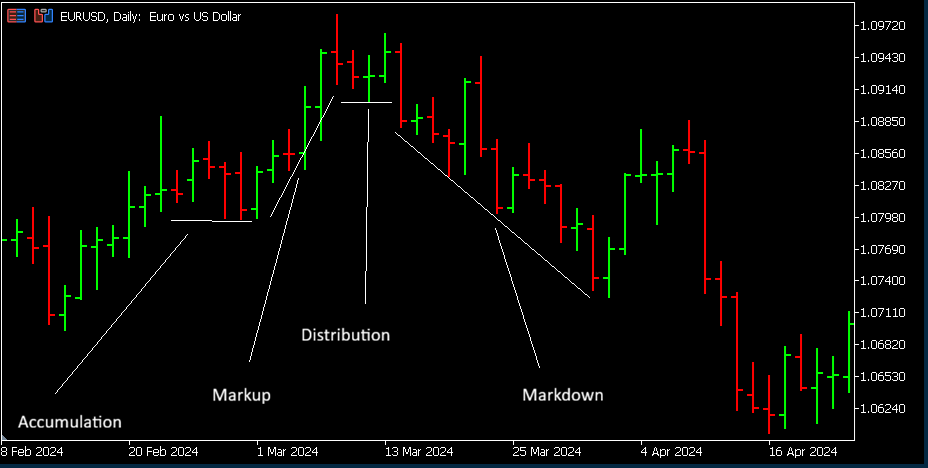
The next set of concepts you need to be familiar with to use the Wyckoff method are Wyckoff market cycles. A single cycle has four phases: Accumulation, Markup, Distribution, Markdown. You can see an example chart for these four phases below.
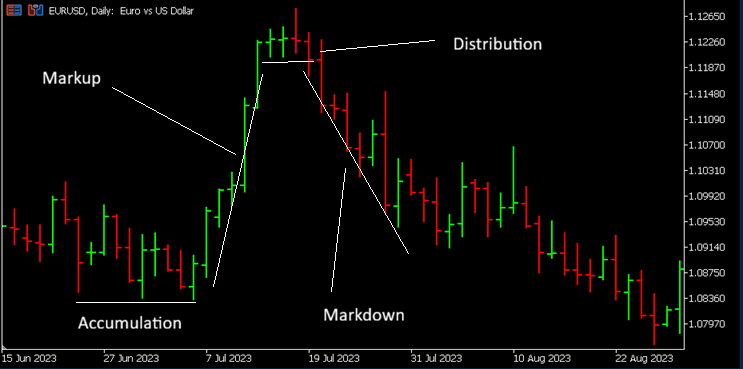
Here is another example from the same EUR/USD daily chart but earlier:
1. Accumulation
- Following a downtrend, price is moving sideways.
- Volume is decreasing.
- You'll see price bouncing along a channel bound by support and resistance.
What is happening during the accumulation phase is that the institutions are getting ready for the markup. Here is an elaborate breakdown of the events that occur during accumulation.
Phase A
- Preliminary Support (PS): This is the first bit of support you see as buying becomes more substantial after a downtrend. There may still be some downward movement, but it is nearing its finish.
- Selling Climax (SC): Price dips briefly below support, making a new low. Volume is high.
- Automatic Rally (AR): Price then retraces.
Phase B
- Secondary Test (ST): The market tests the SC again, but with less volume.
Phase C
- Spring: Price dips briefly below support, making a new low, before rebounding back into the trading range.
- Test of Spring: The spring area is retested, but the volume is lower.
Phase D
- Sign of Strength (SOS): This is where you will finally see a jump upwards in price. Volume increases.
- Backup (BU): There is one more retest, and then the markup phase starts.
2. Markup (Phase E)
- Demand now outpaces supply, and price keeps going up.
- You will see higher highs and higher lows.
- When price is moving up, you'll see a volume increase. When there is a pullback, the volume decreases.
Here is the breakdown of the markup phase:
- Initial Thrust (IT): Price moves out of accumulation.
- Backing Up to the Edge of the Creek (BUEC): This is the first noteworthy pullback.
- Secondary Test (ST): What was previously resistance is now acting as support. This is a test of that support line.
- Continuation Signs of Strength (CSOS): Price moves up, while volume is high.
- Last Point of Support (LPS): Price makes one more pullback prior to continuation.
3. Distribution
- This is the phase where institutions sell their positions.
- Price returns to ranging sideways.
- Volume goes up.
- Support and resistance lines form a channel, with ongoing tests.
Here are all the events that take place during distribution:
Phase A
- Preliminary Supply (PSY): This refers to the first resistance to kick in as the uptrend is nearing an end.
- Buying Climax (BC): Next there is high volume buying.
- Automatic Reaction (AR): After the BC, there is a pullback.
Phase B
- Secondary Test (ST): Price tests the BC high, but without as much volume.
- Upthrust (TOUT): This is a final high that peaks above resistance.
Phase C
- Upthrust After Distribution (UTAD): Price tests the same high again, but without as much volume.
Phase D
- Sign of Weakness (SOW): Volume increases and price starts going down.
- Last Point of Supply (LPSY) or Rally (R): Some sources propose there is one final rally, but a weak one, while others suggest there is an inability to rally. Demand is now exhausted, and markdown begins.
4. Markdown (Phase E)
- This is the stage where supply is exceeding demand, causing price to trend downward.
- Price shows lower highs and lower lows.
- When price is dropping, volume rises. When it pulls back, volume goes down.
Here are the events of this phase in order:
- Initial Thrust (IT): This is the downward move that signals the end of distribution and the start of markdown.
- Oversold Bounce: The first major pullback shows the asset is at least transiently a bit oversold.
- Secondary Test (ST): Price tests the resistance line that was previously a support line.
- Continuation Signs of Weakness (CSOW): Price decreases, with volume still high.
- Last Point of Supply (LPSY): This is the last weak rally.
Wyckoff accumulation schematics
Here are some patterns Wyckoff identified.
- Accumulation Schematic #1: This is a classic accumulation pattern with a spring, following a downtrend in most cases. It features a selling climax, an automatic rally, a secondary test, and a spring.
- Accumulation Schematic #2: This pattern is accumulation that does not include a spring. It has a climax, a rally, and a secondary test. Support holds throughout.
- Accumulation Schematic #3: An accumulation that features a lot of tests and springs falls into this category.
The equivalent Distribution Schematics (mirrored from Accumulation Schematics) also exist.
Knowing when it's time to buy or sell
Wyckoff went into a lot of detail to help traders use his framework effectively. He even came up with nine tests for buying, and nine tests for selling. This is a checklist you can go over before you enter a trade.
Tests to buy
- Is price ranging (no longer trending down)?
- Has volume gone down?
- Did price spring below support, then recover?
- Is there enough cause to support a significant move?
- Has supply been broken by a wider spread and higher volume?
- Is the instrument stronger than related ones or the market as a whole?
- Are pullbacks staying above previous levels of support?
- Once price breaks out, do you see a pattern of higher highs and higher lows?
- Is volume going up during rallies and down during reactions?
Tests to sell
- Is price ranging (no longer trending upward)?
- Has volume gone up?
- Did price upthrust above resistance, then return down?
- Is there enough cause to provide resistance?
- Has demand been broken by a wider spread and higher volume?
- Is the instrument weaker than related ones or the market as a whole?
- Are rallies failing at resistance levels, or below them?
- Are you seeing lower highs and lower lows?
- Is volume going up during declines and dropping during rallies?
How to use the Wyckoff method for Forex
It's pretty easy to translate the Wyckoff method to Forex; you just need to be aware of a few things.
- You'll find the method easiest to use with major currency pairs. Exotic pairs are less liquid, and may produce more noise and whipsaws. If you try trading commodity currencies, be mindful of how commodity prices impact those pairs.
- Forex markets trade 24 hours a day. Wyckoff analysis works best when you combine timeframes. Use daily charts to identify the larger market structure, and use intraday charts to look at individual trading sessions such as Asian, London, and New York. Pay special attention to session overlaps, since they often bring the highest volatility and liquidity.
- Watch out for news events and report releases, both of which can throw off the framework and its effectiveness in the moment.
- You can't see volume directly with Forex the way you do with the stock market, but you can at least look at the tick volume. When you are making comparisons, focus on recent averages and track relative volume changes.
Visualizing volume
To fully interpret market movements using the Wyckoff method, you need a way to visualize volume on your charts. Tick volume serves as a good proxy for real volume, but here are some examples of volume indicators you could also use:
- On-Balance Volume (OBV)
- Chaikin Money Flow (CMF)
- Market Facilitation Index
Pick one and give it a try. You can experiment with different ones while backtesting.
Applying the Wyckoff method
The Wyckoff method is best understood as a theory of the way the market tends to move. It is not in and of itself an entire strategy.
So, you will need to integrate it with technical indicators, fundamental analysis, or price action to find setups.
When your strategy produces a setup, you can go over the checklists to buy/sell that were discussed earlier. Those checklists, along with the visualizations of volume, market phases, and individual events identified by the Wyckoff method can help you establish whether the right context exists for a trade.
Wyckoff method pros and cons
To help you figure out whether you want to use the Wyckoff method, here are its pros and cons.
Advantages of the Wyckoff method
- Using the Wyckoff method helps you get better at interpreting what price is doing, which can improve your performance with a wide variety of strategies.
- The Wyckoff method gives you structure and a checklist you can follow to make sense of what you are seeing, and help ensure that an entry is justified before you enter a trade.
- Once you get used to it, the Wyckoff method is simpler than it first appears. The cycles and even the events are pretty straightforward and easy to recognize.
- You can use the Wyckoff method to trade fiat currencies, cryptocurrencies, stocks, commodities, and other assets.
Drawbacks of the Wyckoff method
- How effective the Wyckoff method is will depend a lot on the strategy you choose to pair it with. It may work better with some techniques than others. It also does not apply to what is happening in the markets all the time with all assets.
- The Wyckoff method may seem overwhelming when you are new to it. This is because there are a lot of concepts you have to learn, and it takes practice to recognize each of them playing out on the charts. So, it may not be a quick or easy method to learn.
- There is a lot of subjectivity that goes into Wyckoff analysis. You can get better and better at recognizing the patterns, and what constitutes an "ideal" pattern. But even so, you will still be using your own interpretation to make decisions. Some days, your subjective lens may be more effective than others.
- Even after you learn the Wyckoff method on its own, you will still not be ready to trade. You will have to learn a strategy that works with it, and then learn how to use the two in conjunction with each other. So, the path requires a lot of patience.
Conclusion: The Wyckoff method helps you understand market context
The Wyckoff method cannot be your entire Forex strategy, but it makes an excellent framework for understanding what the institutions are doing and how the market is moving. Practice using the framework in backtests and demo tests. The more you work with it, the faster and easier it will be for you to read and interpret what is happening on your charts.


