
Price Action Swing Trading - The PAST Strategy
- Thread starter Nigel Price
- Start date
- Watchers 92
You are using an out of date browser. It may not display this or other websites correctly.
You should upgrade or use an alternative browser.
You should upgrade or use an alternative browser.
Hi Guys, so it looks like my USD/CAD trade is moving for me, up around +350 pips this morning.
The video of the entry is here, in case you missed it.
Although things are looking promising, let's not get carried away just yet.😀
As I said in the video, it is important to remain grounded - I didn't know that move was coming yesterday, I didn't know what the Bank of Canada was going to do, oil prices, whatever.
I didn't know anything.
Don't give yourself too much credit if you are right, and don't beat yourself up too much if you are wrong.
All I did was put myself in the position where I could make a lot if I was right, and lose very little if I was wrong.
If I have been consistent about anything over the course of the nearly two years that this thread has been going, it has been about managing risk and reward to your advantage.
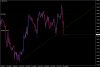
Below is the chart - we are looking at about a 1:35 risk v reward situation right now, which is great.
But there is nothing to say that the dollar bulls can't throw a spanner in the works just yet.
The key trendline is the orange trendline that I have been speaking about since last week. I will want to see the bears able to keep it under there. If the bulls manage to get price above that area, I think that would be the market sending us a fairly clear message.
Geeno - personally, I would really only be interested in adding to this trade, or initiating a new position, on a rally to the underside of that orange trendline.
So in response to your question = I would say Number 2 would be the one that would appeal to me most. 😀
I always try to look for trades with small risk and large potential reward. I'm not saying that the market can't continue on down from these levels, it would be great if it did, but for me the risk doesn't justify the reward right now.
Thanks again for your charts Geeno, they are looking great. 🙂
Any further comments or questions are welcome guys - do your worst!
The video of the entry is here, in case you missed it.
Although things are looking promising, let's not get carried away just yet.😀
As I said in the video, it is important to remain grounded - I didn't know that move was coming yesterday, I didn't know what the Bank of Canada was going to do, oil prices, whatever.
I didn't know anything.
Don't give yourself too much credit if you are right, and don't beat yourself up too much if you are wrong.
All I did was put myself in the position where I could make a lot if I was right, and lose very little if I was wrong.
If I have been consistent about anything over the course of the nearly two years that this thread has been going, it has been about managing risk and reward to your advantage.
Below is the chart - we are looking at about a 1:35 risk v reward situation right now, which is great.
But there is nothing to say that the dollar bulls can't throw a spanner in the works just yet.

The key trendline is the orange trendline that I have been speaking about since last week. I will want to see the bears able to keep it under there. If the bulls manage to get price above that area, I think that would be the market sending us a fairly clear message.
Geeno - personally, I would really only be interested in adding to this trade, or initiating a new position, on a rally to the underside of that orange trendline.
So in response to your question = I would say Number 2 would be the one that would appeal to me most. 😀
I always try to look for trades with small risk and large potential reward. I'm not saying that the market can't continue on down from these levels, it would be great if it did, but for me the risk doesn't justify the reward right now.
Thanks again for your charts Geeno, they are looking great. 🙂
Any further comments or questions are welcome guys - do your worst!
Morning Guys, Happy Friday!
Up 470 pips now as I my charts this morning:
(Youtube Video for the entire entry is here, if you missed it)
It's been a great trade so far, there is no doubt about that.
But I am facing a bit of a dilemma now. As you can see, we are now a significant distance underneath the trendline that I had earmarked as my line in the sand - if the price stays below = bears in control; price above = bulls in control.
I have spoken a lot about how retraces are not nice - I usually do not mind sitting them out, uncomfortable as they are, but if a retrace happens here, it is likely to be a whopper. If we made it to the trendline from here, it would be over half of my floating profit.
Furthermore, if we did retrace to the trendline, there is nothing to say we would have to stop at it. What if we got above the trendline?
Looking at it from the other point of view, the bears have been very strong - who says we can't just continue on down from here, and not retrace to the trendline at all? There is no rule that says that it has to be retested - it might not happen at all.
These are the things that you have to weigh up in your mind when you are running winners. You have to weigh up the pros and cons of all eventualities, pick one, and run with it.
Sometimes you will make the right decision, sometimes you will make the wrong decision. In terms of how it feels, it will usually feel like you make the wrong decision far more often than the right decision, but I think that is just your mind playing tricks on you 😀😀
Do any of you have any suggestions? How would you handle this trade if you had it open in your own account right now?
Up 470 pips now as I my charts this morning:

(Youtube Video for the entire entry is here, if you missed it)
It's been a great trade so far, there is no doubt about that.
But I am facing a bit of a dilemma now. As you can see, we are now a significant distance underneath the trendline that I had earmarked as my line in the sand - if the price stays below = bears in control; price above = bulls in control.
I have spoken a lot about how retraces are not nice - I usually do not mind sitting them out, uncomfortable as they are, but if a retrace happens here, it is likely to be a whopper. If we made it to the trendline from here, it would be over half of my floating profit.
Furthermore, if we did retrace to the trendline, there is nothing to say we would have to stop at it. What if we got above the trendline?
Looking at it from the other point of view, the bears have been very strong - who says we can't just continue on down from here, and not retrace to the trendline at all? There is no rule that says that it has to be retested - it might not happen at all.
These are the things that you have to weigh up in your mind when you are running winners. You have to weigh up the pros and cons of all eventualities, pick one, and run with it.
Sometimes you will make the right decision, sometimes you will make the wrong decision. In terms of how it feels, it will usually feel like you make the wrong decision far more often than the right decision, but I think that is just your mind playing tricks on you 😀😀
Do any of you have any suggestions? How would you handle this trade if you had it open in your own account right now?
Right guys, after some economic data this afternoon my USDCAD trade got to about 550 pips in profit, but has since retraced a bit. It's looking like it is going to put in a long wick reversal-ish candle on the daily chart.
The weekly chart still looks healthy though, a nice strong bearish move down.
So I'm going to continue to keep the trade open into next week, and see what happens. I'm not really carrying any large losses into this month so I am not under any real pressure to take any profits.
Things are getting quite sporty in the stock market today - the S&P down pretty heavily right now as I write this...not sure how that will affect the USD - usually it would mean strength, but there has been a lot of USD strength recently and stocks have still remained pretty strong.
Anyway, I'm going to call it a week here - answer a couple of emails and then get out into the sunshine 😎
Have a great weekend!
Nigel
Good evening PAST Traders!
Not much has been happening on the USD/CAD pair since my last update on Friday.
I'm happy with the current situation that appears to be playing out - namely that the pair seems to be consolidating the recent burst to the downside.
Hopefully we will get some healthy consolidation sideways before another move further down.
Here is a link to my Youtube video update for the coming week - take a look!
Here is the current chart:
If you have any more questions, don't be afraid to post them here - and I will try my best to answer them! 😀
All the best for the rest of the trading week, Nigel
Not much has been happening on the USD/CAD pair since my last update on Friday.
I'm happy with the current situation that appears to be playing out - namely that the pair seems to be consolidating the recent burst to the downside.
Hopefully we will get some healthy consolidation sideways before another move further down.
Here is a link to my Youtube video update for the coming week - take a look!
Here is the current chart:

If you have any more questions, don't be afraid to post them here - and I will try my best to answer them! 😀
All the best for the rest of the trading week, Nigel
Managed to keep an eye on your USDCAD trade whilst I was on holiday for a few days. I'm considering looking at this 1hr bearish breakout, maybe on a pullback as it looks like I may have missed the breakout while typing this 😱 -

I wanted to ask you as well about the idea of trading tops & bottoms again. When you look at last years Dollar bull-run, that would've been maybe a 6 or 7 month trend on some of the majors like EURUSD & GBPUSD, but I'm guessing that you would still have entered those markets throughout the year?

I think what I'm trying to get at is, do you only look to focus on trading tops & bottoms, or are there any adjustments you would make for entering again once a move is underway? For example, on the EURUSD chart above, where else might you have entered from August onwards?
I wanted to ask you as well about the idea of trading tops & bottoms again. When you look at last years Dollar bull-run, that would've been maybe a 6 or 7 month trend on some of the majors like EURUSD & GBPUSD, but I'm guessing that you would still have entered those markets throughout the year?
I think what I'm trying to get at is, do you only look to focus on trading tops & bottoms, or are there any adjustments you would make for entering again once a move is underway? For example, on the EURUSD chart above, where else might you have entered from August onwards?
Last edited:
Hi geeno, great charts again, thanks!
Good questions, allow me to do my best to answer them!
Try not to worry about missing breaks too much - I miss them all the time. Sometimes the temptation is to try to be at your screen for every single opportunity, and then beat yourself up if you missed a break or retest.
I have tried the whole staying up all night malarkey, it didn't work for me, and I would guess that it might not work for you either. If you miss a trade, don't worry about it, another will come along very soon. And it may well be a better one than the one you missed.
My preference is to try to catch as much of the trend as possible, so I do like to be in the market when it is showing signs of a top or a bottom, and then try to hold the trade for as long as possible.
I'm not entirely against the idea of just trading when an established trade is well under way, but it's just not something I have really found myself attracted to. That's not to say that it wouldn't work for you though!
I'm interested in fantastic risk v reward situations, and sometimes after a market has already moved, I will find myself thinking that the move must already be over - that's why I like to concentrate on reversals.
Now, as you can see from your chart there, that's not always the case, sometimes what looks like a big move is in fact only the start of a massive move. But there is no way of knowing that in real time. Sometimes it is easy to look at historical charts and pick out what you would or wouldn't have done, but hindsight trading is a completely different ball game to trading price action as it develops right in front of you in real time.
If i was being forced into trading a trend, and there were no opportunities in the markets to trade a reversal (which is rare) I would probably try to join the trend on rallies against it. So in the case of your EURUSD example, I would probably look for bearish reversal candles on perhaps the four hour chart, with a view to making a trendline entry that would survive and be caught up by the main weekly trend.
Maybe something like the below?
So, I think even in a bearish trend, you could get a pretty good risk v reward opportunity if you waited for a rally, saw a nice reversal signal, and then went from there.
(always wait for a trendline break though, even if it is only a minor one - the trendlines are important 🙂)
Hope that all makes sense!
All the best,
Nigel
Good questions, allow me to do my best to answer them!
Managed to keep an eye on your USDCAD trade whilst I was on holiday for a few days. I'm considering looking at this 1hr bearish breakout, maybe on a pullback as it looks like I may have missed the breakout while typing this 😱 -
Try not to worry about missing breaks too much - I miss them all the time. Sometimes the temptation is to try to be at your screen for every single opportunity, and then beat yourself up if you missed a break or retest.
I have tried the whole staying up all night malarkey, it didn't work for me, and I would guess that it might not work for you either. If you miss a trade, don't worry about it, another will come along very soon. And it may well be a better one than the one you missed.
I wanted to ask you as well about the idea of trading tops & bottoms again. When you look at last years Dollar bull-run, that would've been maybe a 6 or 7 month trend on some of the majors like EURUSD & GBPUSD, but I'm guessing that you would still have entered those markets throughout the year?
My preference is to try to catch as much of the trend as possible, so I do like to be in the market when it is showing signs of a top or a bottom, and then try to hold the trade for as long as possible.
I'm not entirely against the idea of just trading when an established trade is well under way, but it's just not something I have really found myself attracted to. That's not to say that it wouldn't work for you though!
I'm interested in fantastic risk v reward situations, and sometimes after a market has already moved, I will find myself thinking that the move must already be over - that's why I like to concentrate on reversals.
Now, as you can see from your chart there, that's not always the case, sometimes what looks like a big move is in fact only the start of a massive move. But there is no way of knowing that in real time. Sometimes it is easy to look at historical charts and pick out what you would or wouldn't have done, but hindsight trading is a completely different ball game to trading price action as it develops right in front of you in real time.
I think what I'm trying to get at is, do you only look to focus on trading tops & bottoms, or are there any adjustments you would make for entering again once a move is underway? For example, on the EURUSD chart above, where else might you have entered from August onwards?
If i was being forced into trading a trend, and there were no opportunities in the markets to trade a reversal (which is rare) I would probably try to join the trend on rallies against it. So in the case of your EURUSD example, I would probably look for bearish reversal candles on perhaps the four hour chart, with a view to making a trendline entry that would survive and be caught up by the main weekly trend.
Maybe something like the below?

So, I think even in a bearish trend, you could get a pretty good risk v reward opportunity if you waited for a rally, saw a nice reversal signal, and then went from there.
(always wait for a trendline break though, even if it is only a minor one - the trendlines are important 🙂)
Hope that all makes sense!
All the best,
Nigel

Thanks Nigel, it's really helpful to get a notion of the whole framework under which to work, then focus down to the trendlines which I really like to find & trade.
For me at least the trendline entries offer one of the most clear, practical & straight-forward entry types I've used, and one that offers such good Stoploss placement with open rewards. I love searching them out 🙂
One I'll be looking at for the next week or so -
EURJPY-
If price can stay below 131.00, I'll look for a break of the trendline as below:

This isn't at the market turn, but it is at a major price level I think on the weekly (38.2% fib)-
Price seems to be consolidating right now under that 131.00, but a bearish weekly candle would be nice to see (the next fib level at 50% is the best part of 700 pips away so it seems to offer decent potential reward).. Worth keeping an eye on?
Cheers
For me at least the trendline entries offer one of the most clear, practical & straight-forward entry types I've used, and one that offers such good Stoploss placement with open rewards. I love searching them out 🙂
One I'll be looking at for the next week or so -
EURJPY-
If price can stay below 131.00, I'll look for a break of the trendline as below:
This isn't at the market turn, but it is at a major price level I think on the weekly (38.2% fib)-
Price seems to be consolidating right now under that 131.00, but a bearish weekly candle would be nice to see (the next fib level at 50% is the best part of 700 pips away so it seems to offer decent potential reward).. Worth keeping an eye on?
Cheers
Attachments
Last edited:
Yes geeno, totally agree with you - trendlines are great for entries - you can't beat them!
I see you are continuing with your trend continuation strategy there, rather than the PAST Strategy. I think your analysis is on the bearish candle there is pretty good, and I suppose you could have made the argument for further weakness. Of course it hasn't panned out this time, but that's not to say it couldn't happen next time.
My only issue with the way you seem to be trading there is that as you are trying to trade with the trend rather than against it, you are depriving yourself of the energy behind the preceding trends and subsequent reversals the rest of us PAST traders look for. A strong preceding trend, when it comes to an end, often snaps back quickly, and that quick movement offers great opportunities for trades.
Your weekly candle there has no real preceding movement behind it at all, yes, the trend appears to be bearish overall, but you could just as easily could argue that it is just in a range, going nowhere.
Am I right in thinking that you are electing to trade continuations rather than reversals because you assume that trading with the trend will result in better trades, or a higher strike rate?
As you'll know if you have read my stuff - I don't have much time for trading convention - I think most of the time convention is wrong. There are loads of traders who think that if they trade in the direction of the trend they will do better - "the trend is your friend" and all that.
I have seen no evidence whatsoever that suggests people who try to adopt a trend as their friend do any better than traders who don't.
I'm not suggesting that you abandon trading with the trend - if you are seeing results doing so, by all means continue - but just be aware of following conventional wisdom too often - most of the time it is wrong.
Hope that helps! Good luck! 😀
Hey Guys,
In this week's PAST Video report, I take a look at how the USD/CAD trade is getting on. It was up 700 pips in profit at one point, but it has eased back now.
I also take a look at a question that a PAST trader, Dennis, sent me on email.
We do a Crimewatch-style reconstruction of his trades 😀
Take a watch and let me know what you think
Here is the Youtube link.
Hope your trading week is going well!
Nigel
Thanks Nigel, & yes, I maybe tried to jawbone in my own mind the EURJPY move as a ‘minor reversal’ to fit it in with the PAST strategy 😱
I find myself placing more emphasis on the trendline break, rather than the anchor background story. I'll make sure to be more inline with the snap from a higher frame reversal.
Cheers.
I find myself placing more emphasis on the trendline break, rather than the anchor background story. I'll make sure to be more inline with the snap from a higher frame reversal.
Cheers.
I maybe tried to jawbone in my own mind the EURJPY move as a ‘minor reversal’ to fit it in
Ha, I think we are all guilty of doing that, no matter what strategy we trade!
We see what we are looking for 😀
But a lot of the time there is no need for us to do so - there are opportunities occurring all the time
Here is one that I was looking at last night - unfortunately I missed it this morning, it had moved before I got up.

But it will not be long until another one comes along 😀
Hello traders, first post here - just wanted to thank Nigel for this fine thread and the excellent E-book. Still trying to catch up ...
Shorted USDCAD as a starter (trendline break on M15) - going fine.
2* SL on USDSGD, 3rd long still open.
Long EURGBP: 1 SL +1 BE. Waiting for new break...
Michael
Shorted USDCAD as a starter (trendline break on M15) - going fine.
2* SL on USDSGD, 3rd long still open.
Long EURGBP: 1 SL +1 BE. Waiting for new break...
Michael
Hi Nigel,
I have just completed your PAST training course and keen to get cracking. I wanted to ask you about this CAD trade as based on my weekly "anchor" chart there looks to be potential to go long on a break of the (pretty strong) trendline down from the high on the 1st May on the hourly chart. So first of all I was keen on your view on that as a trade and secondly I was wondering whether the long signal on the weekly anchor chart persuaded you to get out of your original trade or not?
Matthew
New possibilities.
Possible trend line retest underway on EURJPY H1 chart before heading short. EURJPY D1 seems peaked.
GBPAUD broke trend line heading south on H1. GBPAUD D1 has a bearish engulfing candle in the making.
Raju.
Possible trend line retest underway on EURJPY H1 chart before heading short. EURJPY D1 seems peaked.
GBPAUD broke trend line heading south on H1. GBPAUD D1 has a bearish engulfing candle in the making.
Raju.
Attachments

Last edited:
Another one.
I guess GBPAUD wasn't meant to be. The daily candle which looked like a bearish engulfing candle last night was far from reaching a close.
EURAUD daily candle at present, however, which is only a couple of hours short of closing for the day looks to be a likely candidate that might graduate as a bearish engulfing D1 candle. If that happens, it might be worthwhile to watch if price on H1 chart might retrace and retest an existing trend line for a better entry price to go short.
Attachments


One more good entry before the week ends.
Price on USDJPY H1 chart seems to be heading back to retest a trendline that might result in a good short entry with a backing from both D1 and W1 charts.
Price on USDJPY H1 chart seems to be heading back to retest a trendline that might result in a good short entry with a backing from both D1 and W1 charts.
Attachments


Hi Nigel,
Hope you still check this page and I can contact you.
Thanks for the recent video update you did, was wondering where you had gone 🙂
I mean this one [url deleted] where you also refer to a PAST scanner - Please can you confirm I would also get the complete version when it is available - As well as any updates?
Similar threads
- Replies
- 13
- Views
- 11K
- Replies
- 0
- Views
- 4K
- Replies
- 1
- Views
- 2K
- Replies
- 23
- Views
- 13K