My personal FX pairs and XAUUSD analysis

DominicWalsh

Trader
Feb 7, 2023
107
0
22
46
United Kingdom
Gold (#XAUUSD): Your Trading Plan For This Week


⚠️Gold is unstoppable.

The market closed, forming a high momentum bullish candle on a daily.

The price is currently approaching a solid resistance cluster.


To catch a bullish continuation, watch 1977 - 2000 area.

If the price breaks and closes above that, probabilities will be high,

that the market will go much higher.


Next goal for buyers will be 2050.
 

Attachments

  • gold.jpg
    gold.jpg
    116 KB · Views: 0

DominicWalsh

Trader
Feb 7, 2023
107
0
22
46
United Kingdom
#EURCAD: Time to Grow!
Update for my Friday's post on EURCAD.
The price has perfectly respected a horizontal key level on a daily:
after a formation of a double bottom pattern on 4H, its neckline was successfully broken.

Now, a bullish continuation is expected.
Targets: 1.469 / 1.4735
For additional confirmation use: VWAP MT4 Indicator

What is the vwap mt4 indicator?​

The VWAP MT4 indicator is a technical tool to identify a security’s volume-weighted average price (VWAP) over a given period. It helps traders identify the market’s most efficient entry and exit points by calculating the volume-weighted average price of a security over a specified period. This indicator is handy for day traders, enabling them to make informed decisions regarding buy or sell orders.

Source: https://primeforexindicators.com/vwap-mt4-indicator/
 

Attachments

  • eurcad.jpg
    eurcad.jpg
    66 KB · Views: 0

DominicWalsh

Trader
Feb 7, 2023
107
0
22
46
United Kingdom
#NZDUSD: Classic Top-Down Setup

NZDUSD is approaching a solid horizontal daily resistance.
We see a strong bearish reaction from that:
the price formed a rising wedge pattern and a head and shoulders pattern,
the support of the wedge and the neckline of h&s were successfully broken.

I believe that the pair may drop.
Goals: 0.6237 / 0.622
 

Attachments

  • nzdusd.jpg
    nzdusd.jpg
    110.3 KB · Views: 0

DominicWalsh

Trader
Feb 7, 2023
107
0
22
46
United Kingdom
Dow Jones Index (#US30): Key Levels to Watch This Week

Here is my latest structure analysis and key levels to watch this week on ⚠️Dow Jones.

Support 1: 31420 - 31830 area
Support 2: 30690 - 30900 area
Support 3: 30070 - 30360 area

Resistance 1: 32250 - 32610 area
Resistance 2: 33430 - 33660 area

The market is currently stuck between Support 1 & Support 2.
The market participants are awaiting the interest rate decision on Wednesday.
It will most likely clarify the future direction of the market with a breakout.

Consider the underlined structures for pullback/breakout trading.
 

Attachments

  • us30.jpg
    us30.jpg
    117.8 KB · Views: 0

DominicWalsh

Trader
Feb 7, 2023
107
0
22
46
United Kingdom
GBPCHF broke and closed above a major falling trend line on a daily.
The broken trend line turned into a key vertical support now.
Probabilities will be high, that a bullish movement will initiate from that.

Next goals for buyers: 1.1423 / 1.151
For Additional confirmation use: Leading Indicators

What Is a Leading Indicator?​

A leading indicator is a significant economic measure that predicts the future outcomes of market trends, financial activities, or decisions. Leading indicators foreshadow economic activity or any future event, unlike lagging indicators that describe past events or actions. Famous examples of leading indicators include unemployment rates, inflation rates, and money circulation, amongst others.

Source: https://primeforexindicators.com/leading-indicator/
 

Attachments

  • gbpchf.jpg
    gbpchf.jpg
    101.8 KB · Views: 0

DominicWalsh

Trader
Feb 7, 2023
107
0
22
46
United Kingdom
Gold (#XAUUSD): 2 Scenarios For This Week Explained

⚠️Gold closed this week, approaching a solid daily resistance.
Depending on the reaction of the price to that structure, I see 2 potential scenarios for next week.

Bullish Scenario
If the price breaks and closes above 2010 resistance on a daily,
a bullish continuation will be expected to 2060 level.

Bearish Scenario
The price may respect the underlined resistance.
1917 - 1940 is the closest strong support.
If the price drops and closes below that area,
a bearish continuation will be expected to 1891.

Wait for a breakout and then follow the market.
For Additional confirmation use ROC Indicator

What is the Price Rate Of Change (ROC) Indicator​

Price Rate of Change (ROC) is a clear technical indicator that helps measure the percentage change in Price between the Current Price and the Price of the security over a particular number of periods. ROC moves upwards into positive territory if price changes are positive and into negative territory if price changes are negative. Overbought and oversold conditions, centerline crossovers, and divergences can be spotted with ROC, which can help traders make profitable decisions.

ROC is a momentum index that measures the speed of change in security prices, indicating whether the Price is increasing or decreasing. Depending on the markets traded, you can use either Price ROC or Volume ROC, as these are different fx indicators with different formulas. Understanding ROC is crucial in identifying signals and trends that could significantly affect your trades and investments.

Source: https://primeforexindicators.com/roc-indicator/
 

Attachments

  • gold.jpg
    gold.jpg
    59.1 KB · Views: 0

DominicWalsh

Trader
Feb 7, 2023
107
0
22
46
United Kingdom
#USDJPY: Key Levels to Watch This Week

Here is my latest structure analysis for USDJPY.

Resistance 1: 132.46 - 133.25 area
Resistance 2: 135.0 - 135.8 area
Resistance 3: 137.36 - 137.9 area

Support 1: 129.64 - 130.7 area
Support 2: 128.09 - 128.7 area
Support 3: 127.2 - 127.8 area

Consider these structures for pullback/breakout trading.
 

Attachments

  • usdjpy.jpg
    usdjpy.jpg
    114.4 KB · Views: 0

DominicWalsh

Trader
Feb 7, 2023
107
0
22
46
United Kingdom
#GBPNZD: Nice Bullish Clues

Update for GBPNZD.
It looks like the price has nicely respected a broken triangle.
The price formed a bullish engulfing candle on a daily.

Bullish bias on a pair remains.
Goal remains unchanged - 1.997
 

Attachments

  • gbpnzd.jpg
    gbpnzd.jpg
    102 KB · Views: 0

DominicWalsh

Trader
Feb 7, 2023
107
0
22
46
United Kingdom
#EURUSD: Peculiar Pattern

I spotted a cup & handle pattern on ⚠️EURUSD on 1H time frame.
1.0777 - 1.0783 is its neckline.

If the price breaks and closes above that, I will expect a bullish movement.
Goals will be 1.0843 / 1.0894

If the price sets a new low, the pattern will become invalid.

What Is a Cup and Handle Pattern?​

The cup and handle pattern is a technical analysis Metatrader 4 indicator that signals a downward trend. The pattern consists of two parallel lines with different heights. The bottom line is the downtrend, and the top line is the uptrend.

The height of the top line indicates the strength of the bull market, while the bottom line’s size indicates the bear market’s power. To trade with the cup and handle pattern, look for stocks trading below their 50-day moving average and above their 200-day moving average. This will help you identify stocks likely to experience an upward reversal trend.

Source: https://forextradingstrategies4us.com/cup-and-handle-pattern/
 

DominicWalsh

Trader
Feb 7, 2023
107
0
22
46
United Kingdom
Natural Gas (#NATGASUSD): How to Buy With Confirmation

Hey traders,

I spotted a classic harmonic ABCD pattern on
26a0-fe0f.png
Natural Gas.
The completion point of the pattern matches perfectly with a horizontal key level.

Analyzing intraday time frames, I also spotted a falling wedge pattern on 12H.

To buy with a confirmation, wait for a bullish breakout of the resistance of the wedge.
Its violation may initiate a bullish movement.

The goals will be 2.43 / 2.58
 

Attachments

  • gas.jpg
    gas.jpg
    71.2 KB · Views: 0

DominicWalsh

Trader
Feb 7, 2023
107
0
22
46
United Kingdom
#EURCAD: One More Bullish Move Ahead

EURCAD is taking off from a solid horizontal structure support.
The price formed a bullish engulfing candle on a 4H time frame,
engulfing the range of the last 4 candles.

Chances will be high to see a movement up.
Goals: 1.485 / 1.4914
 

Attachments

  • eurcad.jpg
    eurcad.jpg
    87.6 KB · Views: 0

DominicWalsh

Trader
Feb 7, 2023
107
0
22
46
United Kingdom
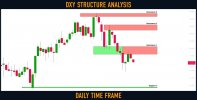
Dollar Index (#DXY): Key Levels to Watch This Week

Here is my latest structure for Dollar Index.

Resistance 1: 103.11 - 103.63 area
Resistance 2: 104.74 - 105.1 area
Resistance 3: 105.667 - 105.88 area

Support 1: 100.82 - 100.88 area

Consider these structures for pullback/breakout trading.
 

Attachments

  • dxy.jpg
    dxy.jpg
    89.4 KB · Views: 0

DominicWalsh

Trader
Feb 7, 2023
107
0
22
46
United Kingdom
#USDCAD: Important Breakout

USDCAD broke and closed below a solid horizontal demand cluster on a daily.
The broken structure turned into resistance now.

Probabilities will be high to see a bearish move from that.
Goals will be 1.356 / 1.346
For Additional confirmation use: the best mt4 indicators

Uncovering the Best MT4 Indicators for Forex Trading​

Uncovering the best MT4 indicators for Forex trading can take time and effort, especially for novice traders. However, some key indicators should be considered when trading in the Forex market. Firstly, it is important to understand technical analysis and the various tools available to traders. Once this is accomplished, traders should look at popular devices such as moving averages, Bollinger bands, and MACD.

Source: https://primeforexindicators.com/best-mt4-indicators/
 

Attachments

  • usdcad.jpg
    usdcad.jpg
    55.3 KB · Views: 0

DominicWalsh

Trader
Feb 7, 2023
107
0
22
46
United Kingdom
#EURJPY: Detailed Structure Analysis

Here are my latest structure analysis for ⚠️EURJPY.

Support 1: 138.80 - 139.25 area
Support 2: 137.38 - 138.18 area

Resistance 1: 143.19 - 143.6 area
Resistance 2: 145.00 - 145.58 area
Resistance 3: 146.40 - 146.7 area

Consider these structures for pullback/breakout trading.
 

Attachments

  • eurjpy.jpg
    eurjpy.jpg
    117.6 KB · Views: 0

DominicWalsh

Trader
Feb 7, 2023
107
0
22
46
United Kingdom
Dollar Index (#DXY): Key Levels to Watch This Week

Here is my latest structure for Dollar Index.

Resistance 1: 103.11 - 103.63 area
Resistance 2: 104.74 - 105.1 area
Resistance 3: 105.667 - 105.88 area

Support 1: 100.82 - 100.88 area

Consider these structures for pullback/breakout trading.

What is the Dollar Index DXY Indicator for MT4?​

The Dollar Index DXY Indicator is a momentum indicator that shows the daily change in the value of the U.S. dollar against a set of major currencies. It helps traders assess the strength or weakness of the U.S. dollar and make informed decisions regarding their foreign exchange positions. The indicator is calculated by taking the difference between two moving averages – one exponential and one simple – and dividing it by the value of the underlying currency. This value is then plotted on a chart to give traders an indication of how strong or weak the U.S. dollar is relative to other major currencies.
Source: https://primeforexindicators.com/dollar-index-dxy-indicator/
 

Attachments

  • dxy.jpg
    dxy.jpg
    89.3 KB · Views: 0
Last edited:

DominicWalsh

Trader
Feb 7, 2023
107
0
22
46
United Kingdom
#USDCAD: Important Breakout

USDCAD broke and closed below a solid horizontal demand cluster on a daily.
The broken structure turned into resistance now.

Probabilities will be high to see a bearish move from that.
The goals will be 1.356 / 1.346
For Additional confirmation use: the SAR Parabolic Indicator

What is Parabolic SAR?​

The SAR indicator is a technical analysis indicator that helps predict the direction of a market trend. However, it can be ineffective in trending markets. To overcome this drawback, you can use parabolic SAR (a version of sar indicator adapted for trending markets). This mt4 indicator plots dots below or above the price depending on the direction of the trend.

By default, sar indicator plots an acceleration factor of 2% and a maximum step of 20%. These parameters allow the hand to capture short-term directional moves accurately. It can be added to SharpCharts and ACP charts with ease. Besides, parabolic SAR makes it easy to spot reversal points in trending markets. Thus, it can help you trade profitably in uptrends and downtrends.
Source: https://primeforexindicators.com/sar-parabolic-indicator/
 

Attachments

  • usdcad.jpg
    usdcad.jpg
    86.3 KB · Views: 0

DominicWalsh

Trader
Feb 7, 2023
107
0
22
46
United Kingdom
#EURJPY: Detailed Structure Analysis

Here are my latest structure analysis for ⚠️EURJPY.

Support 1: 138.80 - 139.25 area
Support 2: 137.38 - 138.18 area

Resistance 1: 143.19 - 143.6 area
Resistance 2: 145.00 - 145.58 area
Resistance 3: 146.40 - 146.7 area

Consider these structures for pullback/breakout trading.
 

Attachments

  • eurjpy.jpg
    eurjpy.jpg
    117.6 KB · Views: 0

DominicWalsh

Trader
Feb 7, 2023
107
0
22
46
United Kingdom
BITCOIN (#BTCUSD): Waiting For The Next Move ₿

⚠️Bitcoin is consolidating after a sharp bullish rally.
The price is coiling within a horizontal trading range on a daily.

Depending on the reaction of the price to its boundaries, I see 2 potential scenarios.

Bullish
If the price breaks and closes above 28950 on a daily,
I will expect a bullish trend continuation.
Target will be 31000.

Bearish
If the price drops and closes below 26300 on a daily,
a bearish move will be expected.
Goal will be 24300.

Because the trend is bullish, I am on a bulls' side as well.
However, let's see what will happen.
 

Attachments

  • btc.jpg
    btc.jpg
    59.4 KB · Views: 0

DominicWalsh

Trader
Feb 7, 2023
107
0
22
46
United Kingdom
#NZDCAD: Classic Bearish Pattern

NZDCAD formed a head & shoulders pattern on a daily time frame.
Its neckline was successfully broken yesterday.

I expect a further decline on the pair.
Targets: 0.84 / 0.837
 

Attachments

  • nzdcad.jpg
    nzdcad.jpg
    92.4 KB · Views: 0

DominicWalsh

Trader
Feb 7, 2023
107
0
22
46
United Kingdom
Market Breakdown | GOLD, USDJPY, SILVER, US30

Here are the updates & outlook for multiple instruments in my watchlist.

Gold (#XAUUSD) 4h time frame
Gold is perfectly respecting a minor rising trend line .
So far, I would expect a bullish continuation from that.
Goal for buyers might be the underlined yellow resistance.

If you are looking for shorting, consider a bearish breakout of the trend line .
I can give you a perfect confirmation to sell.

#USDJPY daily time frame
The market is approaching a solid horizontal resistance.
Taking into consideration that the pair is quite overbought and trading in a bearish trend ,
I believe that probabilities will be high to see a bearish move from that.

Silver (#XAGUSD) 4h time frame
I spotted a cute bullish accumulation pattern - an ascending triangle formation.
The price has successfully violated its neckline.
It looks like the market will keep growing.

Dow Jones (#US30) daily time frame
The market is approaching a solid daily resistance.
We see its breakout attempt now.
If a daily candle closes above that, the Index may go much higher.
For Additional confirmation use: the Best Scalping Indicators

Learn How to Use the Best Scalping Indicators for Maximum Profit​

Scalping trading can be a profitable and simple way to trade. It involves dealing small amounts of capital to capture quick profits or move a trading position into profit without holding it for long. Many scalping forex traders use this strategy to profit in volatile market conditions.
In simple terms, scalping trading is about trading with small amounts of money and moving your positions frequently to capitalize on price movements. The best scalping indicators allow you to take advantage of price movements in the market without holding on to your place for too long or moving too much capital at once. Here, we discuss the best scalping indicators ideal for scalping forex trades.

Source: https://primeforexindicators.com/best-scalping-indicators/