
My personal FX pairs and XAUUSD analysis
- Thread starter DominicWalsh
- Start date
- Watchers 2
You are using an out of date browser. It may not display this or other websites correctly.
You should upgrade or use an alternative browser.
You should upgrade or use an alternative browser.
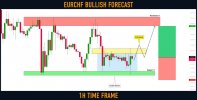
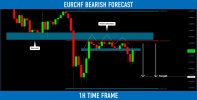
#EURCHF: Your Trading Plan For Today
⚠️EURCHF is currently consolidating.
The pair is trading within a wide intraday trading range.
Currently, the price is approaching its lower boundary.
To buy the pair with a confirmation, watch a double bottom pattern.
0.994 - 0.9943 is its neckline.
Wait for an hourly candle close above that (it will confirm a breakout),
buy aggressively or on a retest then.
Target will be 0.996
If the price sets a new lower low, the setup will be invalid.
Also use RSI Indicator for confirmation.

It’s one of the most popular technical analysis-free indicators for spotting overbought and oversold levels, trend reversal, divergence, reversal signals, strength reversal divergence, and support & resistance levels. Traders also use it extensively to help determine trading decisions such as entry points and exit signals.
Source: https://primeforexindicators.com/rsi-indicator/
⚠️EURCHF is currently consolidating.
The pair is trading within a wide intraday trading range.
Currently, the price is approaching its lower boundary.
To buy the pair with a confirmation, watch a double bottom pattern.
0.994 - 0.9943 is its neckline.
Wait for an hourly candle close above that (it will confirm a breakout),
buy aggressively or on a retest then.
Target will be 0.996
If the price sets a new lower low, the setup will be invalid.
Also use RSI Indicator for confirmation.
A Comprehensive Guide to the RSI Indicator
Relative strength index, or RSI indicator, is a momentum indicator used to measure overbought and oversold levels of a price movement. It’s unique because it measures momentum over time rather than price action.
It’s one of the most popular technical analysis-free indicators for spotting overbought and oversold levels, trend reversal, divergence, reversal signals, strength reversal divergence, and support & resistance levels. Traders also use it extensively to help determine trading decisions such as entry points and exit signals.
Source: https://primeforexindicators.com/rsi-indicator/
Attachments
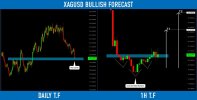
Silver (#XAGUSD): Ahead of Powell's Speech
Silver looks very oversold.
The price reached a solid horizontal key level and formed an inverted head and shoulders pattern on 1H time frame.
We might see a pullback.
Goals: 20.37 / 20.55
Traders often look for this formation as a sign that the price has bottomed out and will likely move higher. Confirmation of an actual reversal occurs when the price breaks through resistance at the neckline formed by connecting the two troughs on either side of the middle peak. This pattern can be helpful for traders seeking to buy into an asset at its lowest point before it starts to rise again.
Source: https://forextradingstrategies4us.com/head-and-shoulders-pattern/
Silver looks very oversold.
The price reached a solid horizontal key level and formed an inverted head and shoulders pattern on 1H time frame.
We might see a pullback.
Goals: 20.37 / 20.55
Inverse Head and Shoulders
The inverse head and shoulders pattern is a technical analysis charting technique that can identify potential reversals in the price of a security. This pattern is characterized by three troughs and two peaks, with the middle peak being lower than the other two. The inverse head and shoulders are the opposite of the traditional authority and shoulders pattern, which suggests an upward trend instead of a reversal.Traders often look for this formation as a sign that the price has bottomed out and will likely move higher. Confirmation of an actual reversal occurs when the price breaks through resistance at the neckline formed by connecting the two troughs on either side of the middle peak. This pattern can be helpful for traders seeking to buy into an asset at its lowest point before it starts to rise again.
Source: https://forextradingstrategies4us.com/head-and-shoulders-pattern/
Attachments
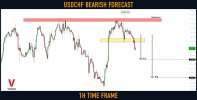
#USDCHF: Bearish Move From Key Level
USDCHF looks overbought to me,
The price formed a double top pattern approaching a key structure resistance.
Its neckline has been just broken.
Probabilities are high that we will see a correctional movement on the pair.
Goals: 0.935 / 0.931
USDCHF looks overbought to me,
The price formed a double top pattern approaching a key structure resistance.
Its neckline has been just broken.
Probabilities are high that we will see a correctional movement on the pair.
Goals: 0.935 / 0.931
Attachments
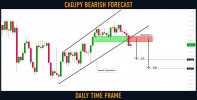
#CADJPY: Classic Trend-Following Setup
CADJPY broke and closed below a support line of a bearish flag pattern.
Taking into consideration, that the pair is trading in a bearish trend,
that violation may trigger a sell off.
I expect a bearish continuation to 97.05 / 96.1
The basic idea of the Pattern is that it provides traders with a reliable entry point and an exit point, thereby making their trades less volatile. However, you must study the chart and identify the appropriate period for using the Pattern. You can use it to make buy and sell decisions in various markets.
Source: https://forextradingstrategies4us.com/bear-flag-pattern-trading-strategy/
CADJPY broke and closed below a support line of a bearish flag pattern.
Taking into consideration, that the pair is trading in a bearish trend,
that violation may trigger a sell off.
I expect a bearish continuation to 97.05 / 96.1
How to use the Bear Flag Pattern
The Bear Flag pattern is a trading strategy that uses technical indicators to make buy and sell decisions. It is based on the Fibonacci retracement and continuation patterns, popular among technical analysts for predicting short-term price movements.The basic idea of the Pattern is that it provides traders with a reliable entry point and an exit point, thereby making their trades less volatile. However, you must study the chart and identify the appropriate period for using the Pattern. You can use it to make buy and sell decisions in various markets.
Source: https://forextradingstrategies4us.com/bear-flag-pattern-trading-strategy/
Attachments
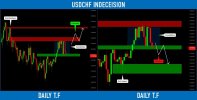
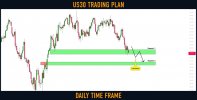
#USDCHF: Detailed Technical Outlook
⚠️USDCHF is currently consolidating.
The price is stuck between 2 horizontal key levels that compose a range.
0.9425 - 0.946 is the resistance of the range.
0.9285 - 0.9306 is the support of the range.
Depending on the reaction of the price to its boundaries,
I see 2 potential scenarios:
1️⃣If the price breaks and closes above the resistance of the range,
a bullish continuation will be expected at least to 0.9537.
2️⃣If the price breaks and closes below the support of the range,
a bearish move will be expected to 0.9193 support.
Wait for a breakout, that will clarify the future direction of the market.
Attachments
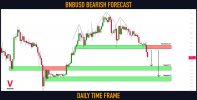
Binance Coin (#BNBUSD): Very Bearish Outlook! Here is Why:
Have you seen that huge head & shoulders pattern that was formed
on Binance Coin on a daily.
After yesterday's fundamentals, the price successfully violated its neckline and closed below that.
Probabilities are high now, and the market will keep falling.
Goals: 256 / 243
Have you seen that huge head & shoulders pattern that was formed
on Binance Coin on a daily.
After yesterday's fundamentals, the price successfully violated its neckline and closed below that.
Probabilities are high now, and the market will keep falling.
Goals: 256 / 243
Attachments
Gold (#XAUUSD): Important Bullish Clue on a Weekly
Gold has nicely respected a major weekly structure support.
The market formed a bullish engulfing candle after the test of structure,
and then we saw a very nice rejection from that.
It looks like Gold may go higher.
Next resistance 1925.
Remember, that weekly time frame chart unveils a long-term perspective.
So it may take weeks, before the price reaches the target.
This pattern consists of a long and short body connected by a wick. The wick is a thinner portion of the candle’s body that resembles a tail, and the taller part is the body. The long body is usually the same length as the body and signifies bullishness.
Before trading engulfing candlesticks, it’s essential first to understand them. The height of the candlestick indicates how much trading volume was present at a price shown by the candle. The color of the candlestick reflects the mood of buyers and sellers at the time of opening. For example, green engulfing candlesticks indicate bullishness, red engulfing candlesticks indicate bearishness, black engulfing candlesticks indicate a reversal, and white engulfing candlesticks indicate indecision among buyers and sellers. Also, bearish engulfing candlesticks close below the open price, while bullish engulfing candlesticks close above the available price.
Source: https://forextradingstrategies4us.com/bullish-engulfing-candlestick/
Gold has nicely respected a major weekly structure support.
The market formed a bullish engulfing candle after the test of structure,
and then we saw a very nice rejection from that.
It looks like Gold may go higher.
Next resistance 1925.
Remember, that weekly time frame chart unveils a long-term perspective.
So it may take weeks, before the price reaches the target.
What Is a Bullish Engulfing Candle?
A bullish engulfing candle is a candlestick chart pattern that signals an upcoming uptrend in the market.This pattern consists of a long and short body connected by a wick. The wick is a thinner portion of the candle’s body that resembles a tail, and the taller part is the body. The long body is usually the same length as the body and signifies bullishness.
Before trading engulfing candlesticks, it’s essential first to understand them. The height of the candlestick indicates how much trading volume was present at a price shown by the candle. The color of the candlestick reflects the mood of buyers and sellers at the time of opening. For example, green engulfing candlesticks indicate bullishness, red engulfing candlesticks indicate bearishness, black engulfing candlesticks indicate a reversal, and white engulfing candlesticks indicate indecision among buyers and sellers. Also, bearish engulfing candlesticks close below the open price, while bullish engulfing candlesticks close above the available price.
Source: https://forextradingstrategies4us.com/bullish-engulfing-candlestick/
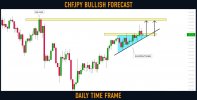
#CHFJPY: Bullish Continuation Pattern
CHFJPY is trading in a minor bullish trend on a daily.
The price was accumulating for 3 weeks within an ascending triangle formation.
Its resistance was broken on Friday, we see its retest now.
I expect a bullish continuation to 148.3
Source: https://forextradingstrategies4us.com/ascending-triangle-pattern/
CHFJPY is trading in a minor bullish trend on a daily.
The price was accumulating for 3 weeks within an ascending triangle formation.
Its resistance was broken on Friday, we see its retest now.
I expect a bullish continuation to 148.3
What Is an Ascending Triangle?
An ascending triangle is a bullish chart pattern that typically forms during an uptrend as a continuation pattern. It is characterized by two or more equal highs that create a horizontal line and two or more rising troughs that form an ascending trend line. To identify an ascending triangle, look for a horizontal line at the top of the pattern and a slanting or rising trend line moving upwards. This usually leads to a bullish breakout and can signal weakened resistance and an approaching escape to the upside. In short, ascending triangles are reversal signals that indicate an uptrend is likely to continue.Source: https://forextradingstrategies4us.com/ascending-triangle-pattern/
Attachments
#EURCHF: Trend-Following Setup
EURCHF is approaching a confluence zone based on a horizontal supply area
and 618 retracement of the last bearish impulse.
The price formed a head & shoulders pattern, testing that.
Its neckline was broken then.
I expect a bearish move to 0.9732
EURCHF is approaching a confluence zone based on a horizontal supply area
and 618 retracement of the last bearish impulse.
The price formed a head & shoulders pattern, testing that.
Its neckline was broken then.
I expect a bearish move to 0.9732
Attachments
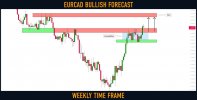
#EURCAD: Important Breakout!
EURCAD was consolidating for 3 months on a weekly.
The price was coiling within a horizontal range.
Its upper boundary was broken last week, and a weekly candle closed above that.
Probabilities will be high, that a new bullish wave will initiate soon.
Next resistance - 1.5
EURCAD was consolidating for 3 months on a weekly.
The price was coiling within a horizontal range.
Its upper boundary was broken last week, and a weekly candle closed above that.
Probabilities will be high, that a new bullish wave will initiate soon.
Next resistance - 1.5
Attachments
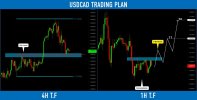
#USDCAD: Your Trading Plan For Today
⚠️USDCAD is consolidating on a key level.
We see a narrow horizontal range on 1H time frame.
To buy the pair with a confirmation, watch 1.369 - 1.37 horizontal resistance.
If the price breaks and closes above that on 1H, the probability will be high that we will see
a pullback from the underlined structure.
The goals will be 1.374 / 1.378
For confirmation, use Moving Average Indicator
If the price sets a new lower low, the setup will become invalid.
A moving average is a simple mathematical formula to calculate the asset’s average price over time. It is used widely in trading and finance.
Different types of moving averages exist, such as Simple moving averages (SMA), exponential moving averages (EMA), smoothed moving averages (SMMA), and linear weighted moving averages (LWMA). Each type has advantages and disadvantages and can be used depending on the situation.
Source: https://primeforexindicators.com/moving-average-indicator/
⚠️USDCAD is consolidating on a key level.
We see a narrow horizontal range on 1H time frame.
To buy the pair with a confirmation, watch 1.369 - 1.37 horizontal resistance.
If the price breaks and closes above that on 1H, the probability will be high that we will see
a pullback from the underlined structure.
The goals will be 1.374 / 1.378
For confirmation, use Moving Average Indicator
If the price sets a new lower low, the setup will become invalid.
Understanding a Moving Average Indicator
A moving average (MA) is a trend-following indicator used to analyze and predict the price movements of a security. It is a simple and effective technical analysis indicator employed to interpret price data and draw conclusions about the price movement of a security or asset over time.A moving average is a simple mathematical formula to calculate the asset’s average price over time. It is used widely in trading and finance.
Different types of moving averages exist, such as Simple moving averages (SMA), exponential moving averages (EMA), smoothed moving averages (SMMA), and linear weighted moving averages (LWMA). Each type has advantages and disadvantages and can be used depending on the situation.
Source: https://primeforexindicators.com/moving-average-indicator/
Attachments
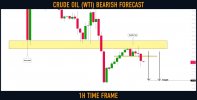
CRUDE OIL (#WTI) Bearish Setup Explained
On a today's live stream, we discussed WTI Oil.
The price formed a tiny double top pattern on 1H time frame,
approaching a wide supply cluster.
Its neckline was broken.
I expect a bearish continuation to 70.9 now.
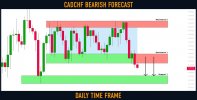
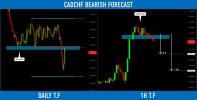
#CADCHF: Bearish Move From Key Level
CADCHF is approaching a key daily structure resistance.
The price formed a double top pattern on an hourly time frame
and broke its neckline to the downside then.
I expect the retracement from the underlined zone.
Goals: 0.673 / 0.67
On a today's live stream, we discussed WTI Oil.
The price formed a tiny double top pattern on 1H time frame,
approaching a wide supply cluster.
Its neckline was broken.
I expect a bearish continuation to 70.9 now.
Post automatically merged:
#CADCHF: Bearish Move From Key Level
CADCHF is approaching a key daily structure resistance.
The price formed a double top pattern on an hourly time frame
and broke its neckline to the downside then.
I expect the retracement from the underlined zone.
Goals: 0.673 / 0.67
Attachments
GOLD (#XAUUSD): Key Levels to Watch
Here is my updated structure analysis for Gold.
Support 1: 1875 - 1890 area
Support 2: 1855 - 1858 area
Support 3: 1805 - 1813 area
Resistance 1: 1950 - 1960 area
Resistance 2: 1978 - 1998 area
As I predicted on a live stream, the price nicely bounced from Support 1.
I believe that the market will head towards Resistance 1.
Consider the underlined structures for pullback / breakout trading.
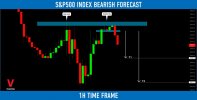
Dow Jones Index (#US30): Waiting For Breakout
⚠️Dow Jones Index is very bearish since 7th of March.
Currently, the price is stuck on a solid horizontal support, though.
For now, I am patiently waiting for its breakout.
Daily candle close below that area will confirm the violation.
A bearish wave will be expected then at least to 30900 support.
I will post an update once I spot a confirmed breakout.
Here is my updated structure analysis for Gold.
Support 1: 1875 - 1890 area
Support 2: 1855 - 1858 area
Support 3: 1805 - 1813 area
Resistance 1: 1950 - 1960 area
Resistance 2: 1978 - 1998 area
As I predicted on a live stream, the price nicely bounced from Support 1.
I believe that the market will head towards Resistance 1.
Consider the underlined structures for pullback / breakout trading.
Post automatically merged:
Dow Jones Index (#US30): Waiting For Breakout
⚠️Dow Jones Index is very bearish since 7th of March.
Currently, the price is stuck on a solid horizontal support, though.
For now, I am patiently waiting for its breakout.
Daily candle close below that area will confirm the violation.
A bearish wave will be expected then at least to 30900 support.
I will post an update once I spot a confirmed breakout.
Attachments

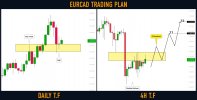
#EURCAD: Top-Down Analysis & Trading Plan
⚠️EURCAD is approaching a peculiar horizontal demand zone.
The price formed a doji candle, testing that on a daily.
Analyzing a 4H, I spotted a double bottom with a higher low.
1.458 - 1.462 is its neckline.
If the price breaks and closes above that on 4H, I will expect a bullish movement.
Goals will be 1.469 / 1.473.
❗️If the price sets a new low though, the setup will become invalid
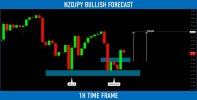
#CADJPY: Bullish Outlook Explained
CADJPY formed a cute double bottom on a key horizontal support on 4H.
Its neckline was broken during the Asian session.
I believe that the pair will most likely bounce.
Target - 98.3
⚠️EURCAD is approaching a peculiar horizontal demand zone.
The price formed a doji candle, testing that on a daily.
Analyzing a 4H, I spotted a double bottom with a higher low.
1.458 - 1.462 is its neckline.
If the price breaks and closes above that on 4H, I will expect a bullish movement.
Goals will be 1.469 / 1.473.
❗️If the price sets a new low though, the setup will become invalid
Post automatically merged:
#CADJPY: Bullish Outlook Explained
CADJPY formed a cute double bottom on a key horizontal support on 4H.
Its neckline was broken during the Asian session.
I believe that the pair will most likely bounce.
Target - 98.3
Attachments

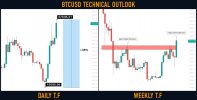
Bitcoin (#BTCUSD) has just broken a new yearly high!
Bulls are pushing Bitcoin again.
The price have updated a new high and currently approaching 27000 level.
From a technical perspective, we see a breakout attempt of a major weekly resistance cluster.
The weekly candle closes in 2 days. Closing above the underlined area, Bitcoin will open a potential
for a further bullish continuation.
Attachments
Similar threads
- Replies
- 0
- Views
- 558
- Replies
- 0
- Views
- 1K
- Replies
- 1
- Views
- 788
- Replies
- 0
- Views
- 2K