My personal FX pairs and XAUUSD analysis

DominicWalsh

Trader
Feb 7, 2023
107
0
22
46
United Kingdom
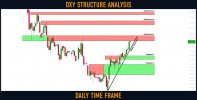
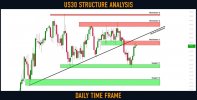
Dollar Index (#DXY): Key Levels to Watch

Here is my latest structure analysis for ⚠️Dollar Index.

Resistance 1: 105.3 - 105.8 area
Resistance 2: 106.8 - 107.2 area
Resistance 3: 107.80 - 108 area

Support 1: 103.6 - 103.95 area
Support 2: 102.25 - 103.2 area

Vertical Support 1: rising trend line

Consider these structures for pullback/breakout trading.
 

Attachments

  • dxy.jpg
    dxy.jpg
    67.8 KB · Views: 0

DominicWalsh

Trader
Feb 7, 2023
107
0
22
46
United Kingdom
#USDJPY: Bulls May Push Higher

Update for my Friday's post on USDJPY.
The price managed to close above a solid resistance cluster.
It turned into a support now.

The bullish rally will most likely continue.
Next resistance - 137.8

Wait for an occasional retest of a broken structure for safer entries.
 

Attachments

  • usdjpy.jpg
    usdjpy.jpg
    100.3 KB · Views: 0

DominicWalsh

Trader
Feb 7, 2023
107
0
22
46
United Kingdom
Gold (#XAUUSD): Time To Sell

Gold is retesting a recently broken structure.
The price has nicely respected a confluence point based on the underlined resistance and 618 retracement of the last bearish impulse.

As the extra confirmation, the price formed a double top pattern.

I expect a bearish move to 1808 / 1801
 

Attachments

  • gold.jpg
    gold.jpg
    96.3 KB · Views: 1

DominicWalsh

Trader
Feb 7, 2023
107
0
22
46
United Kingdom
#USDCAD: Key Levels to Watch This Week

Here is my latest structure analysis for ⚠️USDCAD.

Resistance 1: 1.366 - 1.3707 area
Resistance 2: 1.3745 - 1.381 area

Support 1: 1.347 - 1.352 area
Support 2: 1.3225 - 1.329 area

Vertical Support 1: major falling trend line .

Consider these structures for pullback or breakout trading.
 

Attachments

  • usdcad.jpg
    usdcad.jpg
    124.8 KB · Views: 0

DominicWalsh

Trader
Feb 7, 2023
107
0
22
46
United Kingdom
#EURCAD: Detailed Technical Outlook

Here is the wave analysis for ⚠️EURCAD.

The market is currently consolidating with a horizontal trading range on a weekly, after a strong bullish impulse.
1.46 - 1.465 is the resistance of the range,
1.423 - 1.43 is its support.

The upper boundary of the range matches perfectly with a key weekly resistance.

Depending on the reaction of the price to the boundaries of the range, I see 2 potential scenarios:
If the price breaks and closes above the resistance of the range, one more bullish wave will be expected.
While, a bearish breakout of the support of the range will most likely initiate a correctional movement.

Wait for a breakout and then follow the market.
 

Attachments

  • eurcad.jpg
    eurcad.jpg
    107.5 KB · Views: 0

DominicWalsh

Trader
Feb 7, 2023
107
0
22
46
United Kingdom
#GBPJPY: Classic Trend Following

GBPJPY remains very bullish from the beginning of the year.
After the last impulsive movement, the market retraced to a peculiar confluence zone.
I see a perfect match between 0.5 retracement of the last bullish leg and a horizontal structure support.

I will expect a pullback from that to 165.0 / 165.7
 

Attachments

  • gbpjpy.jpg
    gbpjpy.jpg
    72.7 KB · Views: 1

DominicWalsh

Trader
Feb 7, 2023
107
0
22
46
United Kingdom
#USDCHF: Detailed Structure Analysis

Here is my latest structure analysis for ⚠️USDCHF.

Support 1: 0.928 - 0.933 area
Support 2: 0.922 - 0.923 area
Support 3: 0.9137 - 0.916 area

Resistance 1: 0.942 - 0.946 area
Resistance 2: 0.954 - 0.955 area

Consider these structure for pullback/breakout trading.
 

Attachments

  • usdchf.jpg
    usdchf.jpg
    111.5 KB · Views: 1

DominicWalsh

Trader
Feb 7, 2023
107
0
22
46
United Kingdom
Dow Jones Index (#US30): Oversold Market & Pullback

Dow Jones Index reached a key level.
Testing that, the price formed an inverted head & shoulders pattern on an hourly time frame
and broke a resistance line of a falling wedge pattern then.

I expect a pullback now.
Goals: 32950 / 33110

What is a falling wedge pattern?​

A falling wedge pattern is a technical analysis charting pattern that describes a narrowing price range in which prices consistently decline. It’s often referred to as a bearish reversal pattern and is formed by two converging trend lines when the stock’s price has been falling for a certain period. Before the line converges, buyers come into the market, and as a result, the price decline begins to lose momentum.

This pattern signals an impending breakout to the upside and is considered one of bear markets’ most common charting candlestick patterns. A falling wedge pattern is usually seen in downtrends and may occur before a reversal occurs or after a trend reversal.

Source: https://forextradingstrategies4us.com/falling-wedge-pattern/
 

Attachments

  • us30.jpg
    us30.jpg
    113.8 KB · Views: 1

DominicWalsh

Trader
Feb 7, 2023
107
0
22
46
United Kingdom
Crude Oil (#WTI): Bearish Outlook Explained

Crude Oil is coiling on a key horizontal resistance.
The price formed a double top pattern, testing that
and broke its neckline then.

We may see a retracement from the underlined blue zone.
Goals: 76.9 / 76.36

What Is a Double Top?​

A double-top trading pattern comprises two peaks above a support level known as the neckline. The design is confirmed when the bearish trend breaks through the neckline and continues downwards. When forex traders spot an actual double top formation, they will seek to enter a long position at the second peak.

Traders will note how Volume usually trends downward during the formation of double tops, which indicates that the market is weakening. In short, double-top patterns are similar to double-bottom and triple-top triple-bottom patterns. These three trading indicators point to a price action reversal and indicate that sentiment has reversed sharply.

Source: https://forextradingstrategies4us.com/double-top-pattern/
 

Attachments

  • oil.jpg
    oil.jpg
    92.7 KB · Views: 0

DominicWalsh

Trader
Feb 7, 2023
107
0
22
46
United Kingdom
#EURCAD: Important Breakout

EURCAD broke and closed above a major horizontal supply cluster with a high momentum bullish candle yesterday.
1.441 - 1.446 is now turned into a demand zone.

I will expect a bullish wave from that area to 1.455 / 1.46 levels.
 

Attachments

  • eurcad.jpg
    eurcad.jpg
    59.8 KB · Views: 0

DominicWalsh

Trader
Feb 7, 2023
107
0
22
46
United Kingdom
#CADCHF: Bearish Move From Key Level

It looks like CADCHF may drop.
The price reached a solid horizontal resistance and formed a tiny double top pattern on an hourly time frame. Now we see a strong bearish pressure.

I expect a bearish continuation to 0.6913 / 0.6905
 

Attachments

  • cadchf.jpg
    cadchf.jpg
    85.4 KB · Views: 0

DominicWalsh

Trader
Feb 7, 2023
107
0
22
46
United Kingdom
#GBPCAD: Your Trading Plan For Today

⚠️GBPCAD is coiling on a key level.
I see a horizontal trading range on 1H time frame.

1.6263 - 1.6274 is its neckline.
Wait for its bullish breakout (hourly candle close above).
It will be your confirmation to buy.

Open long aggressively or on a retest then.
Goals will be 1.6307 / 1.633

If the price sets a new lower low, the setup will become invalid.
 

Attachments

  • gbpcad.jpg
    gbpcad.jpg
    105.2 KB · Views: 0

DominicWalsh

Trader
Feb 7, 2023
107
0
22
46
United Kingdom
#NZDCAD: Bullish Outlook Explained

NZDCAD is taking off from a key horizontal support.
The price formed a double bottom on that and broke its neckline then.

I expect a bullish continuation to 0.851 / 0.854

What Is a Double Bottom?​

A double bottom is a chart pattern that indicates the price of an asset, such as a stock or currency, has been in a downtrend for a while. Two consecutive troughs in price action correctly identify a double bottom pattern, with a moderate peak in between.

The pattern is a reversal pattern and signifies the price has been through a period of decline. However, it is now reversing and heading higher. A double Bottom design can be used in trading to identify a potential entry point when first bottom fishing. To trade double bottoms, traders must place an order when the price breaks the neckline or retests the neckline.

Source: https://forextradingstrategies4us.com/double-bottom-pattern/
 

Attachments

  • nzdcad.jpg
    nzdcad.jpg
    89.6 KB · Views: 0

DominicWalsh

Trader
Feb 7, 2023
107
0
22
46
United Kingdom
Gold (#XAUUSD): Key Levels to Watch This Week

Here is my latest structure analysis for ⚠️Gold.

Support 1: 1843 - 1853 area
Support 2: 1804 - 1811 area

Resistance 1: 1875 - 1904 area
Resistance 2: 1950 - 1959 area

Consider these structures for pullback/breakout trading next week.
 

Attachments

  • gold.jpg
    gold.jpg
    60.4 KB · Views: 0

DominicWalsh

Trader
Feb 7, 2023
107
0
22
46
United Kingdom
#AUDNZD: Bearish Outlook Explained

AUDNZD is testing a wide daily horizontal supply area.
The price formed a double top pattern, approaching that on an hourly time frame
and broke its neckline with a high momentum bearish candle.

I expect a retracement to 1.0848 / 1.0828
 

Attachments

  • audnzd.jpg
    audnzd.jpg
    102.5 KB · Views: 0

DominicWalsh

Trader
Feb 7, 2023
107
0
22
46
United Kingdom
S&P500 Index (#SPY): Time to Sell

S&P500 Index is testing a wide daily horizontal resistance cluster.
Probabilities will be high to see a bearish reaction from that.

I believe that the market may drop today to 4032 / 4021 levels.
 

Attachments

  • spy.jpg
    spy.jpg
    98.3 KB · Views: 0

DominicWalsh

Trader
Feb 7, 2023
107
0
22
46
United Kingdom
BITCOIN (#BTCUSD): Detailed Technical Outlook ₿

⚠️Bitcoin successfully violated a wide horizontal daily demand area.
The broken structure turned into a supply zone.

The market is correcting now.
I spotted a bearish flag pattern on 4H time frame.
Its bearish breakout may initiate the next sell off.
Watch carefully the reaction of the price to its rising support.
Consider shorting after a 4H candle close below with initial target being 22100.
 

Attachments

  • bitcoin.jpg
    bitcoin.jpg
    66.3 KB · Views: 0

DominicWalsh

Trader
Feb 7, 2023
107
0
22
46
United Kingdom
Gold (#XAUUSD): Time For Pullback

Gold is approaching a wide horizontal demand cluster on 4H.
Taking into consideration, that the market is trading in a minor bullish trend,
probabilities will be high to see a pullback from the underlined area.

I expect growth to 1855 / 1862
 

Attachments

  • gold.jpg
    gold.jpg
    92 KB · Views: 0

DominicWalsh

Trader
Feb 7, 2023
107
0
22
46
United Kingdom
Crude Oil (#WTI): Bearish Outlook Explained

WTI Crude Oil reached a key daily structure resistance.
The price formed a tiny little double top on that on 1H time frame.
Its neckline has been just broken.

The market will most likely keep retracing.
Goals: 79.9 / 79.6
[URL deleted]
 

Attachments

  • oil.jpg
    oil.jpg
    64.2 KB · Views: 0
Last edited by a moderator:

DominicWalsh

Trader
Feb 7, 2023
107
0
22
46
United Kingdom
Dow Jones Index (#US30): Key Levels to Watch This Week

Here is my latest structure analysis for US30 Index.

Support 1: 32470 - 32650 area
Support 2: 31700 - 31975 area

Resistance 1: 33475 - 33660 area
Resistance 2: 34300 - 34500 area
Resistance 3: 34820 - 34900 area

Vertical Resistance 1: major rising trend line .

Currently, the market is approaching a confluence zone based on Vertical & Horizontal Resistance 1.
Probabilities will be high to see a pullback from there.

Consider the underlined structures for pullback/breakout trading.
 

Attachments

  • us30.jpg
    us30.jpg
    115.5 KB · Views: 0