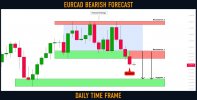
EURJPY dropped nicely from a key daily structure resistance.
I think that the pair can go even lower.
I expect a bearish move to 140.14
Post automatically merged:
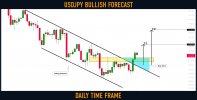
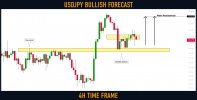
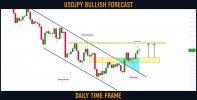
I spotted a great example of a bullish reversal on USDJPY.
The pair formed a double bottom formation on a daily time frame
and broke a resistance line of a falling parallel channel.
The underlined blue area is a buy zone based on a broken neckline and a trend line.
The pair will most likely keep growing to 134.4 / 137.63 levels.
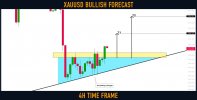
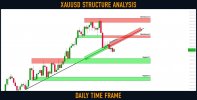
Update for my yesterday's setup on Gold.
The price has nicely respected a major rising trend line and the price successfully broke a neckline of an ascending triangle formation on 4H.
I will expect a bullish continuation now.
Targets: 1895 / 1908
[URL deleted] Forex Trading Strategies
So it turned out that Gold broke a major rising trend line yesterday.
The market has successfully closed below that on a daily, engulfing the last 3 bullish candles.
That violation may push the price lower.
Next support: 1833
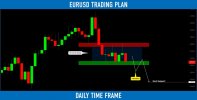
EURUSD is moving into a correction phase. The price rests against the conditional support at 1.065 and forms a bearish flag. This pattern shows us the potential to revive the fall further.
The price tests the support zone of 1.07116 in a bearish flag format. A breakdown of the support of the local range may lead to liquidating the buying liquidity and activating the momentum for a strong bearish impulse.
However, I expect in the near term an exit of the price from the range downwards, a breakdown of the support of 1.07116, and price movement towards 1.065, and then to 1.0430
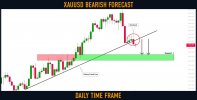
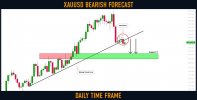
Gold (#XAUUSD): Bearish Outlook For This Week Explained
An important thing happened on Gold this week.
After a strong bearish movement, the price reached a major rising trend line.
The price was coiling on that since Monday.
On Thursday, it was broken, though.
The price closed below that, forming a bearish engulfing candle.
I believe that the market may keep falling next week.
Next support on focus is 1817 - 1833 area.
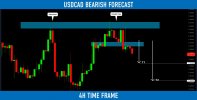
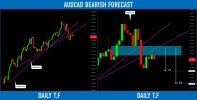
USDCAD is trading within a wide horizontal trading range on a daily.
Approaching its resistance, the price formed a [URL deleted] triple-top pattern.
Its neckline was broken on Friday.
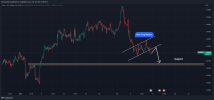
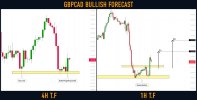
GBPCAD is taking off from a key horizontal support.
The price has formed a bullish engulfing candle on 4h, approaching that structure.
A double bottom on an hourly time frame was formed.
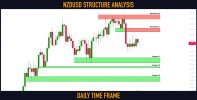
Here is my latest structure analysis for ⚠️NZDUSD.
Resistance 1: 0.6412 - 0.644 area
Resistance 2: 0.6505 - 0.6538 area
Support 1: 0.619 - 0.6226 area
Support 2: 0.6155 - 0.6165 area
Support 3: 0.606 - 0.6095 area
Consider these structures for pullback/breakout trading.
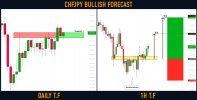
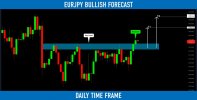
Earlier, we spotted a confirmed breakout of a falling parallel channel on a daily.
The price has nicely respected the underlined blue zone we considered the buy zone.
The price bounced from that and set a new local higher-high higher close.
I will expect a further bullish continuation.
Next resistance - 134.5
MarketBreakdown | Dollar Index, GBPUSD, USDCAD, EURNZD
Here are the updates & outlook for multiple instruments in my watchlist.
1️⃣ Dollar Index (#DXY) daily time frame
The market is consolidating within a narrow horizontal trading range.
Taking into consideration that the index is very bullish from the beginning of February,
I believe that a bullish rally will continue.
Wait for a bullish breakout of the resistance of the range,
daily candle close above that will most likely trigger a bullish continuation.
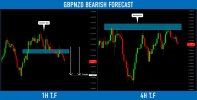
2️⃣ #GBPUSD daily time frame
The pair was rejected heavily from a key daily structure resistance.
A rejection candle with a long wick was formed.
It indicates an intense bearish pressure.
I believe that the pair will most likely keep falling.
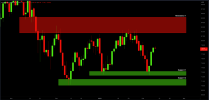
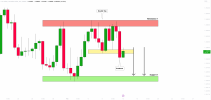
3️⃣ #USDCAD daily time frame
The market is trading within a wide horizontal trading range.
Its support was reached yesterday, and the market was rejected from that.
Probabilities are high that a resistance of the range will be reached soon.
4️⃣ #EURNZD daily time frame
The price is forming a substantial ascending triangle formation.
A bullish breakout of its resistance will initiate a solid bullish wave.
Wait for a daily candle close above the neckline as a confirmation.
After a strong bearish movement, the pair is consolidating within a narrow horizontal trading range.
1.065 - 1.068 is its support.
I am waiting for its breakout (daily candle close below) to be short.
The pair will most likely drop then.
The goal will be 1.053
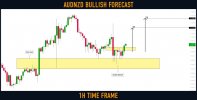
AUDNZD reached a wide horizontal demand area.
The price formed a double top on that.
Its neckline has just been broken.
I expect a pullback to 1.101 / 1.102
Post automatically merged:
[Consistent actions lead to consistent results]
I remembered my first trading system.
It was a Bollinger Band mean reversion strategy.
You buy when the price is at the lower band and sell when it’s at the upper band.
The first few trades I did were winners, then the losses came and I figured this trading strategy doesn’t work.
So, I moved on.
Next, I chanced upon harmonic patterns.
I spent half a year learning how to draw these patterns (guess I’m a slower learner).
At the start, I had some wins but slowly, the losses kicked in and eroded all my profits.
Again, I told myself…
“This trading strategy doesn’t work. Let’s try something else.”
This brought me to the world of price action trading, support and resistance, candlestick patterns, etc.
Again, the same pattern repeated itself.
I had some winners, some losers, and I gave up the strategy.
One day, I asked myself…
“Why does this always happen?”
“Why am I not getting any consistency in my trading?”
“It’s always a few winners and then the losses pile up and take everything away.”
Do you know what I realized?
The problem was me.
I was hopping from one trading strategy to the next.
My actions were inconsistent. And because my actions were inconsistent, I got inconsistent results (duh).
So, don’t make my mistakes.
If you want consistent results from trading, you must have consistent actions.
Stick to one trading strategy, master it—and then move on.
This site uses cookies to help personalise content, tailor your experience and to keep you logged in if you register.
By continuing to use this site, you are consenting to our use of cookies.