Elliott Wave Analysis by EWF

Wave IV is unfolding in its final triangle leg as NBCC approaches a key support zone. The current decline in wave ((E)) is expected to end between 89.69 and 77.24 before the long-term bullish trend resumes above 137.56.​

NBCC (India) Limited continues to maintain a constructive long-term Elliott Wave structure despite the ongoing correction from its 2024 peak. After delivering an exceptional rally from the 2022 low, the stock completed a five-wave impulsive advance into wave III at 137.56. Since then, price has entered a corrective phase that appears to be unfolding exactly as expected within a classic Elliott Wave triangle pattern. The broader trend remains firmly bullish, and the current decline should be viewed as a corrective pause rather than the beginning of a larger bearish trend. As long as the long-term invalidation level at 16.98 remains intact, we continue to favor higher prices once the correction is complete.

Wave IV Triangle Enters Its Final Stage​

The correction consists of five internal legs labeled wave ((A)), ((B)), ((C)), ((D)), and ((E)). According to the current structure, wave ((D)) has already completed, and NBCC has started the final decline in wave ((E)). This last leg should unfold in a corrective three-swing sequence while remaining above the low of wave ((C)), preserving the validity of the triangle. Based on Fibonacci projections, we expect wave IV to complete within the 89.69–77.24 support zone. This area represents a high-probability region where buyers could return and prepare the stock for the next impulsive advance.

NBCC_2026-07-14_07-08-13-scaled.png


Wave V Outlook Remains Bullish

Once wave IV completes, NBCC should begin wave V, resuming the larger bullish trend. The first objective will be a break above the previous wave III high at 137.56, which represents roughly 40% upside from current levels. A move above that level would confirm the continuation of the long-term impulsive sequence, with the potential for additional gains if wave V extends. Until the correction finishes, traders should continue monitoring the 89.69–77.24 region for signs of a completed Elliott Wave structure. A completed three-swing decline followed by a bullish reversal would strengthen the case that wave IV has ended.

Summary​

NBCC remains in a long-term bullish Elliott Wave trend despite its ongoing wave IV correction. The stock is currently developing the final wave ((E)) leg of a contracting triangle, with support expected between 89.69 and 77.24. Once the correction is complete, we expect wave V to break above 137.56, offering approximately 40% upside while keeping the broader bullish outlook intact.

Source: https://elliottwave-forecast.com/st...e-analysis-wave-iv-89-69-77-24-target-137-56/
 
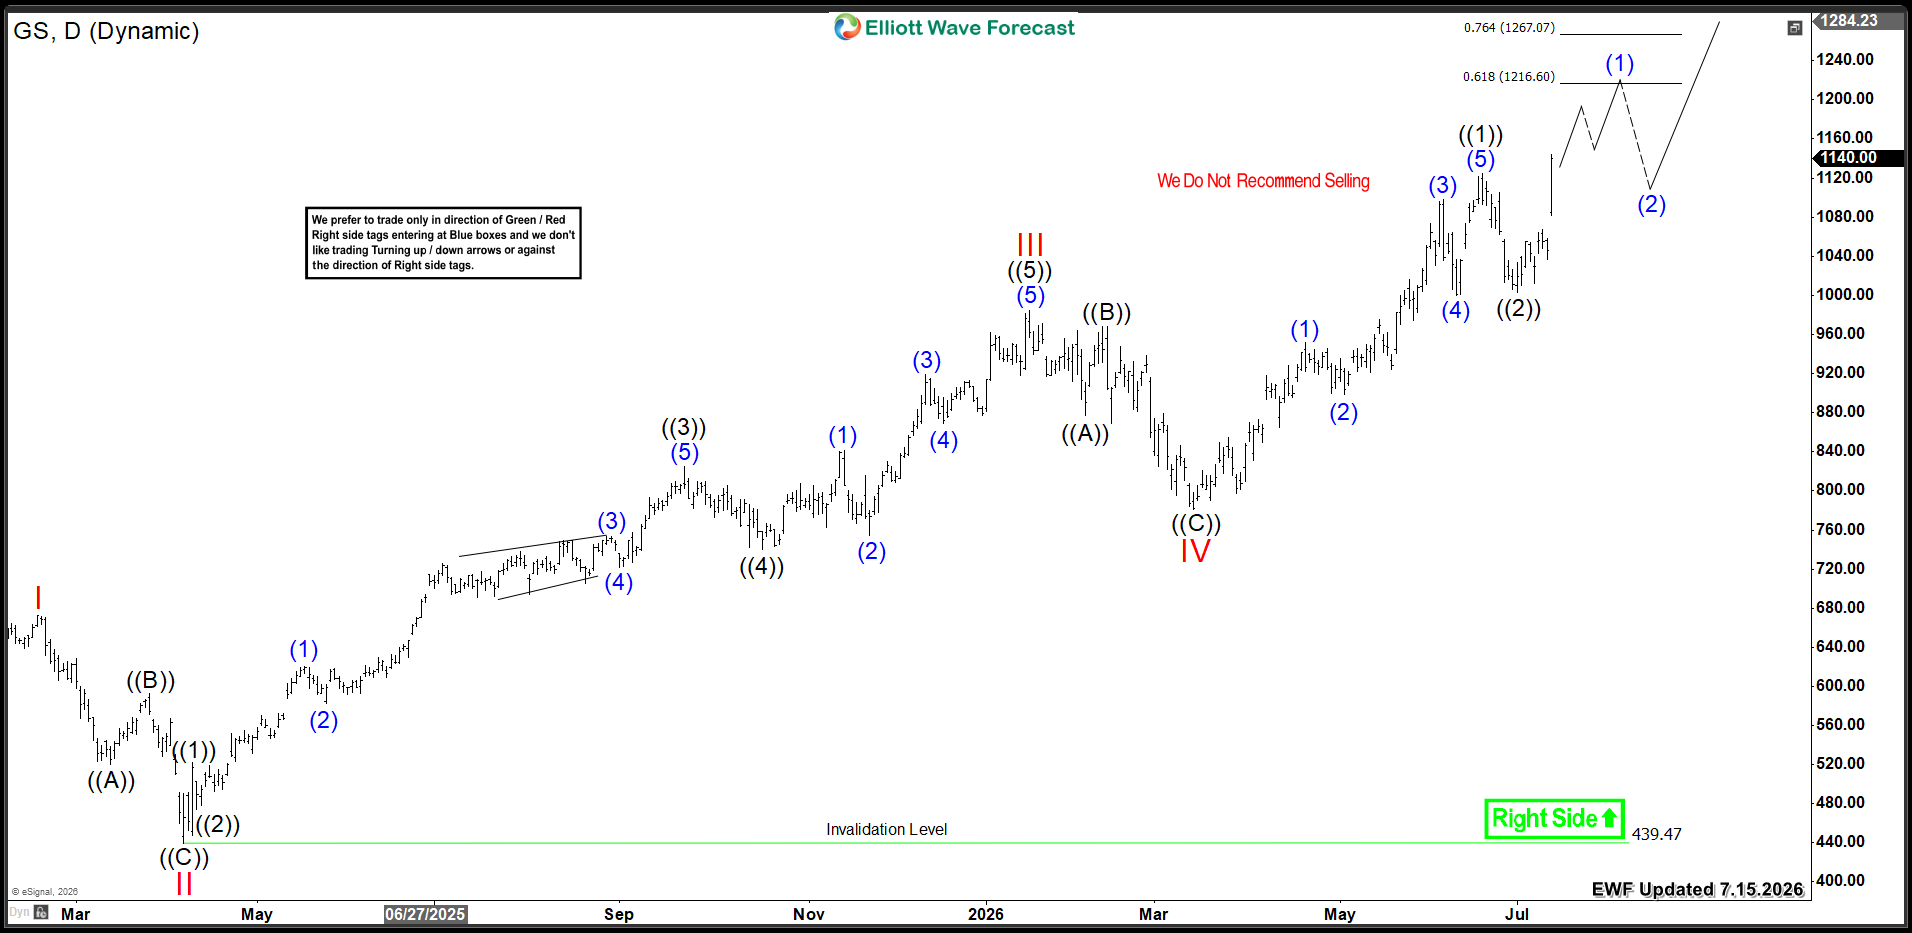
Goldman Sachs (NYSE: GS) extended its rally to new all-time highs. The stock broke above the $1000 milestone as we expected in our previous article. Today, we explore the Elliott Wave pattern dictating the current move. Our analysis explains the potential upside targets ahead.
Elliott Wave Analysis
Goldman Sachs extended its rally from the March 2026 low of $780. The stock broke above the wave III peak of $980. Then, it crossed the $1000 milestone, opening the door for further upside. GS established an initial five-wave advance in wave ((1)), ending at $1125. Subsequently, wave ((2)) pulled back to $1003. Then, the stock resumed its rally higher in wave ((3)).

Therefore, GS must hold above the recent July low of wave ((2)). This support will allow the rally to continue. The next upside move should extend the stock toward the $1216 - $1267 target zone. Then, another correction will follow before further continuation.

Ideally, the cycle from the March 2026 low aims for the $1350 - $1560 equal legs area. This would set the stage for a stronger rally by year-end.

GS Daily Chart 7.15.2026

Goldman Sachs GS Daily Chart 7.15.2026

Conclusion​

Goldman Sachs’s bullish cycle suggests further continuation beyond $1300 . Consequently, investors should target buying opportunities within daily pullbacks. Utilize our Elliott Wave strategy for precise entry timing.

Source: https://elliottwave-forecast.com/stock-market/goldman-sachs-gs-bullish-trajectory/
 
Strategic Importance Taiwan Semiconductor Manufacturing Company (TSMC), traded under the ticker TSM, holds one of the most critical positions in the global technology industry. While companies like NVIDIA, Apple, and AMD design chips, TSMC manufactures the advanced semiconductors that power their products. This makes TSMC not just a chipmaker, but a core infrastructure provider for AI, cloud computing, smartphones, high‑performance computing, automotive electronics, and more.

Business Model TSMC operates as a pure‑play foundry, focusing on producing chips designed by other companies. This model allows tech giants to concentrate on architecture and product development without building their own fabrication plants. Manufacturing leading‑edge chips is capital‑intensive and technically complex, and only a handful of companies worldwide can do it at scale. TSMC has established itself as the leader by consistently delivering advanced processes, strong yields, and reliable execution.

Competitive Advantage TSMC’s edge lies in its technological leadership. As chips shrink, transistor density rises, making manufacturing exponentially harder. TSMC has repeatedly transitioned customers to newer nodes while maintaining viable yields — a critical capability for AI and HPC processors. Its moat is reinforced by:

  • Decades of technical expertise
  • Long‑term relationships with top chip designers
  • Heavy capital investment in advanced nodes
  • Scale advantages across R&D and procurement
  • A robust ecosystem of partners
  • High switching costs for customers
AI as a Growth Driver Artificial intelligence is now one of TSMC’s most powerful growth engines. AI data centers require GPUs, custom accelerators, CPUs, networking chips, and advanced memory — nearly all dependent on TSMC’s leading‑edge manufacturing. Regardless of which chip designer dominates, TSMC benefits as the “picks and shovels” provider to the AI boom.

Advanced Packaging Beyond transistor scaling, advanced packaging has become essential for performance. By integrating multiple components into a single system, packaging improves speed, efficiency, and energy use. TSMC’s investment here adds another competitive advantage and revenue stream, positioning it at the center of next‑gen computing architecture.

Financial Strength & CapEx TSMC’s model requires massive capital expenditures to stay at the frontier. While this can pressure free cash flow, it builds capacity for future growth. Investors must watch whether spending aligns with sustainable demand. Historically, TSMC has balanced margins, pricing power, and customer relationships to fund innovation while maintaining profitability.

Geographic Diversification TSMC is expanding outside Taiwan — into the U.S., Japan, and other regions — to reduce supply‑chain risk and strengthen government ties. However, overseas fabs are more expensive, requiring careful balance between diversification and efficiency.

Risks Despite its dominance, TSMC faces:

  • Geopolitical uncertainty around Taiwan
  • Cyclical demand in semiconductors
  • Customer concentration risk
  • Rising competition from Samsung and Intel
  • Manufacturing cost pressures and yield risks
  • Export restrictions and trade tensions
Valuation & Outlook TSMC should be valued not just as a cyclical chipmaker but as a high‑quality infrastructure leader in AI and advanced computing. Still, valuation must be weighed against earnings growth, CapEx, free cash flow, and geopolitical risk.

Long‑Term Fundamental Outlook​

The long‑term outlook for TSMC remains closely tied to the relentless expansion of global computing demand. Artificial intelligence, cloud infrastructure, advanced smartphones, autonomous vehicles, robotics, industrial automation, and connected devices will all require increasingly powerful semiconductors.

TSMC is uniquely positioned to capture this growth. Its scale, engineering expertise, manufacturing reliability, and deep relationships with leading chip designers provide a durable competitive advantage. These strengths ensure that TSMC remains at the center of next‑generation computing architecture.

That said, risks cannot be ignored. Geopolitical uncertainty surrounding Taiwan, the cyclical nature of semiconductors, high capital expenditures, and intensifying competition from rivals like Samsung and Intel must remain central to any investment analysis.

Nevertheless, TSMC represents one of the clearest ways to gain exposure to the physical infrastructure behind artificial intelligence. As long as demand for computing power and advanced processors continues to rise, TSMC is likely to remain one of the most strategically important companies in the global technology ecosystem.

From a fundamental perspective, TSMC stands out as a high‑quality semiconductor leader with direct exposure to AI and high‑performance computing. The key question now is whether the technical structure supports further upside or signals a larger correction before the next major opportunity.

Elliott Wave Technical Outlook​

Bullish Base Case (Wave (III)) TSMC is currently trading within a powerful wave (III) advance. This structure suggests the stock could reach the $700 area within the next few years, depending on the broader path of global indices. Analysts expect world indices to enter one of the strongest accelerations ever seen, which could create a “nest” formation in TSM and fuel further upside momentum.

Less Bullish Scenario In a more conservative view, TSM is completing wave ((5)) of the current cycle. Once this wave ends, the stock may enter wave (IV) before resuming higher in wave (V). This path still supports upside, but with corrective pauses along the way.

TSM (Taiwan Semiconductor): $700 Within the Grand Super Cycle


More Bullish Scenario An alternative, highly bullish view sees TSM advancing toward the $550–$600 area in the near term, while forming a quadruple nest since March 27, 2026. This structure could trigger the biggest acceleration into wave (3), supported by strength in global indices, Tesla, Copper, and other markets. Though aggressive, this scenario remains realistic and highlights the potential for explosive upside.

TSM (Taiwan Semiconductor): $700 Within the Grand Super Cycle


Trading Insight
Regardless of which scenario unfolds, the bias remains bullish. The recommendation is to buy dips in 3‑7‑11 swing sequences, using corrective pullbacks as opportunities to enter the market with defined risk.

Source: https://elliottwave-forecast.com/st...miconductor-700-within-the-grand-super-cycle/
 
MCD looks set to correct the full advance that began in 2020. Moreover, price action already signals a developing Wave (II) retracement. The structure shows a clear break in momentum, confirming pressure on the larger cycle. Technically, MCD holds initial support near $245, while it stays below the 50‑day average.

Looking ahead, Wave (II) should target the key Fibonacci retracement zones of the 2020 cycle. Still, the bullish trend remains valid while the 2020 origin stays intact. As a result, traders expect a multi‑month pullback before Wave (III) resumes. A sustained drop under $245 would strengthen the Wave (II) outlook.

Elliott Wave Outlook: McDonald's MCD Weekly Chart April 2026

Elliott Wave Outlook: McDonald's MCD Weekly Chart April 2026

Back in April, we expected MCD to finish its higher high and complete the leading diagonal. Moreover, we anticipated a pullback that would confirm the start of wave ((2)). Price delivered that reaction, yet the corrective structure still looks incomplete. Therefore, we expect continued downside before wave ((2)) fully resolves. The decline could extend into the 292.59–280.99 zone, where wave ((2)) should finish.

After that, the broader bullish cycle should resume, but the process may take months. Consequently, we must stay patient and wait for price to reach the projected support zone. We avoid forcing trades and let the market define the next opportunity.

(If you want to learn more about Elliott Wave Principle, please follow these links: Elliott Wave Education and Elliott Wave Theory.)

Elliott Wave Principle Behind the Market Structure​

Impulse

An impulse is a clean 5‑wave pattern that drives the trend forward.

  • Waves 1‑3‑5 are strong and directional.
  • No overlap between waves 1 and 4.
  • Wave 3 is usually the strongest.
  • Structure is clear, with increasing momentum.

Impulse

Elliott Wave Outlook: McDonald's MCD Weekly Chart July 2026

Elliott Wave Outlook: McDonald's MCD Weekly Chart July 2026


The latest update shows the decline keeps extending, which suggests MCD may be correcting the full cycle from the 2020 low. Therefore, I removed the triple nest and labeled a leading diagonal as wave (I). Now we should expect a rebound soon, which implies the market trades in wave b, which should fail and allow wave c of (II) to continue lower.

This correction could reach the 259.00–207.56 area. If we see a rebound there, the rally may resume and confirm the broader bullish continuation.

Source: https://elliottwave-forecast.com/stock-market/mcd-signals-deeper-elliott-pullback/
 
GBP/CAD has spent the past few weeks tracing out a clean five-wave rally on the 1-hour chart, and now the pair looks to be working through the correction that typically follows a completed impulse. Here's a breakdown of the structure and what it could mean for the path ahead.

GBPCAD-1-hr-14-july-before.png


The Rally: A Textbook Five-Wave Advance

Starting from the June 22 low near 1.863, GBP/CAD pushed higher in a sequence that fits the classic five-wave impulse pattern:

  • Wave (i) kicked off the advance, followed by a shallow wave (ii) pullback that held well above the starting point.
  • Wave (iii) was the strongest leg of the move, itself breaking down into a smaller five waves (i–v) as the pair accelerated toward the 1.895–1.900 area.
  • Wave (iv) brought a brief, contained dip before buyers stepped back in.
  • Wave (v) carried price to the cycle high just above 1.905, completing the five-wave structure and marking the top of the rally.
That high represents the point where the bullish impulse likely finished, opening the door for a corrective pullback.

The Correction: An A-B-C (ZigZag) Pattern Taking Shape

What is an A-B-C (ZigZag) Pattern?

The image below illustrates an A‑B‑C Zigzag structure, similar to the one highlighted on the GBPCAD chart above.

ZIGZAG-Vlada.jpg


A Zigzag structure in Elliott Wave Theory is a sharp three‑wave corrective pattern labelled A‑B‑C, with a distinct 5‑3‑5 subdivision. It represents a counter‑trend move and is one of the most common corrective formations.

  • Wave A → 5 sub‑waves (impulsive decline or rise depending on trend).
  • Wave B → 3 sub‑waves (a smaller counter‑move).
  • Wave C → 5 sub‑waves (another impulsive move, usually equal to or longer than Wave A).
Trading Insights

  • Zigzags often signal continuation after correction, making them useful for identifying re‑entry points in the direction of the larger trend.
  • Traders watch for Blue Box zones (high‑probability reversal areas) to align entries with the end of Wave C.
  • Recognizing zigzags helps avoid mistaking them for trend reversals—they are corrective pauses, not new dominant trends.
Now that we understand what a Zigzag correction is, we can clearly connect that concept to the corrective structure shown in the GBPCAD chart above.

Since topping out, GBP/CAD has been unwinding in a standard three-wave (A-B-C) correction:

  • Wave (a) dropped sharply off the highs, retracing a large chunk of the prior advance.
  • Wave (b) brought a corrective bounce back up toward the 1.903 area — a classic "relief rally" that retraces part of wave (a) without exceeding the prior high.
  • Wave (c) is now underway, pressing the pair back down toward the 1.884–1.876 zone, with a key Fibonacci extension level sitting around 1.876.
As of the most recent update, price is trading around 1.884, right in the area where wave (c) is expected to find support and complete the pullback.

What Comes Next

Based on this count, the correction is viewed as a buying opportunity rather than a setup to sell. The expectation is for GBP/CAD to carve out a smaller, choppy dip-and-recovery pattern near current levels before turning back higher, targeting a resumption of the broader uptrend. A key support/invalidation zone sits down near 1.863 — a break below that level would call the entire bullish wave count into question.

The Final Leg Down Completed as Expected

Zooming into the internal structure of wave ((c)), price carved out a clean five-wave decline (labeled (i) through (v)) that bottomed right at the extreme of the expected support zone, just above 1.880. That low landed almost exactly on the invalidation level near 1.88016, which is precisely the kind of reaction technicians look for — a move that reaches into a well-defined support area, taps it, and reverses rather than breaking cleanly through it.

That low marks the completion of the entire corrective sequence from the 1.905 high: wave ((a)) down, wave ((b)) bounce back toward 1.903, and wave ((c)) down into the 1.880 extreme.

GBPCAD-1-hr-16-july-after.png


A Sharp, Decisive Reaction

What stands out most on this update is the strength of the reaction off that low. Rather than a slow, grinding recovery, GBP/CAD snapped back aggressively, rallying from the 1.880 extreme up through 1.890 and on toward the 1.900–1.902 area in a single strong push — essentially retracing the entire wave ((c)) decline in short order. That kind of sharp, impulsive reaction off a support extreme is typically read as a sign that the corrective phase has genuinely finished and that sellers were overwhelmed at the low.

Why the Extreme Mattered

This is a good example of why the 1.876–1.884 zone was flagged as the key area to watch in the first place. It wasn't just a round-number guess — it lined up with:

  • The Fibonacci extension target near 1.876
  • The internal five-wave count of wave ((c)) reaching a natural completion point
  • A structural invalidation level just below 1.880 that, as long as it held, kept the broader bullish wave count intact
Price respected that confluence, printed the low, and turned — which is exactly the kind of reaction that gives a wave count credibility.

Bottom Line

GBP/CAD did exactly what the prior wave count anticipated: it pushed into the extreme of the support zone, completed a five-wave decline into that area, and reacted sharply higher — a textbook reaction at the extreme that reinforces the case for a resumption of the uptrend.

Source: https://elliottwave-forecast.com/bluebox-wins/gbpcad-rally-perfect-reaction-from-the-extreme-area/
 
Eli Lilly & Company (LLY) discovers, develops & markets human pharmaceuticals worldwide. It comes under Healthcare sector & trades as “LLY” ticket at NYSE.

The LLY favors corrective pullback in ((2)) against 4.29.2026 low before continue rally in bull sequence of III. The buyers should look for next opportunity between $1073.94 - $1002.88 area to extend in ((3)).

LLY - Elliott Wave Latest Daily View:​

LLY-D001.jpg

In weekly, it favors bullish impulse sequence as trading to ATH. It placed (II) at $64.18 low in November-2016, (III) at $937.96 high in August-2024 & (IV) at $623.78 low in August-2025 low. Within (III), it placed I at $129.48 high, II at $101.36 low, III at $966.10 high, IV at $775.81 low & V at $937.96 high. The wave III of (III) was extended nested wave showing highest momentum. The (IV) pullback was double correction. It placed w at $711.40 low, x at $935.63 high & y at $623.78 low. Each degree further subdivided in 3 or 7 swings. Above $623.78 low, it placed ((1)) of I at $776.96 high, ((2)) at $712.05 low, ((3)) at $1111.99 high, ((4)) at $977.12 low & ((5)) at $1133.95 high.

LLY - Elliott Wave View From 6.10.2026:​

LLY-D000.png

It ended II in extended zigzag correction, where ((A)) at $993.58 low, ((B)) at $1114 high & ((C)) at $850.51 low. It already ended ((1)) of III at $1249.45 high against 4.29.2026 low & favors pullback in ((2)). Within ((1)), it ended (1) at $996.49 high, (2) at $943.26 low, (3) at $1182.73 high, 1079.22 low & (5) at $1249.45 high. Within ((2)) pullback, it ended (A) at $1134.40 low & appears ended (B) at $1189.07 high. Below there, it expects downside into $1073.94 - $1002.88 area to finish ((2)), which confirms below $1134.40 low. But if it breaks above $1189.07 high, it can do double in (B) in alternate view before turning lower. We like to buy the pullback in extreme area in (C) against April-2026 low for next rally above $1362 or higher.

LLY - Elliott Wave Latest Weekly View:​

LLY-W001.jpg

Further rally in ((3)) will confirm when it manages to erase the momentum divergence after breaking above July-2026 peak. Alternatively, it can do diagonal in I sequence with new high from August-2025 high before correcting lower in II, which later break below current pullback low. In either the case, buyers can look for buy in clear 3, 7 or 11 swings pullback at extreme area.

Source: https://elliottwave-forecast.com/st...st-bulls-watching-the-1074-1003-support-zone/
 
XLV (State Street Health Care Select Sector ETF) has been unfolding a bullish impulse from the April 29, 2026 low, showing a higher‑high sequence that favors more upside. Our strategy advised members to avoid selling and instead buy dips in 3, 7, or 11 swings at defined blue box areas.

Update — July 14, 2026 (1‑Hour Chart)

Textbook Precision: XLV Delivers Risk‑Free Setup

  • Rally from June 22 low ended wave 3 at $165.61 high.
  • Pullback in wave 4 unfolded as a zigzag correction:
    • ((a)) ended at $161.36 low.
    • ((b)) bounced to $162.94 high.
    • ((c)) targeted the blue box at $158.66–$156.02.
  • Buyers were expected to appear from this zone for the next leg higher or at least a 3‑wave bounce.


    Update — July 20, 2026 (1‑Hour Chart)

Textbook Precision: XLV Delivers Risk‑Free Setup


  • XLV reacted strongly higher after completing the zigzag correction in the blue box.
  • Members secured risk‑free positions shortly after entry.
  • A decisive break above $165.61 high is needed to confirm the next leg higher toward $167.63–$170.91 before profit‑taking and another pullback in 3 or 7 swings.
Source: https://elliottwave-forecast.com/bluebox-wins/textbook-precision-xlv-delivers-risk-free-setup/
 
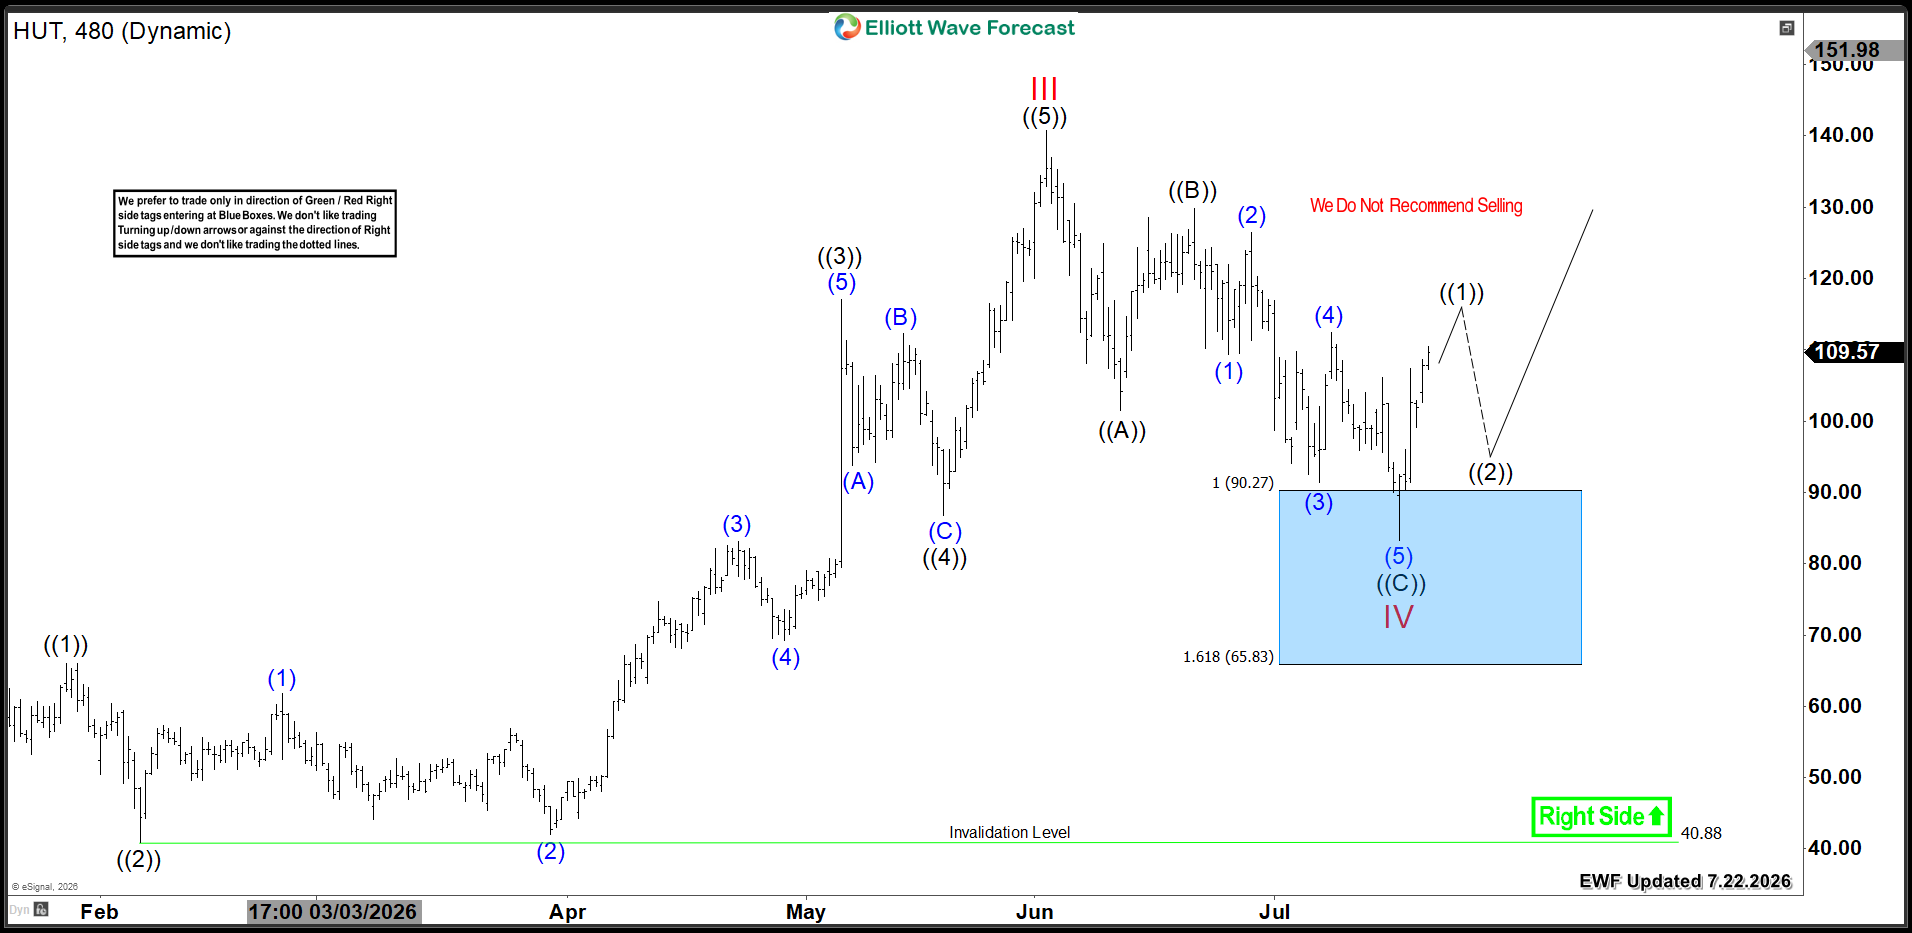
Hut 8 Corp (NASDAQ: HUT) more than doubled earlier this year. Then, it started a correction from its June peak. In today's video blog, we inspect its current Elliott Wave structure. Our analysis explains the potential upside target based on this technical setup.

Elliott Wave Analysis

HUT completed a five-wave advance in wave III at $66.07 in June 2026. Since then, it formed a three-wave zigzag structure (A-B-C). Wave ((A)) ended at $101.5. Subsequently, wave ((B)) bounced to $129.88. Then, wave ((C)) traded lower into the buying Blue Box at the equal legs area $90.27 - $65.83 .

Wave IV is marked at the recent low of $83.30. From there, the stock is reacting to the upside. It will either resume the rally to new highs or bounce in three waves at minimum. As long as HUT stays above $83.30, it should aim for the upside target $154 - $176 .

However, if the stock fails to break into new highs, it could turn lower again. A double three correction in wave IV would then unfold. This would push HUT below $90 again. That would create another buying opportunity at the next extreme area.

HUT 8 Hour Chart 7.22.2026

HUT 8H Chart 7.22.2026

The following video offers a technical outlook for​

[video width="1280" height="622" mp4="[URL]https://elliottwave-forecast.com/wp-content/uploads/2026/07/HUT-8-Corp.mp4[/URL]"][/video]

Conclusion​

HUT maintains a strong bullish trend. The stock appears ready for a new upside extension. However, bulls should remain cautious. Another dip remains a possibility.

Source: https://elliottwave-forecast.com/video-blog/hut-8-corp-hut-bullish-reversal-targets-154/
 
In technical analysis and Elliott Wave Theory, simple corrections like single A-B-C zigzags are easy to spot. However, financial markets frequently spend prolonged periods consolidating sideways, grinding price action through complex double corrections—labelled as WXY structures (or Double Threes / Double Zigzags).
While a WXY pattern can look like unpredictable noise to untrained observers, it is governed by extraordinary mathematical harmony. At the centre of that harmony sits the Fibonacci Sequence and the Golden Ratio (0.618).
Understanding how Fibonacci ratios govern both the connecting waves and terminal legs in a WXY pattern allows traders to turn chaotic sideways chop into high-probability execution setups.
Anatomy of a WXY Complex Correction
Before exploring the mathematical relationships, let’s break down the structural framework of a WXY correction:
  • Wave W: The initial corrective leg (typically a simple 3-wave zigzag or flat).
  • Wave X: The connecting counter-trend wave that links the two corrective structures together.
  • Wave Y: The final corrective leg that completes the overall consolidation before the primary trend resumes.
WXY-Structure-1.jpg

Market makers use WXY structures to digest major price moves across both time and price without prematurely pushing the market past critical higher-timeframe support or resistance levels.
Key Fibonacci Relationships in WXY Structures
Fibonacci ratios operate across two core dimensions in a WXY pattern: retracements on the connecting Wave X and extensions on the primary Wave Y.
  1. Wave X: The Golden Retracement (0.618)
WVE-X-RETRACEMENT.png

Wave X serves as a "trap" wave designed to lure market participants into believing the primary trend has resumed early.
  • Standard Retracements: Wave X typically retraces 50%, 8% (0.618), or 78.6% of Wave W.
  • The 0.618 Rejection Threshold: The 8% Fibonacci retracement is the most common rejection level for Wave X. When a counter-bounce stalls precisely near the 61.8% level of Wave W, it provides early structural confirmation that Wave X is completing, and Wave Y is about to unfold.
2. Wave Y: Proportional Geometry Relative to Wave W
Y-Truncated.png

Wave Y completes the overall pattern and exhibits specific Fibonacci expansion/compression relationships when measured relative to Wave W:
  • Equality (1.000): In standard Double Threes, Wave Y frequently equals Wave W (100% extension) which we normally call our Blue box area.
  • The 0.618 Compression: In shallower or truncated corrections, Wave Y often equals 8% of Wave W which will catch most traders off-guard.
  • The 1.618 Expansion: In aggressive, deep double zigzags, Wave Y extends to 8% (1.618) of Wave W.
The Power of Internal Sub-Wave Projections (.618 fib Extension)
To achieve maximum timing precision, professional traders zoom into lower timeframes to analyse the internal sub-waves (a-b-c or w-x-y) inside Wave Y.
Wave-Y-internals.png

When you apply the Fibonacci extension from the start of the larger wave W to its end and back to X, the internal structure of wave Y—whether unfolding as a‑b‑c or w‑x‑y—often aligns with the .618 extension of the broader W‑X pull. If the sub‑wave a or w of Y terminates precisely at that .618 level, it provides strong indication that price will advance toward the Blue Box area or reach the full 100% extension of the larger WXY sequence, typically following a minor correction within the a or x internals of Y.
Because complex corrections exhaust market momentum over time, the internal sub-waves of Wave Y often show internal exhaustion:
  • Internal b-wave: Frequently retraces 61.8% of internal sub-wave a.
  • Internal c-wave: Often completes at a 618 - 100 Fibonacci extension of internal sub-wave a (measured from the end of internal sub-wave b).
Fibonacci Measurement Blueprint for WXY Setups
To accurately project the termination of a WXY structure, layer these specific measurements across your charts:
Measurement LayerFibonacci ToolAnchor PointsPrimary Target Ratios
Connecting Wave XFib RetracementStart of W to End of W50%, 61.8%, 78.6%
Macro Wave Y TargetTrend-Based Fib ExtensionStart of W to End of W to End of X61.8%, 100%, 161.8%
Micro Sub-Wave Y TargetTrend-Based Fib ExtensionStart of Sub-wave a to End of a to End of b61.8%, 100%
The Ultimate Edge: Dual Fibonacci Confluence
The highest-probability trades occur when higher-timeframe macro projections overlap directly with lower-timeframe internal projections.
The Golden Confluence Zone:
A high-conviction entry zone occurs when a Macro Wave W-X 100% extension target aligns within a tight price band alongside a Micro internal sub-wave 100 - 1.618 extension area inside Wave Y.
When two independent Fibonacci measurements converge on the exact same price handle, it signals that both macro-timeframe market structure and micro-timeframe momentum exhaustion have reached a critical inflection point simultaneously.
Key Takeaways
  • WXY structures are double corrective patterns that connect two standard corrections via a link wave (X).
  • Wave X frequently pivots at the 8% Fibonacci retracement of Wave W.
  • Macro Wave Y targets primary Fibonacci extensions at 8%, 100%, or 161.8% of Wave W.
  • Combining higher-timeframe W-X projections with internal 100 - 1.618 sub-wave extensions inside Wave Y provides clean, low-risk reversal zones right when the primary trend is ready to resume.
Core Trading Rules
  • Avoid Trading Inside Wave X: Wave X is packed with false breakouts and choppy price action. Patience means waiting for Wave X to complete before taking a position for Wave Y or the main trend resumption.
  • Treat Fibonacci Levels as Zones: Ratios represent areas of interest rather than exact tick-perfect lines. Always pair Fibonacci confluence with price action, market structure breaks, or key support/resistance levels.
  • Maintain Strict Risk Controls: Place your stop-loss just beyond the confluence zone or the origin of Wave W. If price breaks forcefully beyond a 161.8% extension, the count is invalidated, and you should exit immediately.
Final Thoughts
Complex WXY corrections are designed to wear out retail traders and sweep stops. Once you learn to map the structure and apply the 0.618 ratio across Wave X, macro projections, and internal sub-waves, you can cut through the market noise and enter high-probability setups with tight, well-defined risk.
Source: https://elliottwave-forecast.com/elliottwave/the-fibonacci-geometry-behind-the-wxy-structure/
 
In our previous Elliott Wave update on First Trust Natural Gas ETF ($FCG), we highlighted the blue box area at 26.20–22.77 as the next important support zone where the ongoing correction from the April 2025 cycle could end. Since then, price has reached that area, and as expected, buyers have entered and triggered a reaction higher.

This price action confirms that the blue box once again worked as a high-frequency reaction zone. As a result, the correction appears to have found support in the expected area, and the ETF is now starting to recover from that low.

Blue Box Area Was Reached as Expected​

$FCG

In the prior outlook, $FCG was viewed as pulling back in a 7-swing correction against the larger bullish sequence from the 2020 low. The key support came in at 26.20–22.77, and that was the area we identified as the preferred buying zone.

Now, that support area has been tested. More importantly, buyers responded once price entered the blue box, and the ETF has already started to move higher. Therefore, the market has respected the blue box setup exactly as anticipated.

Buyers Entered and Reaction Higher Is Underway​

The reaction from the blue box confirms that selling pressure started to fade in the support zone and that buyers stepped back in. This is exactly the type of behavior we look for when a corrective structure reaches an extreme area.

Because the reaction is already in place, longs from the blue box area can now begin managing risk more aggressively. In other words, buyers can start looking to get risk free while allowing the upside reaction to continue unfolding.

What Comes Next for $FCG​

According to the updated chart, the next path favors a 5-wave move higher from the blue box low. In other words, the current bounce is expected to develop into an impulsive advance rather than just a small random rebound.

After that initial 5-wave rally, $FCG is expected to see a pullback, which should remain corrective. Then, once that pullback finishes, the ETF can resume higher again and continue the larger recovery.

So the preferred sequence from here is:

  1. 5 waves up from the blue box low
  2. A corrective pullback
  3. Another leg higher
This structure would fit well with the idea that the correction has already ended and that $FCG is now trying to resume the broader bullish path.

Bigger Picture Remains Constructive​

The broader outlook still supports the view that $FCG has been building from the larger bullish sequence that started from the 2020 lows. Although the ETF corrected the cycle from April 2025, the decline remained corrective and eventually found support in the blue box.

Now that buyers have reacted from that area, the focus shifts from downside risk to how the next advancing sequence develops.

Technical Summary​

To summarize, $FCG reached the blue box area at 26.20–22.77, where buyers entered as expected and triggered a reaction higher. This confirms that the correction likely found support in the projected buying zone.

From here, the preferred path calls for a 5-wave move up, followed by a pullback, and then more upside as shown in the chart.

Source: https://elliottwave-forecast.com/st...d-buyers-entered-and-reaction-higher-started/
 
Carvana Co. (NYSE: CVNA) continues to show a constructive long-term Elliott Wave structure following the major decline that ended near the 2023 low. From that bottom, the stock developed a strong impulsive advance with multiple internal five-wave structures, supporting the broader bullish outlook. Based on the current chart structure, Carvana appears to have completed a larger wave I near the early 2026 high around $98.95. The stock has since entered a corrective phase labeled wave II. The correction appears to be unfolding as a complex W-X-Y structure. Wave W developed as the initial decline from the wave I peak. Price then formed an X-wave recovery before turning lower again. The current structure suggests that the final wave Y decline may still need to develop before the larger correction reaches completion.

Our preferred Elliott Wave scenario expects wave II to target the $41.01 area. This level represents the 100% Fibonacci relationship and could provide an important support zone for the correction to end. The chart also shows a deeper Fibonacci projection near $14.45, representing the 1.618 extension. However, our preferred scenario remains a termination near $41.01, provided the current structure continues to develop as expected.

CVNA_2026-07-28_06-18-36-scaled.png

Wave II Could Set Up the Next Major Rally​

Once wave II completes, we expect Carvana to turn higher and begin the next impulsive advance. The projected structure suggests an initial recovery from the $41.01 area, followed by stronger upside that could eventually take CVNA toward new all-time highs. Therefore, we do not recommend selling into the current weakness. Instead, investors should monitor the development of the W-X-Y correction and watch the $41.01 region for signs of a completed wave II.

A confirmed bullish reversal from this area could provide a high-probability opportunity to participate in the next major upside phase. As long as the larger Elliott Wave structure remains valid, the long-term outlook for Carvana stays bullish, with the potential for significant upside after wave II concludes.

Source: https://elliottwave-forecast.com/st...-elliott-wave-analysis-wave-ii-targets-41-01/
 
SHOP may face mixed momentum next quarter as revenue trends stabilize and margins tighten. Investors will watch subscription growth and enterprise adoption because these segments drive recurring cash flow. Management guidance will matter, especially if it signals stronger demand or slower consumer spending. Traders should expect higher volatility as markets react to earnings revisions and macro data.

It holds a complex structure after weeks of tight consolidation. Price respects dynamic support and reacts near institutional zones. Bulls need a decisive close above resistance to confirm momentum. A break below support could trigger fast corrective waves. Volatility remains muted, yet it can expand with fresh catalysts.

Elliott Wave Outlook: SHOP Daily Chart April 2026

Elliott Wave Outlook: SHOP Daily Chart April 2026


Back in April chart, SHOP delivered a final rally toward 182.69 and completed wave (I). Then price action printed three waves down as wave w and tried a bullish bounce. However, the rebound showed weak traction, so we expected a double correction as wave (II). To confirm that view, price needed to break the February low and stay below it. That move would validate the double correction toward 60.44–42.20. Still, we watched the 104.92 level because a break with lagging price could create a truncated correction. In that case, SHOP could resume the rally from the 90.00–70.00 zone. Therefore, price behavior after losing 104.92 became extremely important for the next cycle.

Elliott Wave Principle Behind the Market Structure​

Impulse

An impulse is a clean 5‑wave pattern that drives the trend forward.

  • Waves 1‑3‑5 are strong and directional.
  • No overlap between waves 1 and 4.
  • Wave 3 is usually the strongest.
  • Structure is clear, with increasing momentum.
Elliott Wave Principle Behind the Market Structure


Elliott Wave Outlook: SHOP Daily Chart July 2026

Elliott Wave Outlook: SHOP Daily Chart July 2026


In this new update, we finally reach the moment of truth. The break of 104.92 was not what we expected, and the market bounced sharply. Now we track two clear scenarios, but both bearish. The first scenario requires price to stay below 137.30 and continue lower toward 60.44–42.20 to complete the double correction of wave (II). This path keeps the broader bearish structure intact and maintains pressure on the long‑term cycle.

However, if the market breaks above 137.30, the decline from wave (I) becomes a leading diagonal. That structure allows five waves lower forming wave “a.” The current rebound becomes wave “b,” which may reach 148.00–157.00. From that zone, we should expect strong bearish reaction to continue the correction of wave (II). Price behavior near those levels will define the next major cycle.

Source: https://elliottwave-forecast.com/stock-market/critical-breakout-zone-shop-defend-reject/
 
MP Materials Corp., (MP) produces rare earth materials in the Western Hemisphere together with its subsidiaries. It operates in two segments: Materials & Magnetics. It comes under Basic Materials sector & trades as “MP” ticker at NYSE.

Since inception in weekly, MP shows three swing higher high from June-2020 low. It shows impulse up from August-2024 low & correcting it in zigzag structure towards $26.96 or lower in daily. We like to buy the pullback below $26.96 or lower against 8.05.2024 low.

Above $10.02 low of ((II)), it ended (I) of ((III)) at $100.25 high in October-2025. Within (I), it ended I at $29.72 high, II at $18.64 low, III at $82.50 high, IV as triangle at $69.61 low & V at $100.25 high. Within (I), III was extended wave. It ended ((1)) of III at $39.10 high, ((2)) at $29.58 low, ((3)) at $65.05 high, ((4)) at $56.70 low & ((5)) at $82.50 high. Below (I) peak, it started correcting in zigzag correction. Below (I) peak, it ended a of (II) at $50.50 low (11.07.2025), b at $76.80 high (5.08.2026) & favors downside in c leg. Within b wave, it ended ((A)) at $72.93 high, ((B)) at $44.43 low & ((C)) at $76.80 high as expanded flat correction.

MP - Elliott Wave Latest Daily View:​

MP-D1.jpg

It placed ((1)) of c at $53.57 low, ((2)) at $73.52 high & favors downside in ((3)). Within ((3)), it ended (1) at $52.42 low, (2) at $63.14 high & favors downside in (3) towards $42.16 – $29.14 area before it may bounce in (4). It expects few more swings lows within c wave to extend below $26.96 level to finish (II). We like to buy the pullback below $26.96 level against August-2024 low before next rally in (III) or at least 3 swings bounce. In weekly, it is showing only three swings from inception, which can be nest as proposed view, which confirms if new high erase momentum divergence. But if high comes with momentum divergence, then it can be diagonal before correcting big.

Source: https://elliottwave-forecast.com/stock-market/mp-elliott-wave-signals-buying-near-26-96/
 
XLI (State Street Industrial Select Sector SPDR ETF) has been unfolding a bullish impulse from the March 30, 2026 low, maintaining a higher‑high sequence that favors continued upside. Our strategy guided members to avoid selling and instead focus on buying dips in 3, 7, or 11 swings at defined blue box areas.

Update — July 15, 2026 (1‑Hour Chart)

XLI Blue Box Delivers Buying Opportunity, Targets New Highs


  • Rally from March 30, low ended wave 3 at $188.61 high.
  • Pullback in wave 4 unfolded as a zigzag correction:
    • ((a)) ended at $180.80 low.
    • ((b)) bounced to $186.45 high.
    • ((c)) targeted the blue box at $178.64–$173.81.
  • Buyers were expected to appear from this zone for the next leg higher or at least a 3‑wave bounce.


    Update — July 28, 2026 (1‑Hour Chart)

    XLI Blue Box Delivers Buying Opportunity, Targets New Highs


AMD continues to maintain a strong long-term bullish outlook despite the ongoing correction. The stock remains within the third cycle of a larger third supercycle that began from the October 2022 low, suggesting the current decline is corrective and should present another buying opportunity before the next leg higher.

Weekly Elliott Wave Analysis​

On the weekly chart, wave (II) completed in October 2022, marking the start of wave (III). Wave I of (III) peaked in March 2024 after breaking above the wave (I) high, confirming a strong bullish trend. The subsequent wave II correction unfolded as a simple zigzag and found support in our Blue Box buying area in April 2025.

Elliott Wave Forecast members took advantage of this high-probability setup by buying from the Blue Box. From that April 2025 low, AMD rallied more than 600%, reaching a high above $580 in June 2026.

In strong trending markets, our preferred strategy is simple: wait for corrective pullbacks into the Blue Box and buy the dip. This approach has produced multiple successful trades across the weekly, daily, H4, and H1 timeframes.

Another standout opportunity developed during the March 2026 correction. After completing wave ((1)) of III with a powerful impulsive advance, AMD entered a wave ((2)) pullback that formed a double zigzag. The correction ended precisely within the Blue Box support area, providing another high-probability buying opportunity. From that level, the stock advanced another 200%, delivering substantial gains for members.

Current Focus: Wave ((4)) Pullback​

The 200% rally from the March 2026 Blue Box completed wave ((3)) of III. Since the June 2026 peak, AMD has been correcting in wave ((4)). While the correction may already be complete, there is still a possibility it extends lower before the next impulsive advance begins.

Scenario 1: Wave ((4)) Is Complete​

AMD


The H4 chart suggests wave ((4)) may have ended at the July 17, 2026 low. If this count is correct, AMD has already begun wave ((5)), with waves (1) and (2) potentially in place.

For this bullish scenario to remain valid, price must hold above the July 17 low and break above the wave (1) high. If that occurs, traders can look for new buying opportunities from H1 Blue Box pullbacks as wave ((5)) unfolds. The next upside objective remains in the 634–665 target area.

Scenario 2: Wave ((4)) Extends Lower​

file20260728082401-1024x500.jpg


A break below the July 17 low would invalidate the first scenario and suggest wave ((4)) is still developing. In that case, the correction could evolve into a larger 15-swing structure, with the next high-probability buying zone located between 437 and 361—our Blue Box support area.

Regardless of which scenario unfolds, the larger trend remains bullish. Rather than chasing price, we continue to focus on buying at high-probability Blue Box areas where the risk-to-reward profile is most favorable.

Source: https://elliottwave-forecast.com/st...t-is-the-next-buying-opportunity-approaching/
 
Reddit (RDDT) has spent the past year proving something the market wasn't fully pricing in a year ago: this isn't just a meme-adjacent trading vehicle, it's a company with real margins and real growth. Shares have gone from a post-IPO curiosity to a stock that gets mentioned in the same breath as Meta, Google, and Snap when advertising analysts talk about where ad dollars are heading in 2026. That context matters, because it's the backdrop against which the current pullback in RDDT needs to be read.

On the fundamentals side, the numbers back up the price action. Reddit's most recent quarter showed revenue of $663.4 million and net income of $204 million, with gross margins near 91% and EBIT margins around 27% — genuinely strong figures for a company still early in its life as a public business. Wells Fargo bumped its price target up to $187 from $176 in early July, and the stock has been drawing attention for reasons beyond trading chatter, including a broader push into AI-driven spam detection and even a former Reddit executive being poached by Nvidia for a senior communications role. With earnings due out July 30, there's a real catalyst sitting right in front of the current chart pattern, and that's worth keeping in mind regardless of which way the wave count resolves.

Now to the technical picture, because this is where the near-term roadmap gets interesting.

RDDT Weekly Structure

Reddit Weekly Elliott Wave Analysis


Stepping back to the weekly chart, RDDT rally off its all-time low unfolds as a five-wave impulse in wave (I), which topped at $282.95 in September of last year. Breaking that impulse down internally, wave I ended at $74.90, wave II corrected to $37.35, wave III extended to $230.41, wave IV pulled back to $79.75, and wave V completed the sequence at $282.95.

From there, the stock entered a zigzag Elliott wave correction that bottomed at $119.27 — a level that lines up neatly with the 50% to 61.8% Fibonacci retracement zone of the entire rally off the zero line. That's a textbook spot for a corrective low to form, and it's held so far.

Zigzag Elliott Wave Structure


Since printing that low, RDDT has been rallying again, and that rally appears to have completed its first leg at $208.05. The expectation now is a pullback that corrects the advance off the $119.27 low before the broader uptrend resumes. As long as $119.27 holds, the bullish structure stays intact. If it doesn't, the alternate and less preferred scenario opens the door to another leg down toward the $43.54 area to complete a larger seven-swing corrective sequence before the next rally attempt.

RDDT Four-Hour Picture

RDDT 4 Hour Elliott Wave Analysis


Zooming into the four-hour chart adds detail to that first leg off the $119.27 low. The rally there unfolds as an impulsive move in wave ((1)), which topped at $208.05 on July 10. Internally, wave (1) ended at $187.34, wave (2) pulled back to $152.65, wave (3) extended to $207.54, wave (4) dipped to $189, and wave (5) completed the move at $208.05.

Since that peak, Reddit has been correcting, and that corrective cycle appears to have bottomed, for now, at $165.55. The preferred read is that as long as bounces continue to fail below the $208.05 high, the stock is working on a double correction lower — three swings down, a partial recovery, then three more swings down — to complete wave ((2)) before the bigger rally resumes.

What Would Change the Picture

There's a clean alternate scenario worth watching. If price breaks back above the $208.05 peak, that would suggest wave ((2)) already finished at $165.55, and that wave ((3)) is already underway. In that case, the next area of interest for the rally becomes $254.69 to $309.83.

Either way, the message for now is the same: Reddit's larger trend remains higher, and the current softness looks like a pause within that trend rather than a reversal of it. The $119.27 level on the weekly chart is the line in the sand. Above it, the path of least resistance stays up. Below it, the timeline for the next leg higher gets pushed out, but the broader bullish structure isn't broken until that level gives way.

Source: https://elliottwave-forecast.com/stock-market/reddit-about-surprise-everyone-elliott-wave/
 
Hello fellow traders. In this technical block we’re going to take a quick look at the Elliott Wave charts of NIFTY Index published in members area of the website.

Recently, NIFTY completed a 3-wave corrective pullback following a 5-wave impulsive rally, creating a classic Elliott Wave bullish sequence. The index unfolded a clear 3-wave move lower from the peak and reached the Equal Legs zone, a key area where buyers were expected to step in. In the following analysis, we will examine the Elliott Wave structure in detail and discuss the potential market outlook from this support zone.


NIFTY Elliott Wave 1 Hour Chart 07.23.2026​

NIFTY is currently forming an intraday 3-wave pullback from the recent highs. Correction looks incomplete at the moment. The price structure is looking for another wave down. As our members know, the buying zone is derived by measuring the Equal Legs area using the Fibonacci extension tool. The ideal support zone comes in at 23641.9-23192.3. From this area, we expect buyers to step in and regain control, potentially driving price higher toward new highs.

You can learn more about Elliott Wave Patterns at our​

90% of traders fail because they don’t understand market patterns. Are you in the top 10%? Test yourself with this advanced Elliott Wave Test


NIFTY Elliott Wave 1 Hour Chart 07.29.2026​

NIFTY index has found buyers at the Equal Legs zone, exactly as expected. We saw a strong reaction from the buying area, followed by a sharp rally.

As a result, any long positions taken from the Equal Legs zone are now risk-free. We expect the index to continue trading higher and challenge the previous peak from July 7th. A break above that level would confirm further strength and increase the probability of a continuation higher.

In that scenario, we will look for the next buying opportunities, targeting new setups within a potential 3-7-11 swing structure.

Important note: Our analysis is not based on Elliott Wave in isolation. We perform detailed higher-time-frame cycle analysis, which shows an incomplete market structure. This is one of the key drivers of price action, along with correlation analysis and broader market context.

We also teach our members in live analysis sessions how to identify incomplete bullish and bearish sequences. Even a 14-day trial, is enough to noticeably improve your trading analysis and forecasting approach.


Source: https://elliottwave-forecast.com/in...alling-for-a-rally-after-corrective-pullback/