Elliott Wave Analysis by EWF

Hello fellow traders, As our members know we have had many profitable trading setups recently. In this technical article, we are going to present another Elliott Wave trading setup we got in USDJPY . The Forex Pair completed its correction precisely at the Equal Legs zone, referred to as the Blue Box Area. In the following sections, we will delve into the specifics of the Elliott Wave pattern observed and discuss the trading setup in detail.

USDJPY Elliott Wave 4 Hour Chart 05.08.2025

The pair is forming a correction against the 151.22 peak. The price action shows an incomplete higher high sequences in the rally from the low, suggesting potentially more short term strength. This correction is likely unfolding as an Elliott Wave Double Three pattern. We anticipate an extension toward the extreme zone at 148.39 area, where we are looking to re-enter as sellers.

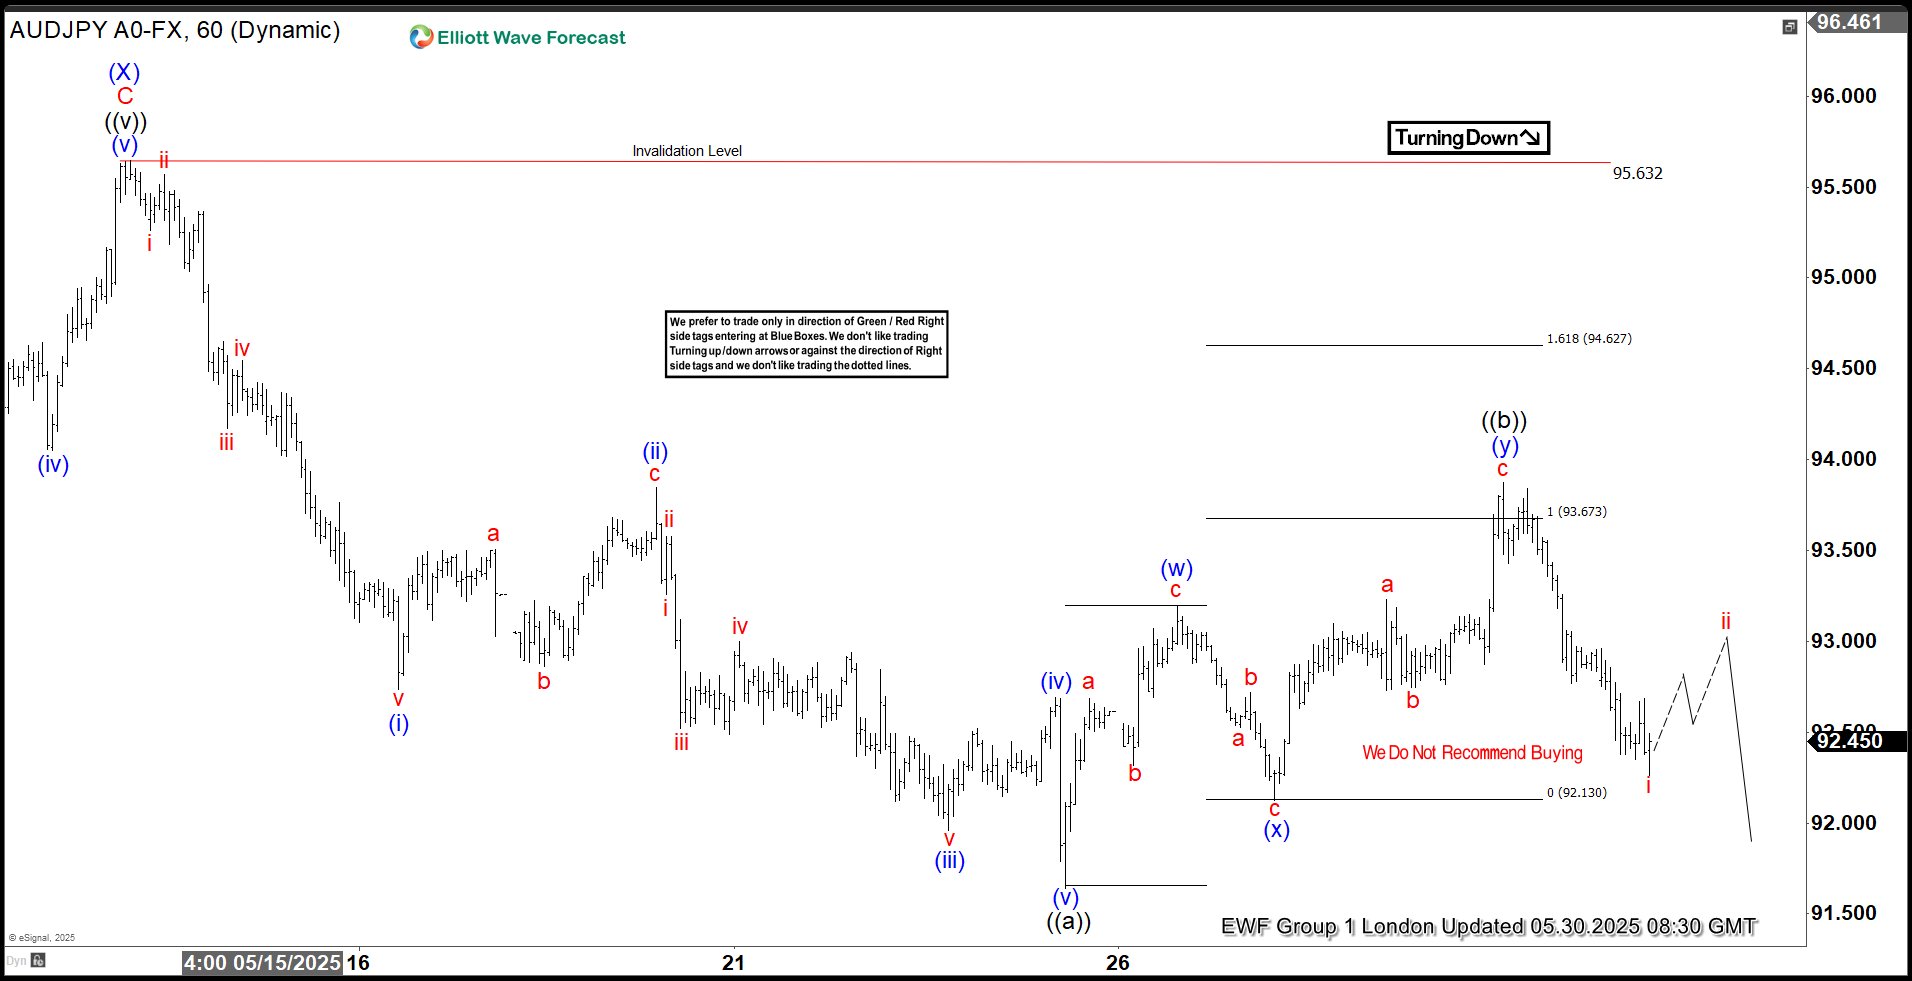
We recommend members to avoid buying the pair. As the main trend remains bearish, we anticipate at least a 3-wave pull back from this Blue Box area. Once the price touches the 50 fibs against the X red connector, we’ll make positions risk-free and set the stop loss at breakeven and book partial profits. On other hand, breaking above the 151.22 peak would invalidate the trade.

Official trading strategy on How to trade 3, 7, or 11 swing and equal leg is explained in details in Educational Video, available for members viewing inside the membership area.

Quick reminder on how to trade our charts :

Red bearish stamp+ blue box = Selling Setup
Green bullish stamp+ blue box = Buying Setup
Charts with Black stamps are not tradable.

USDJPY

USDJPY Elliott Wave 4 Hour Chart 05.08.2025

USDJPY has made extension toward Blue Box 148.39 area and found sellers as expected. The pair is showing a decent drop from our Selling Zone. Now, we would like to see a further decline and break of the (A) blue low to confirm that the next leg down is in progress.

90% of traders fail because they don’t understand market patterns. Are you in the top 10%? Test yourself with this advanced Elliott Wave Test

Reminder for members: Our chat rooms in the membership area are available 24 hours a day, providing expert insights on market trends and Elliott Wave analysis. Don’t hesitate to reach out with any questions about the market, Elliott Wave patterns, or technical analysis. We’re here to help.


Source: https://elliottwave-forecast.com/trading/usdjpy-elliott-wave-trading-setup-2/
 
Progressive Corporation (NYSE: PGR), a leading American insurer, ranks second in U.S. auto insurance. The stock price surged over the past two years as the company’s growth accelerated. Moreover, PGR looks ready to challenge new all-time highs. This article explores Elliott Wave analysis, highlighting bullish patterns that could attract both investors and traders.

PGR Daily Chart​

Elliott Wave Analysis​

The daily chart of PGR highlights an impulsive advance, with the recent peak marking wave (III) low at $292.99. The stock then completed a 3-wave pullback in wave (IV), bottoming at $247.98. From there, it resumed its upward trajectory, aiming to establish a new advance in wave I of (V).
However, PGR must break above its March 2025 peak to confirm the higher-high sequence and sustain its bullish trend. This breakout would unlock further upside potential, targeting the $303 - $320 range.
Until that occurs, the possibility of a double three correction in wave (IV) remains. Consequently, we recommend buyers either wait for a wave II pullback in 3, 7, or 11 swings or consider entering long positions if a double correction materializes, targeting the next extreme area at $242 - $214.

Conclusion​

The bullish Super Cycle for PGR continues, offering opportunities to buy daily and weekly corrective pullbacks using our Elliott Wave strategy. The ideal entry involves waiting for the stock to complete a 3, 7, or 11 swing sequence from its peak. Moreover, our extreme Blue Box system enhances precision, helping traders identify optimal entry points with clarity and confidence.

Source: https://elliottwave-forecast.com/stock-market/pgr-strong-upside-beyond-300/
 
Hello traders. In this article, we are going to present another Elliott Wave trading setup we got in Dollar Index . As our members know DXY index remains bearish against the 109.96 pivot. Recently Dollar made a clear 7 swings pattern and completed its correction precisely at the Equal Legs zone, referred to as the Blue Box Area. In the following sections, we are going to explain Elliott Wave pattern and discuss the trading setup in detail.

DXY Elliott Wave 4 Hour Chart 05.10.2025

Dollar is doing recovery against the 109.96 peak. The price action shows an incomplete higher high sequences in the rally from the low, suggesting potentially more short term strength. This correction is unfolding as an Elliott Wave Double Three pattern. We expect more upside toward the Blue Box zone at 101.61-103.15 area, where we are looking to re-enter as sellers.

We recommend members to avoid buying Dollar. As the main trend remains bearish, we expect at least a 3-wave pull back from this Blue Box area. Once the price touches the 50 fibs against the X red connector, we’ll make positions risk-free and set the stop loss at breakeven and book partial profits. On other hand, breaking above the 103.15 peak would invalidate the trade.

90% of traders fail because they don’t understand market patterns. Are you in the top 10%? Test yourself with this advanced Elliott Wave Test

Official trading strategy on How to trade 3, 7, or 11 swing and equal leg is explained in details in Educational Video, available for members viewing inside the membership area.

Quick reminder on how to trade our charts :

Red bearish stamp+ blue box = Selling Setup
Green bullish stamp+ blue box = Buying Setup
Charts with Black stamps are not tradable.

DXY

DXY Elliott Wave 4 Hour Chart 05.14.2025

The Dollar has extended into the Blue Box area between 101.61 and 103.15 and, as expected, found sellers. DXY has made a solid decline from our Selling Zone. As a result, any short positions taken from the Blue Box should now be risk-free, with partial profits already booked.

At this point, we would like to see a further decline and a break below the April 21st low to confirm that the next leg down is in progress.

Reminder for members: Our chat rooms in the membership area are available 24 hours a day, providing expert insights on market trends and Elliott Wave analysis. Don’t hesitate to reach out with any questions about the market, Elliott Wave patterns, or technical analysis. We’re here to help.

DXY

Source: https://elliottwave-forecast.com/trading/dollar-index-dxy-selling-blue-box/
 
As our members know we have had many profitable trading setups recently. In this technical article, we are going to talk about another Elliott Wave trading setup we got in EURUSD . The pair has completed its correction exactly at the Equal Legs zone, also known as the Blue Box Area. In this article, we’ll break down the Elliott Wave Forecast and explain the logic behind the trading setup in detail.

EURUSD Elliott Wave 4 Hour Chart 05.10.2025​

The price is showing a lower-low sequence from the peak. As of now, we can count five swings, which makes it an incomplete sequence. The price action suggests that EURUSD is forming a pullback in the form of a double three (WXY) structure.
The correction is still in progress, and we expect another leg down toward the 1.10725 – 1.08788 area, where we are looking to re-enter as buyers.

We recommend members avoid selling EURUSD. As the main trend remains bullish, we anticipate at least a three-wave bounce from the Blue Box area.
Once the price reaches the 50% Fibonacci retracement against the red X connector, we’ll make the position risk-free by moving the stop loss to breakeven and booking partial profits.

Did you know ? 90% of traders fail because they don’t understand market patterns. Are you in the top 10%? Test yourself with this advanced Elliott Wave Test

Official trading strategy on How to trade 3, 7, or 11 swing and equal leg is explained in details in Educational Video, available for members viewing inside the membership area.

EURUSD

EURUSD Elliott Wave 4 Hour Chart 05.14.2025​

EURUSD has made another wave down and completed 7 swings pattern at the Blue Box area. The pair found buyers as expected, making decent bounce. Consequently, any long positions from the Blue Box should now be risk-free. We’ve set our stop loss at breakeven and have already secured partial profits.

Reminder for members: Our chat rooms in the membership area are available 24 hours a day, providing expert insights on market trends and Elliott Wave analysis. Don’t hesitate to reach out with any questions about the market, Elliott Wave patterns, or technical analysis. We’re here to help.

EURUSD

Source: https://elliottwave-forecast.com/trading/eurusd-trade-setup-buying-blue-box/
 

About BYD: China's Electric Vehicle Market Leader​

BYD Company Limited (ticker: 1211.HK on the Hong Kong Stock Exchange) is a Chinese multinational powerhouse based in Shenzhen. Originally a battery manufacturer, BYD has emerged as the world’s leading producer of plug-in electric vehicles, surpassing Tesla by 2022. By 2023, it had sold over 3 million new energy vehicles, driven by popular models like the affordable Dolphin and its innovative Blade Battery. Recently, the stock has surged to a new all-time high within Wave (III). Below, we explore its long-term Elliott Wave trajectory.

Monthly Elliott Wave Perspective


The monthly chart for BYD displays a completed Wave (I)-(II) structure, with the current price action indicating a breakout in Wave (III)


The monthly Elliott Wave chart for BYD illustrates a strong upward trend, with the stock reaching a new all-time high within Wave (III). From its all-time low, BYD rallied impulsively in five waves, completing Wave (I) at 333, followed by a Wave (II) pullback to 161.70. The stock then continued its ascent in Wave (III) as a nest. From the Wave (II) low, Wave I peaked at 426.60, with a subsequent Wave II pullback to 309.80. As BYD continues to break to new all-time highs and remains above 161.70, further upside is anticipated.

Daily Chart Breakdown

BYD Elliott Wave Chart

The daily chart for BYD illustrates the ongoing progression of Wave (III), featuring nested sub-waves within its structure


The daily Elliott Wave chart for BYD illustrates the stock's ongoing rally within Wave (III). The structure shows Wave (I) peaking at 333, followed by a Wave (II) pullback to 161.70. From there, the stock advanced in Wave ((1)) to 280.60, with a Wave ((2)) pullback to 167.80. The rally resumed in Wave ((3)) to 320.80, followed by a Wave ((4)) dip to 245.50. The final Wave ((5)) completed at 426.60, marking the end of Wave I of (III). A subsequent pullback in Wave II of (III) concluded at 309.80, and the stock has since resumed its ascent to a new all-time high. As long as the pivot low at 161.70 holds, expect pullbacks to attract buyers in a 3, 7, or 11-swing sequence, supporting further upside.

Source: https://elliottwave-forecast.com/st...hk-emerges-correction-resumes-strong-uptrend/
 
Boston Scientific Corporation (BSX) develops, manufactures & markets medical devices for use in various interventional medical specialties worldwide. It operates through MedSurg & Cardiovascular segments. It offers devices to diagnose & treat different medical conditions & offer remote patient management systems. It comes under Healthcare sector & trades as “BSX” ticker at NYSE.

BSX favors rally in V (as previous article) started from $85.98 low in double correction from daily blue box. It expects rally to extend at least $112.20 – $120.29 area to before next pullback starts.

BSX - Elliott Wave Latest Daily View:​

In weekly sequence, it placed (II) at $24.10 low in March-2020 & II of (III) at $34.98 low in June-2022. Above there, it placed III of (III) at $107.17 high of 2.05.2025 & IV pullback at $85.98 low in daily blue box area on 4.07.2025. Within III, it ended ((1)) at $55.38 high, ((2)) at $48.35 low, ((3)) as extended wave at $91.93 high, ((4)) at $87.25 low & finally ((5)) at $101.17 high. The pullbacks of ((2)) & ((4)) are shallow in III, which indicates the strong bullish sequence.

BSX - Elliott Wave View From 4.14.2025:​

In IV pullback, it placed ((W)) at $93.29 low, ((X)) at $104.35 low & ((Y)) ended at $84.01 low in blue box area. We recommended long position from blue box area against $81.78 low, which reacted higher. Buyers are already having risk free longs, looking for more upside, once it breaks above $107.17 high. Within rally in ((1)), it ended (1) at $95.05 high, (2) at $86.77 low & favors rally in (3) towards $106.66 - $108.18 area before pullback in (4). It expects further upside in nine swings to finish the ((1)) of V, which may break to new high in daily, before larger pullback. Above daily high, we like to buy the pullback in 3, 7 or 11 swings at extreme area.

Source: https://elliottwave-forecast.com/stock-market/bsx-navigating-market-trends-price-action/
 
EQT Corporation (NYSE: EQT) found a strong buying opportunity in the 2023 Blue Box Area, allowing the stock to resume its rally toward new all-time highs. Moreover, in today's article, we explore the Elliott Wave structure, highlighting potential paths and targets for its continued bullish momentum.

EQT Weekly Chart​

Elliott Wave Analysis​

The weekly chart of EQT highlights its advance from the 2020 low, with wave (I) peaking at $51.97, followed by a 3-wave pullback in wave (II) that ended at $28.11. After that, the stock confirmed a bullish sequence by reaching new all-time highs, signaling the continuation of wave (III).

Currently, EQT is progressing through a 5-wave advance from its 2023 low, steadily approaching the 61.8% Fibonacci extension zone at $57.75 - $64.74, where wave I of (III) could complete. Moreover, once this level is reached, a wave II pullback is expected, providing a buying opportunity in 3, 7, or 11 swings. Furthermore, the stock remains supported, with the next upside target aiming for the equal legs area between $76 - $105.

Conclusion​

The bullish Grand Super Cycle for EQT continues, creating opportunities to buy daily and weekly corrective pullbacks using our Elliott Wave strategy. The best approach involves entering after the stock completes a 3, 7, or 11 swing sequence from its peak. Moreover, our extreme Blue Box system improves precision, helping traders identify entry points with clarity and confidence.

Source: https://elliottwave-forecast.com/stock-market/eqt-corporation-weekly-bullish-sequence/
 
Hello traders. As our members know, we have had many profitable trading setups recently. In this technical article, we are going to talk about another Elliott Wave trading setup we got in GOLD. The commodity has completed its correction exactly at the Equal Legs zone, also known as the Blue Box Area. In this article, we’ll break down the Elliott Wave Forecast and explain the logic behind the trading setup in detail.

GOLD Elliott Wave 4 Hour Chart 05.12.2025​

The pull back looks incomplete at the moment. The price action suggests that GOLD is still doing a correction in the form of a double three (WXY) structure. We expect another leg down toward the 3136.56 area, where we are looking to re-enter as buyers. As the main trend remains bullish, we anticipate at least a three-wave bounce from the Blue Box area. We recommend members avoid selling GOLD. Once the price reaches the 50% Fibonacci retracement against the red X connector, we’ll make the position risk-free by moving the stop loss to breakeven and booking partial profits.

Did you know ? 90% of traders fail because they don’t understand market patterns. Are you in the top 10%? Test yourself with this advanced Elliott Wave Test

Official trading strategy on How to trade 3, 7, or 11 swing and equal leg is explained in details in Educational Video, available for members viewing inside the membership area.


GOLD

GOLD Elliott Wave 4 Hour Chart 05.12.2025​

GOLD has made another wave down and completed 7 swings pattern at the Blue Box area. The commodity found buyers as expected, making decent bounce. Consequently, any long positions from the Blue Box should now be risk-free. We’ve set our stop loss at breakeven and have already secured partial profits.

Reminder for members: Our chat rooms in the membership area are available 24 hours a day, providing expert insights on market trends and Elliott Wave analysis. Don’t hesitate to reach out with any questions about the market, Elliott Wave patterns, or technical analysis. We’re here to help.


Source: https://elliottwave-forecast.com/commodities/gold-xauusd-elliott-wave-buying/