Hello everyone! In today’s article, we’ll examine the recent performance of SPDR Metals & Mining ETF ($XME) through the lens of Elliott Wave Theory. We’ll review how the decline from the November 07, 2024, high unfolded as a big 3-swing correction and discuss our forecast for the next move. Let’s dive into the structure and expectations for this ETF.

In the Daily Elliott Wave count from April 06, 2025, we see that $XME completed a 5-wave impulsive cycle at blue ((I)). As expected, this initial wave prompted a pullback. We anticipated this pullback to unfold in 3 swings first, likely finding buyers in the equal legs area between $48.07 and $38.93.
This setup aligns with a typical Elliott Wave correction pattern (ABC), in which the market pauses briefly before resuming its primary trend.

The most recent update, from April 13, 2025, shows that the ETF bounced as predicted allowing buyers to get risk-free. After the decline from the November peak, the ETF is now finding support in the equal legs area. Currently, it is building a 5-wave impulse in wave ((1)), which should be followed by a pullback in wave ((2)). After that, the market is expected to continue higher in a renewed bullish cycle.
Source: https://elliottwave-forecast.com/st...me-blue-box-area-offers-a-buying-opportunity/
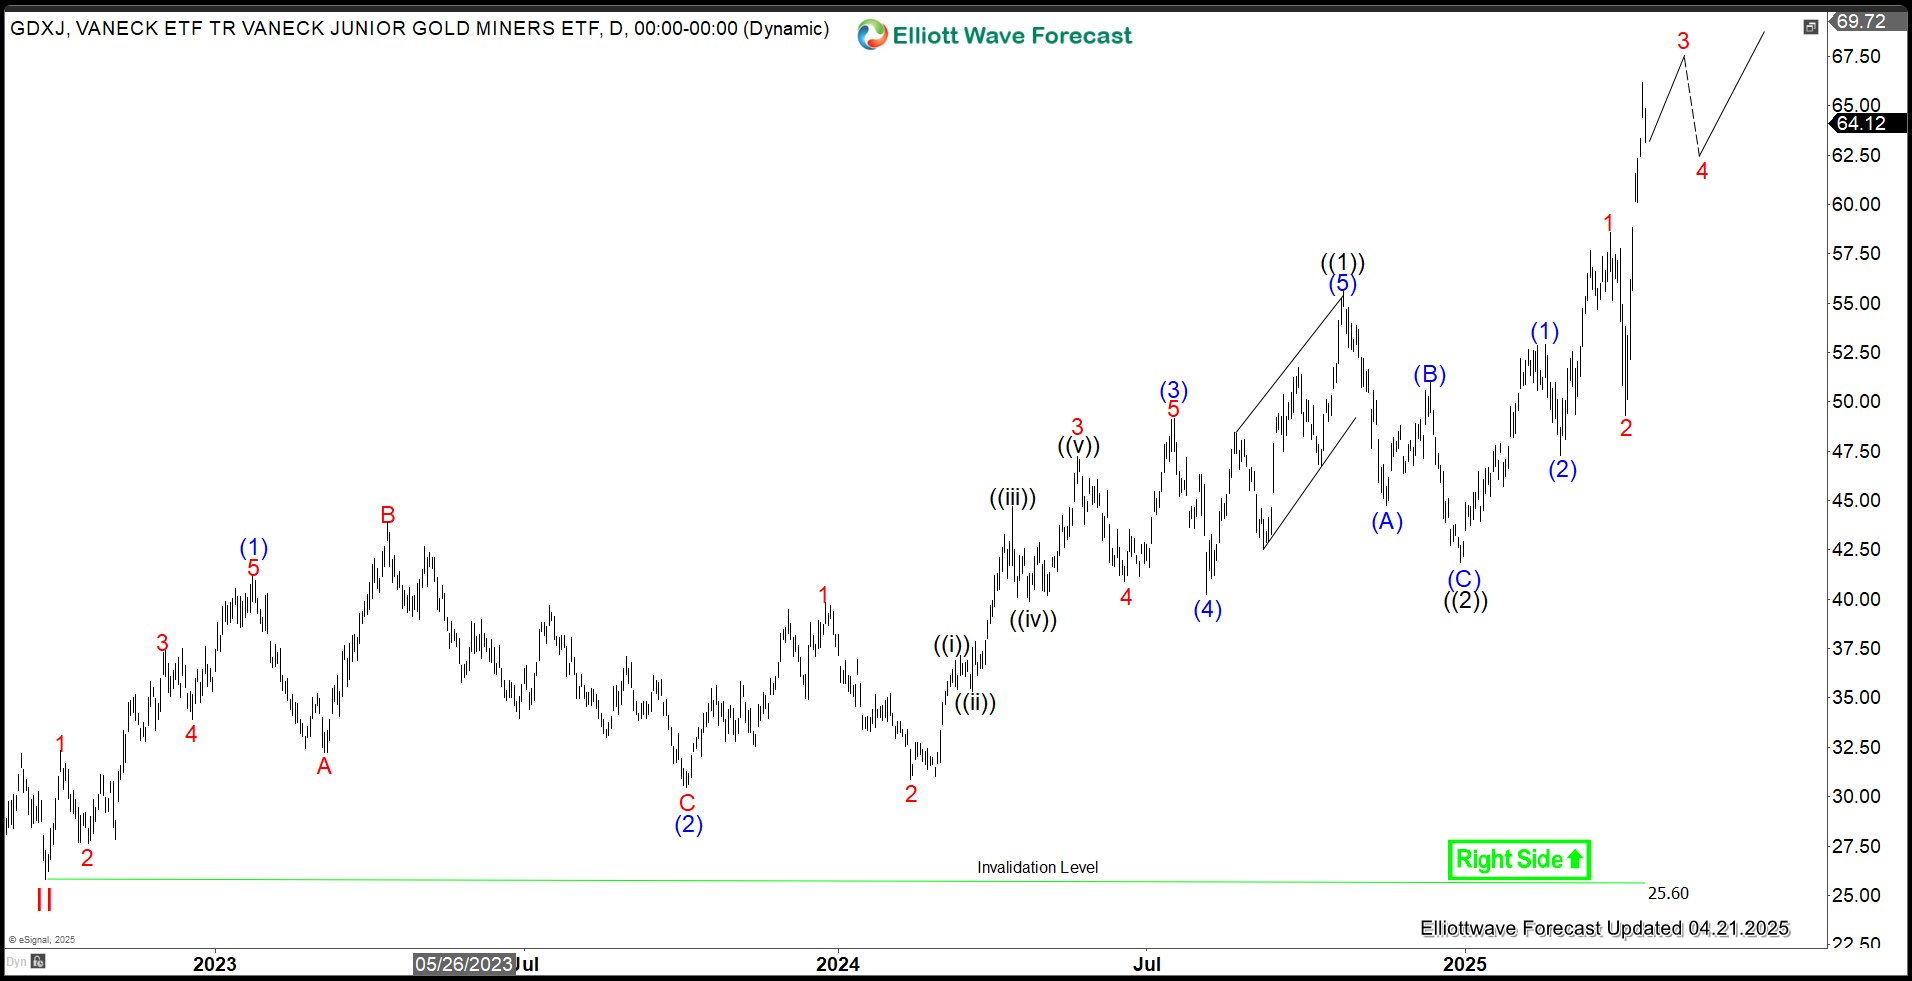
$XME Daily Elliott Wave Chart 4.06.2025:

In the Daily Elliott Wave count from April 06, 2025, we see that $XME completed a 5-wave impulsive cycle at blue ((I)). As expected, this initial wave prompted a pullback. We anticipated this pullback to unfold in 3 swings first, likely finding buyers in the equal legs area between $48.07 and $38.93.
This setup aligns with a typical Elliott Wave correction pattern (ABC), in which the market pauses briefly before resuming its primary trend.
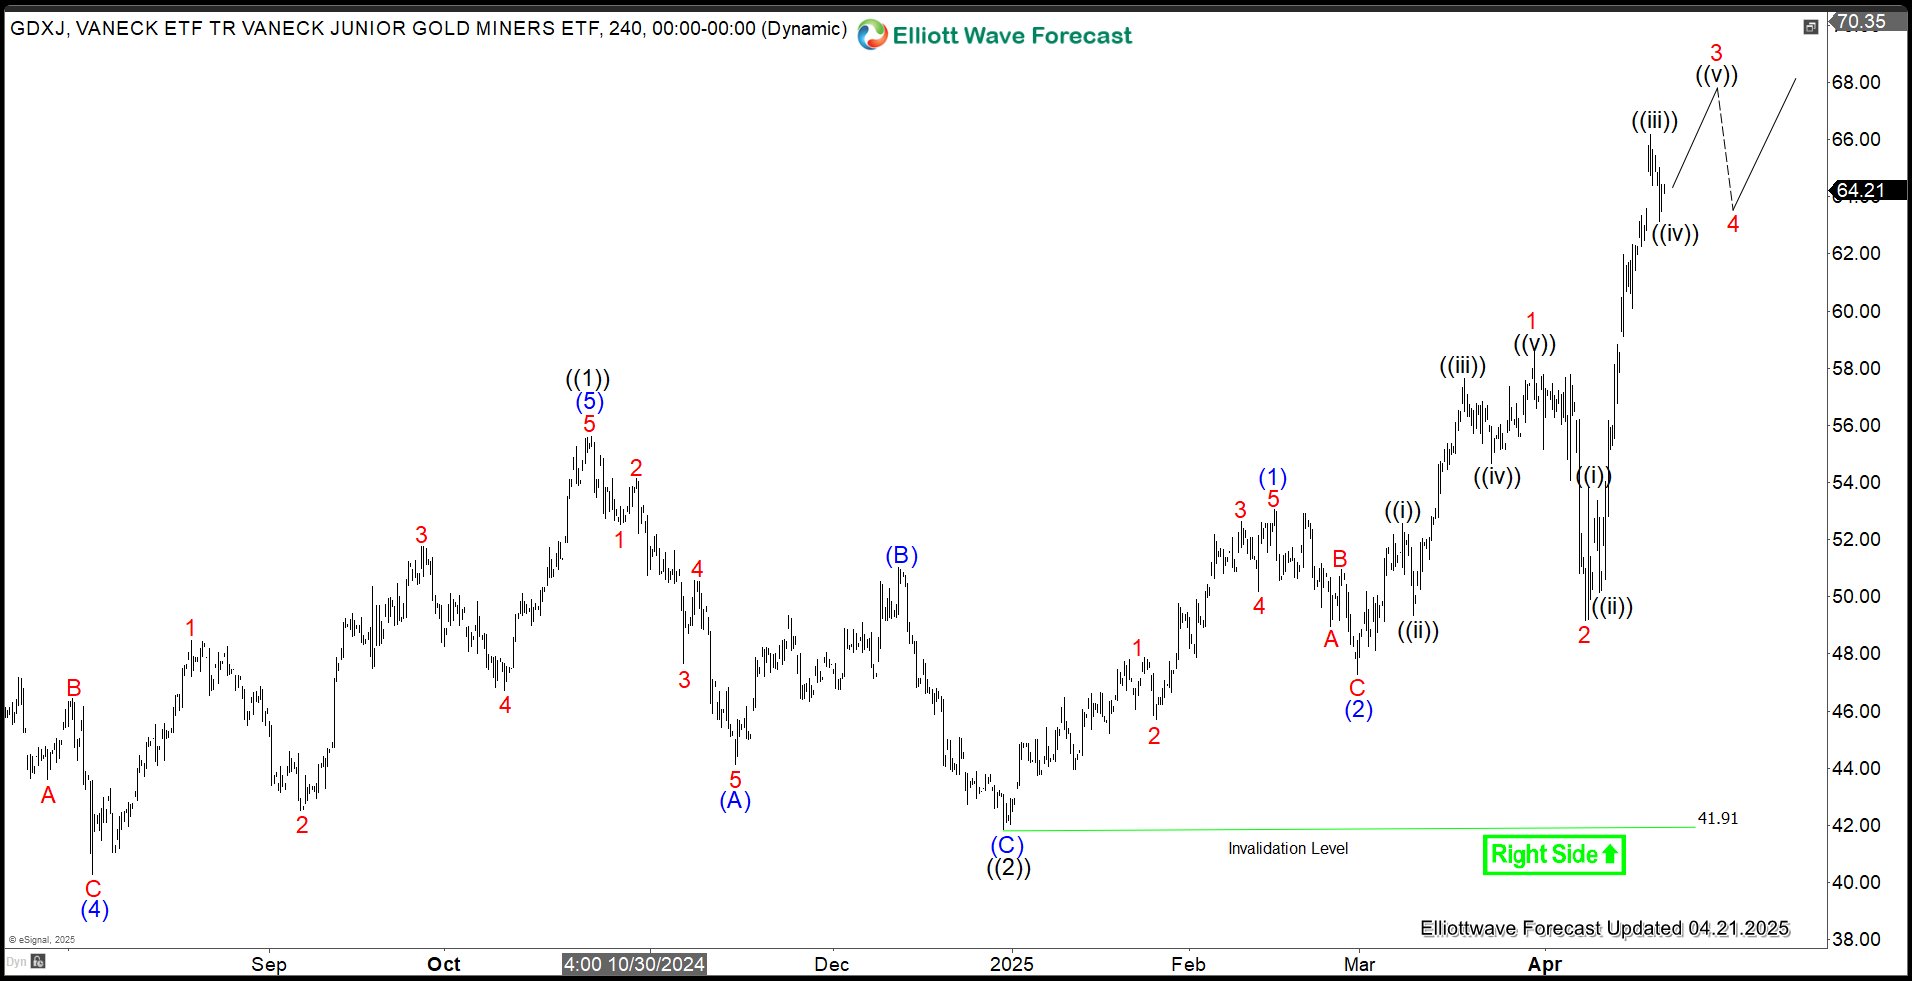
$XME Daily Elliott Wave Chart 4.13.2025:

The most recent update, from April 13, 2025, shows that the ETF bounced as predicted allowing buyers to get risk-free. After the decline from the November peak, the ETF is now finding support in the equal legs area. Currently, it is building a 5-wave impulse in wave ((1)), which should be followed by a pullback in wave ((2)). After that, the market is expected to continue higher in a renewed bullish cycle.
Conclusion
In conclusion, our Elliott Wave analysis of SPDR Metals & Mining ETF ($XME) suggests that it could bounce in the short term. As a result, traders should monitor the $56–$58 zone as the next potential target. In the meantime, keep an eye out for any corrective pullbacks that may offer entry opportunities. By applying Elliott Wave Theory, traders can better anticipate the structure of upcoming moves and enhance risk management in volatile markets.Source: https://elliottwave-forecast.com/st...me-blue-box-area-offers-a-buying-opportunity/


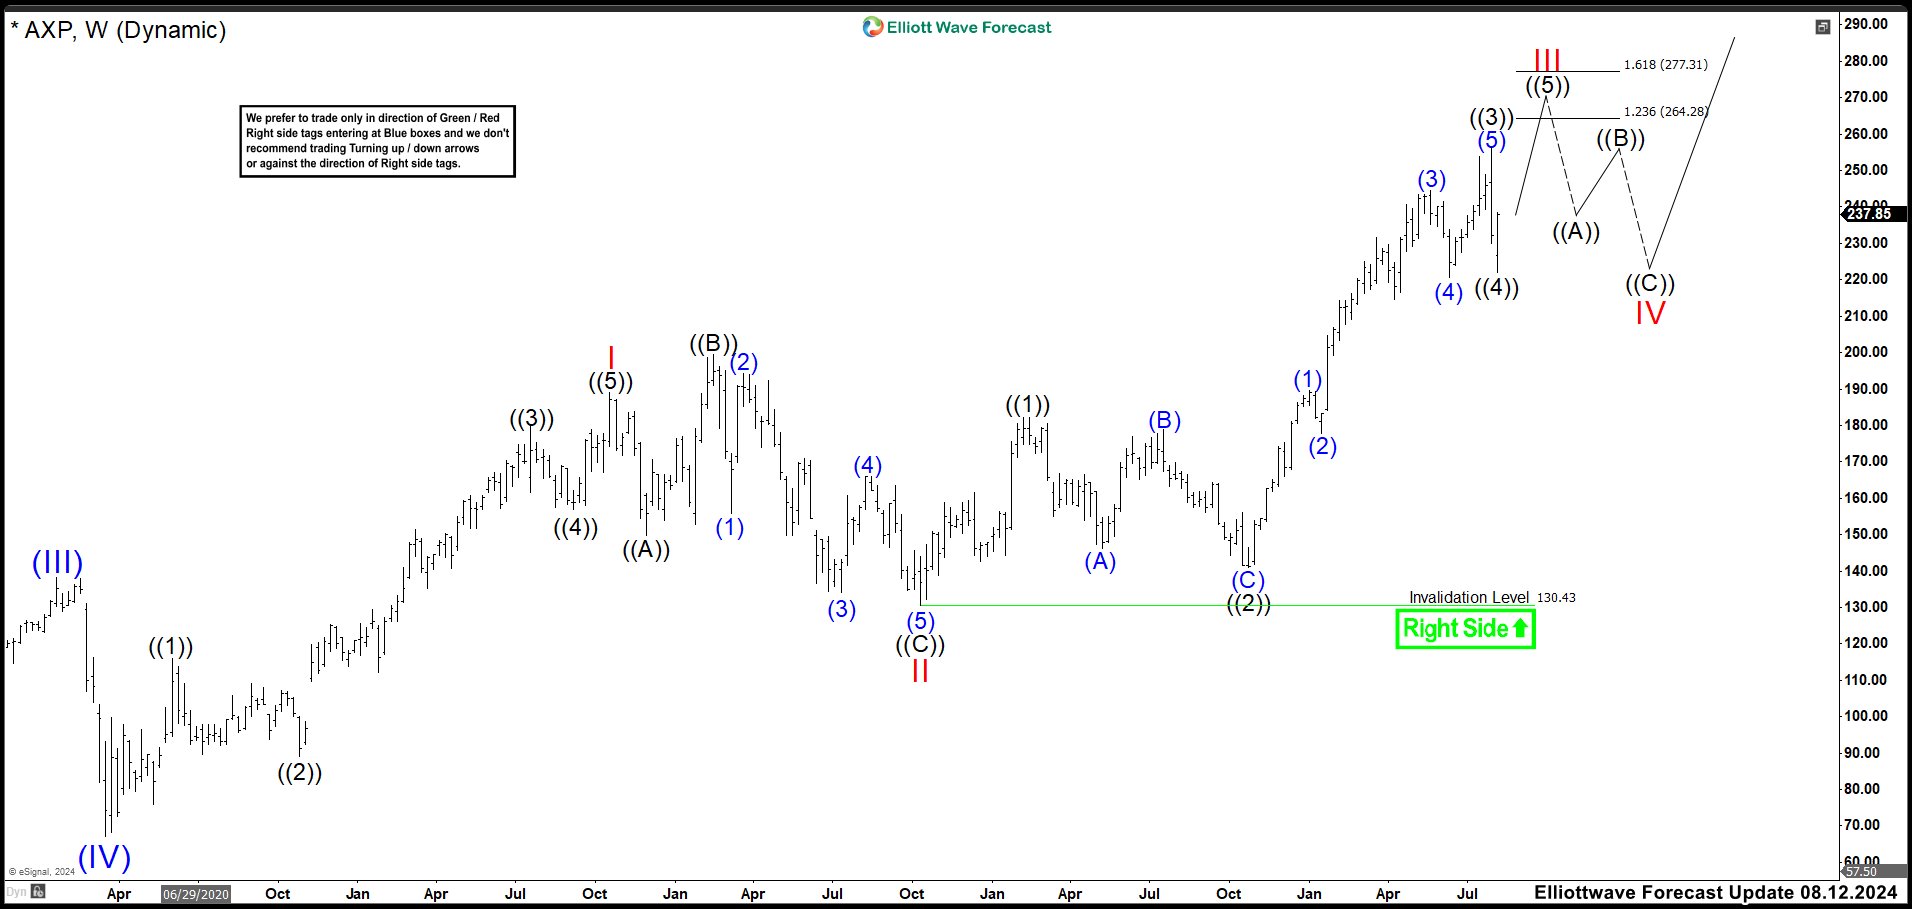
 August 2024 Weekly Chart")
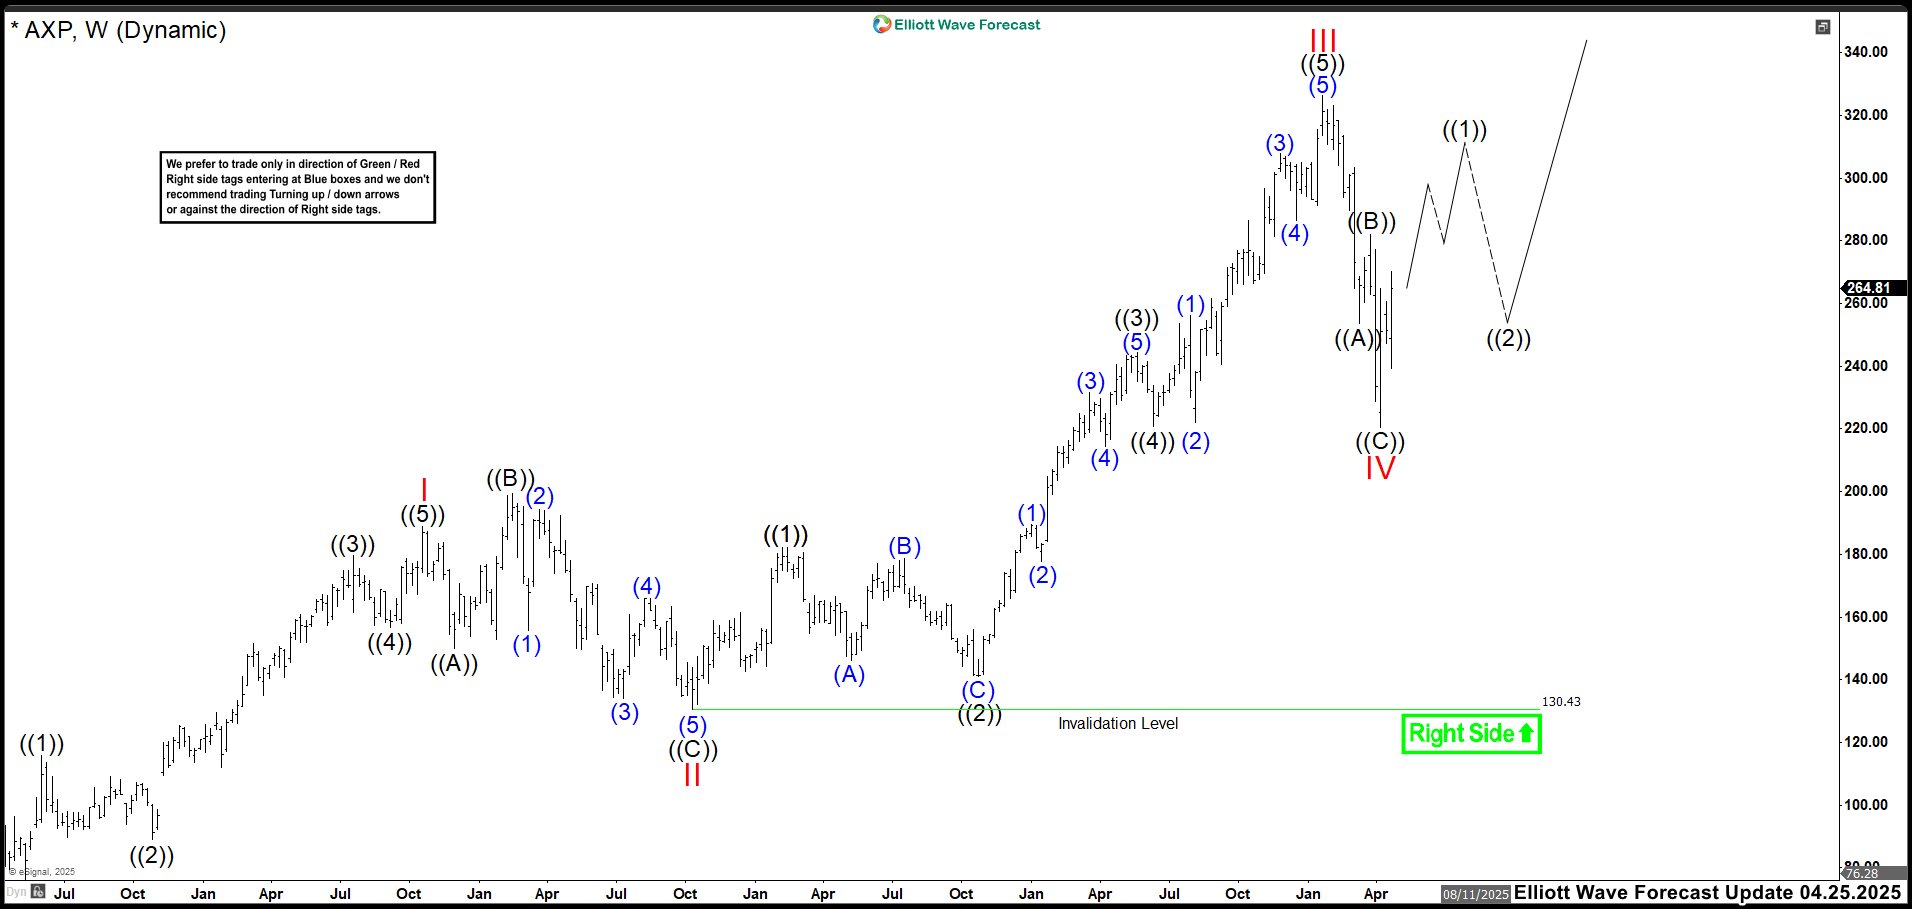
 April 2025 Weekly Chart")