Elliottwave-Forecast

Master Trader
Feb 17, 2017
2,426
9
84
www.elliottwave-forecast.com
In this blog, we will take a look at the recent rally in Nasdaq Futures up from May 20, 2022 low, structure of this rally and some charts from the recent past showing our forecast calling for a new high to complete the sequence before starting a pull back. We will then look at how the move unfolded going forward and what we are expecting next. Before we start the blog, we will explain Impulse Elliott Wave Structures.

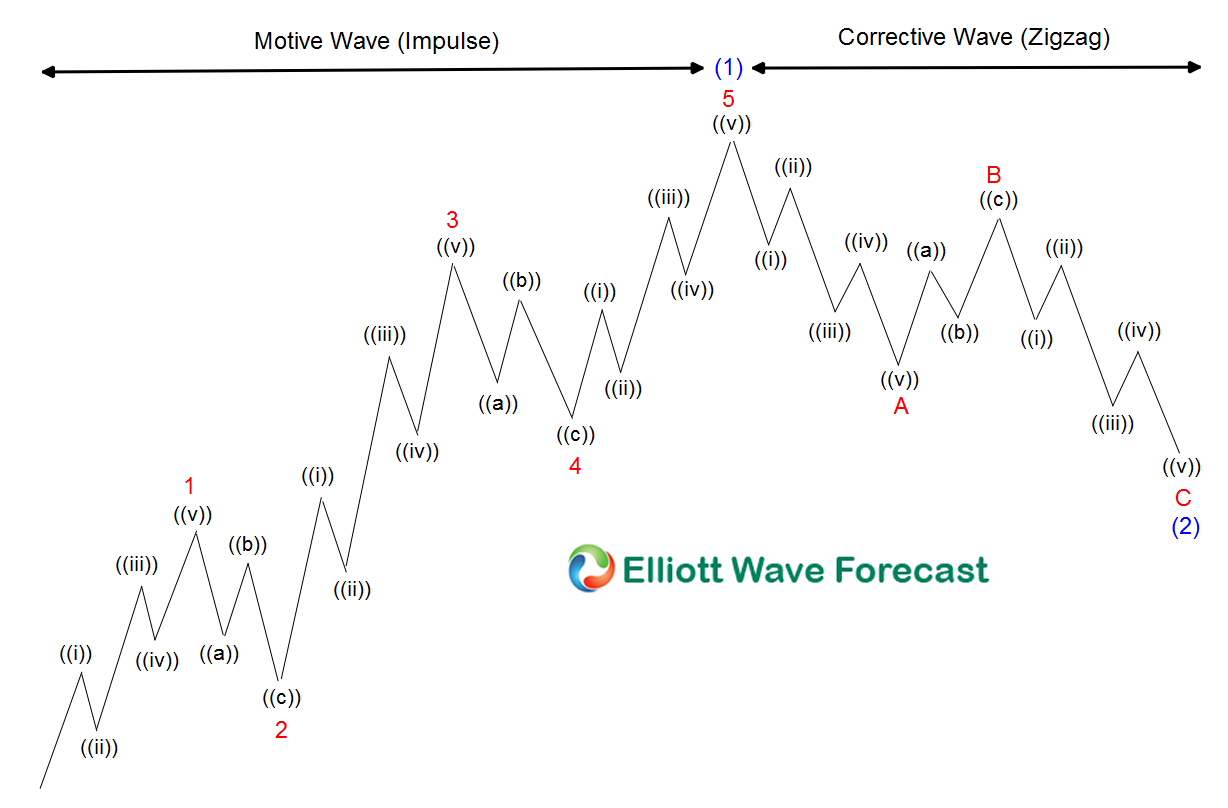
Elliott Wave Impulse Structure​

Graphic below shows a 5 waves advance from the low to the high, this is called an Elliott Wave Impulse. Wave 1, 3 and 5 should also be impulses, wave 2 and 4 should be corrective structures. Wave 3 must not be the shortest wave in the sequence, wave 4 shouldn't enter the territory of wave 1 (unless structure is a diagonal) and there must be momentum divergence between wave 3 and 5. Following completion of an impulse wave, there is a move in the opposite direction in 3 waves at least. This move is shown as an ABC (Zigzag structure) in the graphic below.

Elliott Wave Impulse Graphic

Nasdaq Futures 1 Hour Elliott Wave Analysis - 2 June 2022​

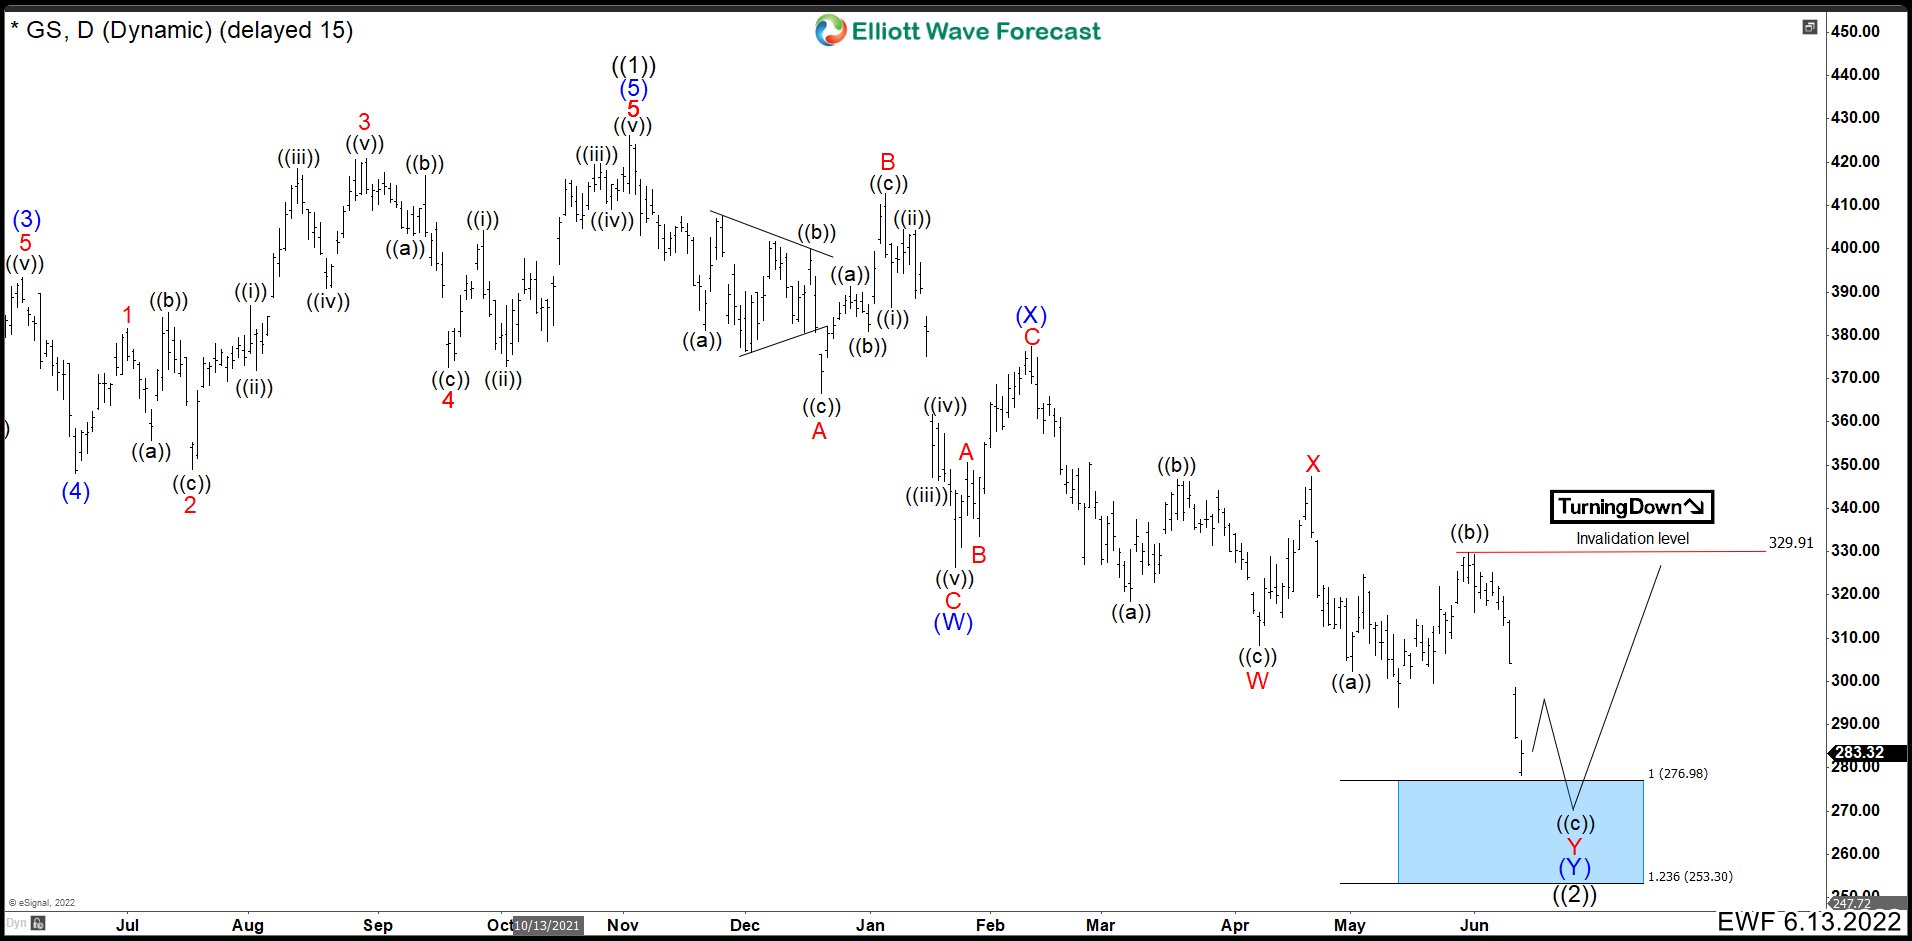
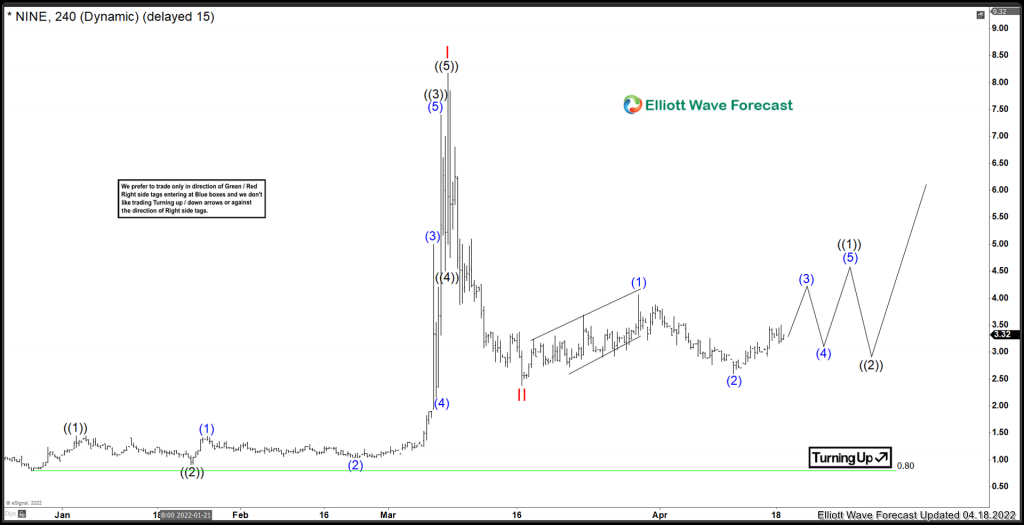
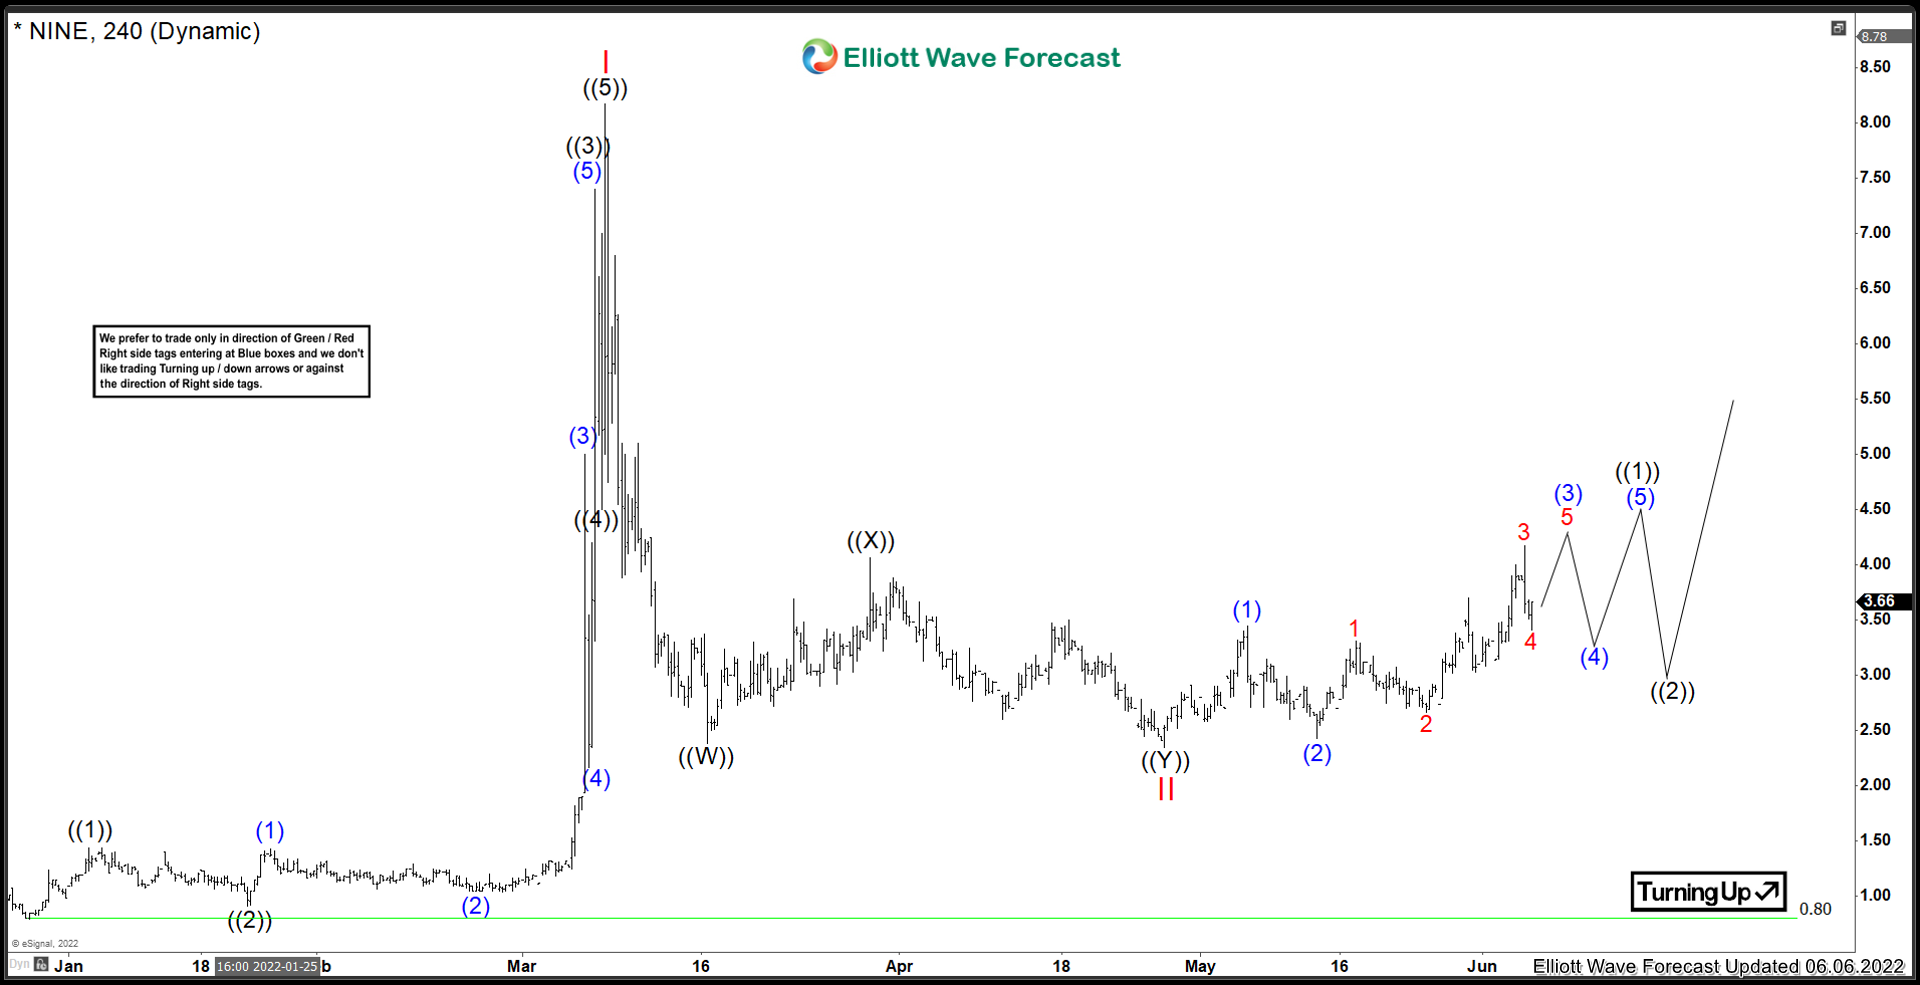
Chart below Nasdaq Futures found a low at 11492.81 on May 20, 2022. Up from there wave (( i )) ended at 12075.50, wave (( ii )) pull back ended at 11675.25, wave (( iii )) ended at 12883, wave (( iv )) ended at 12454.75 and now it is expected to trade higher in wave ((v)) to complete 5 waves up from May 20, 2022 low.


Nasdaq Futures Elliott Wave 2 June Chart

Nasdaq Futures 1 Hour Elliott Wave Analysis - 3 June 2022​

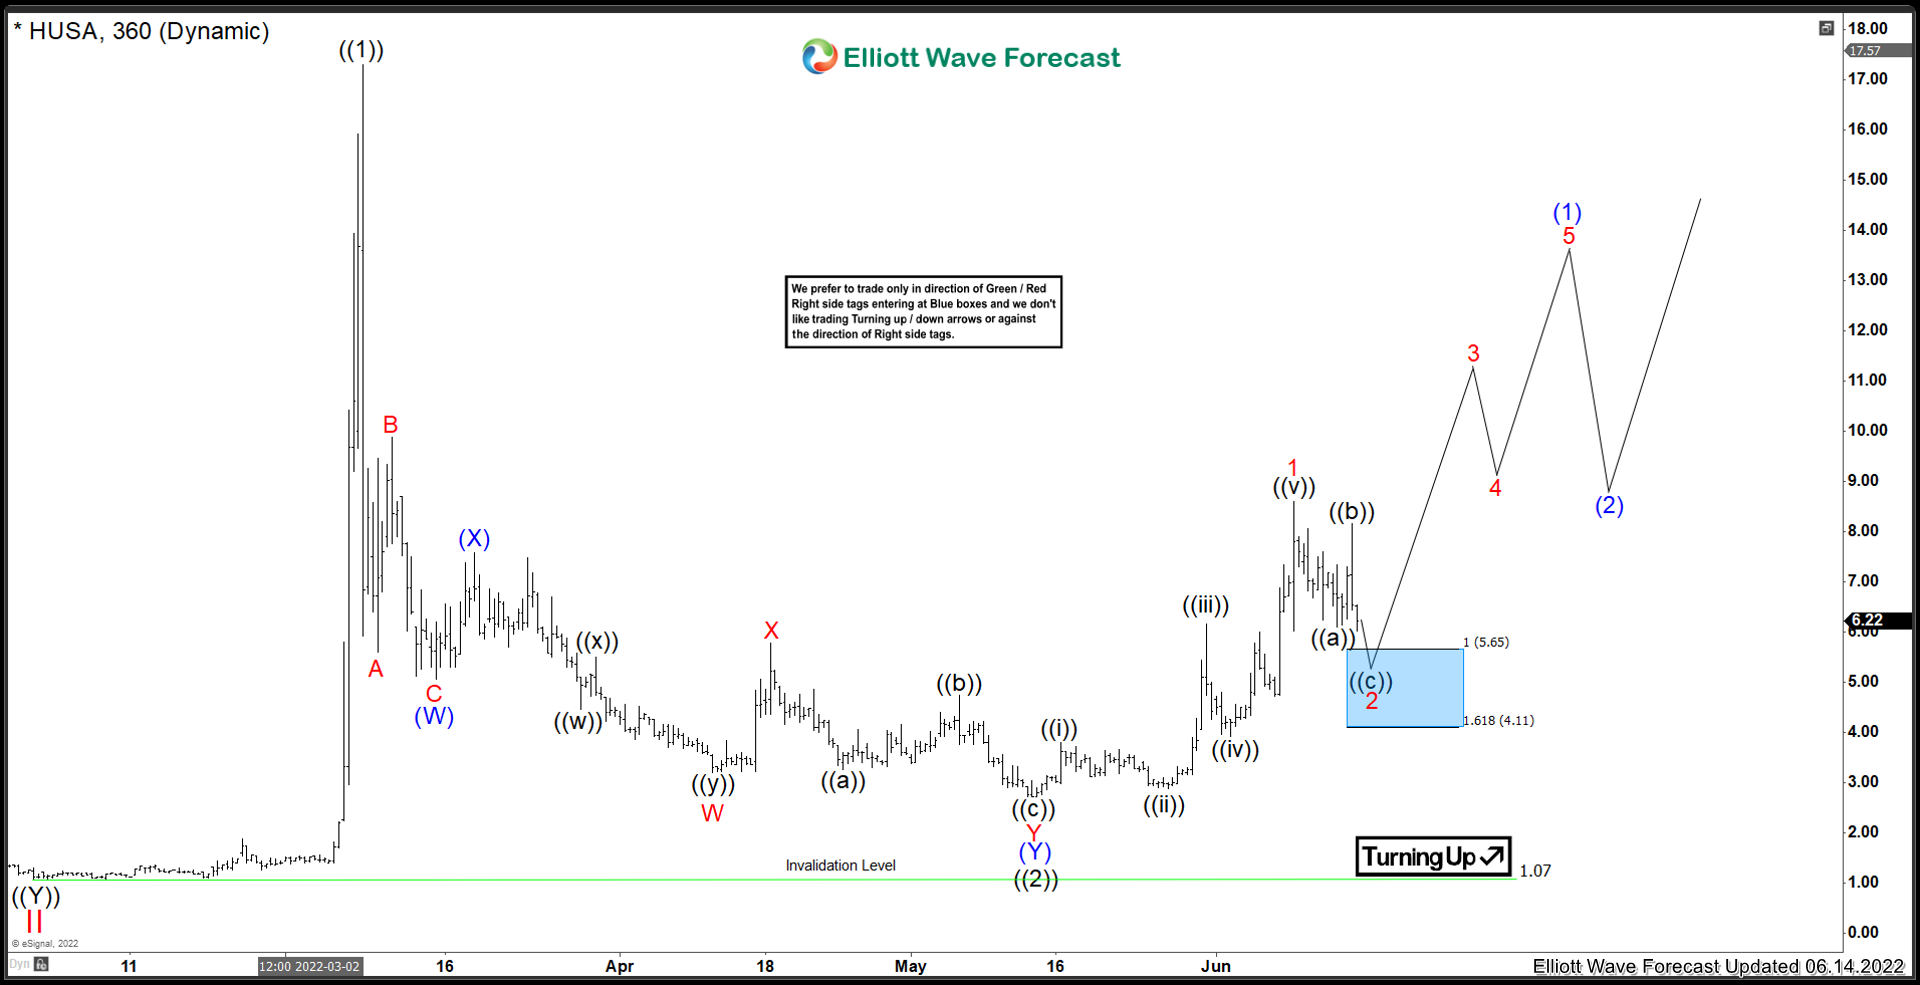
Chart below shows Nasdaq Futures made a marginal new low below 12454.75 low but rally from May 20, 2022 low was in 3 waves so this new low was treated as part of wave ((iv)) which completed at 12442.50. Price went on to make a new high above wave ((iii)) as expected and completed wave ((v)) at 12945.25 and pulled back sharply. Following an Impulse Elliott wave structure, there should be a 3 waves move at minimum in the opposite direction so we are expecting a 3 waves pull back at least to correct the cycle from May 20, 2022 low before Nasdaq futures turn higher again. We are close to completing wave ((a)) and once completed, expect a bounce in wave ((b)) to fail below 12945.25 peak before ((c)) leg lower to complete wave 2 and then resume the rally in wave 3 or bounce in 3 waves at least. If price makes a new high above 12945.25, wave ((v)) could take the form of an extended wave ((v)).

Nasdaq Futures 3 June 1 Hour Elliott Wave Analysis

Source: https://elliottwave-forecast.com/stock-market/nasdaq-path-elliott-wave/
 

Elliottwave-Forecast

Master Trader
Feb 17, 2017
2,426
9
84
www.elliottwave-forecast.com
The last time I covered Nine Energy Services was back in Apri 2022. At the time, the stock was looking like more upside was favoured. Before we get into the charts, lets get a refresher on this company:

“Nine Energy Service, is a nimble completions company with experience in major North American basins and abroad, and a deep commitment to serving clients with smarter, customized answers and world-class resources. Nine is dedicated to qualifying what you want to accomplish, and then developing solutions that fit your project, your budget, and your goals. We believe in being a partner to our client, thinking outside the box and accomplishing what others cannot.

Nine is a leading completion services provider that targets unconventional oil and gas resource development across all North American basins and abroad. Nine brings years of experience into play with a new breed of a company dedicated to helping our clients reach their goals in the most efficient and cost-effective way.”


Lets take a look at the chart from April:

Nine Energy Services April 2022:​


At the time, it did look like the bottom was set, however, in the "middle area" it is important to wait for confirmation. Sometimes, the market was to do a double correction, which in this case, took place. The stock prices did invalid that Red II low, lets take a look at the current idea.

Nine Energy Services June 2022:​


Medium term term view from the low set Dec 28/2021 @ $0.80. Nine is a technically clean chart off that low. Initially, the stock formed a nest in ((1)) ((2)) and blue (1) (2) off that low. After that, Nine broke out into a wave 3 of 3 advance. This took the stock from a low of $1.04 at (2), to a peak of $8.17 at the ((5)) of Red I high. After that, a sharp pullback has taken place while profit taking has occurred. Red II is favoured to have struck a low at 2.35 on April 27/2022. From there, a a choppy advance in ((1)) is favoured to be underway with a few swings left to play out. As long as the recent low at Red II remains intact, the next leg higher is favoured to be underway.

Source: https://elliottwave-forecast.com/stock-market/nine-energy-services-nine-extension-higher-favoured/
 

Elliottwave-Forecast

Master Trader
Feb 17, 2017
2,426
9
84
www.elliottwave-forecast.com
American Outdoor Brands, formerly known as Smith & Wesson Holding Corporation, is an US American manufacturer of outdoor sports and recreation products. The company holds currently 18 brands of outdoor equipment. Headquartered in Columbia, Missuri, USA, investors can trade it under the ticker $AOUT at NASDAQ.

American Outdoor Brands Daily Elliott Wave Analysis 06.06.2022​

The Daily chart below shows the American Outdoor Brands stock $AOUT traded at Nasdaq. From the all-time lows, the stock price has developed an initial cycle in wave I (not shown) of cycle degree. It has printed the all-time high on July 2021 at 36.62. From the highs, the pullback in wave II has unfolded as a double three pattern. On its own, the ((W))((X))((Y)) double three structure shows a textbook quality.

First, the decline in wave ((W)) has made an intermediary bottom in October 2021 at 21.71. Then, the bounce in black wave ((X)) has set a connector in November 2021 at 25.26. Finally, black wave ((Y)) has developed another 3 swings being swings 5-6-7 of the overall 7 swings structure. Hereby, the 5th swing as blue wave (W) has reached the 0.618-0.786 extension area being 16.01-13.48 area. There, a bounce in swing #6 in wave (X) has taken place. From February 2022, 7th swing lower as wave (Y) of ((Y)) has perfectly hit the 100% extension level being 10.27. The main view is that the wave II has ended in May 2022.

Investors an traders should be long from 10.27-6.73 area already. While above May 2022 lows at 10.13, the wave III might be already in progress. The target will be 46.77-69.42 area and even higher. At current prices between 11 and 12 US Dollars per share, $AOUT offers a great reward-to-risk ratio.

American Outdoor Elliott Wave Daily

Source: https://elliottwave-forecast.com/stock-market/american-outdoor-new-rally/
 

Elliottwave-Forecast

Master Trader
Feb 17, 2017
2,426
9
84
www.elliottwave-forecast.com
The Gold to Silver Ratio (AUG) is always a good indicator of the path of commodities and the $USDX. The ratio found sellers on March.2020, and the peak agrees with the peak in the $USDX back in 03.2020. As we can see, the Ratio did a five waves decline, and now it is correcting in three waves pullback.

Monthly Gold-to-Silver Ratio Elliott Wave Chart​

Gold/Silver (AUG) Ratio Elliott Wave Chart

The rally in the ratio reflects the Grand Super Cycle from the all-time lows and reached the blue box area. The Ratio then reacted lower, and now is bouncing in three waves. Afterwards, we should expect the Ratio to drop lower and re-test the all-time lows. The idea will make the $USDX going down and YEN pairs going up. The swing lower in the Ratio will make Silver test the all-time highs. We at EWF always correlate the market and try to make sense of the correlation either in the first or second degree.

5 Waves Impulse in Elliott Wave Theory​


The graphic above reflects the classic Elliott Wave Theory pattern in which the market advances in five waves and corrects in three waves. As we can see, this pattern repeats itself. The larger ABC correction subdivides into 5-3-5, in which each leg comes in a sequence of five waves.

The decline in the Ratio from the peak in 03.2020 shows a clear five waves decline, and now it is in the process of a three waves pullback of ABC.

Gold-to-Silver Ratio Daily Elliott Wave Chart​


The chart above shows five waves down from March 2020 peak and in the process of the three waves' pullback. As we can see, the blue box area has not yet been reached, and another swing higher in the Ratio can still happen. This wing higher will make Silver trade lower. Presently, the Ratio should be in wave (4), and soon buyers will be entering the market for another leg up. Short term, this will present an opportunity to sell commodities like Silver and Gold among others.

Gold-to-Silver Ratio 4 Hour Elliott Wave Chart​


The chart above shows the 4 Hour view of the Ratio and the possible short-term path. The ratio can see $81.31-$78.50 area. The decline of the peak at 05.12.2022 comes in an ABC structure with 5-3-5 subdivision. The 05.12.2022 peak of wave (3) in the Ratio agrees with the lows in Silver as well as the peak in the US Dollar. The new lows in the Ratio should support Silver. We believe the Ratio will extend higher in the second half of the year before the seller enters the market.

Gold-to-Silver and Silver Overlay​


The chart above shows the Gold-to-Silver Ratio and Silver chart overlaid on top of each other. We have concluded that a path higher in the Ratio before turning lower will make Silver going lower first before turning higher. $94.57-$106.00 in the Ratio will create a new cycle higher in Silver and lower $USDX.

In conclusion, the Ratio has the potential to extend higher into the Blue Box area, which will make the Silver trade lower. We should see a cycle similar to one of the peaks at 03.2020 to re-test the lows and make the $USDX trade lower, and Silver higher.

Source: https://elliottwave-forecast.com/co...r-ratio-the-ratio-showing-the-path-of-silver/
 

Elliottwave-Forecast

Master Trader
Feb 17, 2017
2,426
9
84
www.elliottwave-forecast.com
Hello fellow traders. Another instrument we have traded lately is USDCAD. As our members know, we’ve been favoring the long side in USDCAD due to incomplete bullish sequences the pair is showing in the weekly cycle from the 05.30. low . In this technical blog we’re going to take a quick look at the Elliott Wave charts of USDCAD, published in members area of the website. We are going to explain the Elliott Wave Patterns and trading strategy.

USDCAD Elliott Wave 4 Hour Chart 06.08.2022​

USDCAD ended cycle from the 1.24008 low as 5 waves structure, leading diagonal. We have labeled that cycle as 1 red. Currently the doing 2 red pull back which is unfolding as Elliott Wave Zig Zag pattern. First leg of the pull back looks like 5 waves structure,then we got 3 waves bounce ((b)) and now ending another 5 waves down in ((c)) leg.
We don’t recommend selling the pair against the main bullish trend. The price has already reached extreme zone from the peak at 1.256-1.2400.Strategy is buying the dips in the mentioned zone. As the main trend is bullish we expect buyers to appear at the blue box for 3 waves bounce at least. Once bounce reaches 50 Fibs against the ((b)) black blue high, we will make long position risk free ( put SL at BE).

As our members know, Blue Boxes are no enemy areas , giving us 85% chance to get a bounce.

You can learn more about Elliott Wave Zig Zag Pattern at our Free Elliott Wave Educational Web Page.

USDCAD

USDCAD Elliott Wave 4 Hour Chart 06.11.2022​

The pair found buyers at the Blue Box area and we are getting good reaction from there. Pull back 2 red is counted completed at 1.2508 low as Elliott Wave Zig Zag pattern. The rally from the blue box already reached and exceeded 50 fibs against the ((b)) connector so,we booked partial profits and made trades risk free ( put SL at BE). Now we need to see break of May 12th peak in order to confirm next leg up is in progress.

Keep in mind that market is dynamic and presented view could have changed in the mean time. You can check most recent charts in the membership area of the site. Best instruments to trade are those having incomplete bullish or bearish swings sequences. We put them in Sequence Report and best among them are shown in the Live Trading Room

USDCAD

Elliott Wave Forecast
Source: https://elliottwave-forecast.com/trading/usdcad-elliott-wave-blue-box-area/
 

Elliottwave-Forecast

Master Trader
Feb 17, 2017
2,426
9
84
www.elliottwave-forecast.com
The Goldman Sachs Group, Inc. (GS) is an American multinational investment bank and financial services company headquartered in New York City. It offers services in investment management, securities, asset management, prime brokerage, and securities underwriting. The company invests in and arranges financing for startups, and in many cases gets additional business when the companies launch initial public offerings. Notable initial public offerings for which Goldman Sachs was the lead bookrunner include those of Twitter, Bumble, Robinhood Markets, Coupang, etc.

GS OCTOBER 2021 DAILY CHART

GS OCTOBER 2021 DAILY CHART

Last October, we were looking to complete an impulse from March 2020 low. The first wave of impulse that we called wave (1) ended at 225.24 dollars. Pullback as wave (2) ended at 185.52. Then the stock rally creating 5 swings up in lesser degree to form wave (3) completed at 393.26. Wave (4) correction finished at 348.13 and from here last rally ended at 426.16 without reaching our minimum target 444.39. GS drawn an ending diagonal structure to complete wave (5) and the impulse wave ((1)). (If you want to learn more about Elliott Wave Theory, please follow these links: Elliott Wave Education and Elliott Wave Theory).

GS FEBRUARY DAILY CHART

GS FEBRUARY DAILY CHART

From the peak, GS fell in 3 swings to end wave A at 366.65. Then 3 swings up to complete wave B at 412.66 and an impulse dropped to finish a flat correction. As we have already drawn 3 swings correction, we can perfectly continue with the rally from here. However, given the market conditions we are calling a double correction. Therefore, we are labeling 326.23 low as (W), bounce to 377.40 as wave (X). This Elliott structure needs 3 swings down more, a simple ABC, to complete it. Wave A is done already at 326.95 and currently we are developing wave B and after ending this wave we should see further bearish movement. The target to complete this correction and wave ((2)) we are considering 305.00 – 277.00 area. The view is valid as we stay below 377.40.

GS JUNE DAILY CHART


After 3 months, GS continued lower as expected, but it did not do an ABC correction. It is developing a WXY double correction as wave (Y). Down from wave (X), wave ((a)) ended at 318.49 and pullback as wave ((b)) finished at 347.04. Next drop as wave ((c)) ended at 307.87 and completed wave W. The connector rally to 50% Fibonacci retracement of wave W and wave X completed at 347.27. From this level we need 3 swings lower to finish wave Y of (Y). Wave ((a)) ended at 293.96 where we hit our target area in 305.00 - 277.00. Corrective bounce wave ((b)) as expanded flat structure completed at 329.81 and we expect one more low as wave ((c)) to complete the whole correction as wave ((2)). Currently, we are looking to drop to 277.00 - 253.30 blue box and Goldman Sachs should start a rally.

Source: https://elliottwave-forecast.com/stock-market/goldman-sachs-gs-hit-target/
 

Elliottwave-Forecast

Master Trader
Feb 17, 2017
2,426
9
84
www.elliottwave-forecast.com
Houston American Energy Corporation stock enjoyed the impulsive rally the rest of the sector had in early 2022. and has recently struck a low for the next move higher. Lets take a look at what the company does:

“Houston American Energy Corp is an oil and gas exploration and production company. Our oil and gas exploration and production activities are focused on properties in the U.S. onshore Gulf Coast Region. Principally Texas and Louisiana, and on the development of concessions in the South American country of Colombia. We seek to utilize the contacts, experience, financial acumen and expertise in oil and gas geology, engineering and production provided by our management and Board of Directors to seek out and evaluate favorable drilling opportunities.

We generally seek to form partnerships and joint ventures to spread the cost and risks to us of drilling while maximizing our potential returns. The company’s fiscal discipline and debt-free capital structure offers investors a great deal of leverage and upside potential as revenue from new projects is realized.”


This is a highly speculative energy producer, but the technicals are clean. Lets take a look at the view presented in April of 2022:

Houston American Energy Corporation Elliottwave April 2022:​

Houston American Energy Corporation

As you can see, we were favouring the next leg higher was favoured to take place. After that, the market had other intensions, and wanted one more low before resuming the rally. Lets take a look at the most up to date chart.

Houston American Energy Corporation Elliottwave June 2022:​


Medium term term view from the low set May 12/2022 @ $2.72. After that, a fairly textbook advance has taken place. A clean 5 waves up impulse from that low is clear into the recent peak. Consequently, from the June 8 peak, set @ 8.60, the instrument is now correcting the cycle from the May low. It has unfolded as an ABC structure, and currently the ((c)) of 2 is underway. There is a blue box that buyers may enter into the market for a bounce in 3 waves at least. This area is from 5.65 to 4.11. However, as long as prices remain above the May 12 low, further upside is favoured to take place.

Source: https://elliottwave-forecast.com/st...rican-energy-corp-husa-pulling-back-rallying/
 

Elliottwave-Forecast

Master Trader
Feb 17, 2017
2,426
9
84
www.elliottwave-forecast.com
Siemens SE is a German multinational conglomerate company and by revenue the largest industrial manufacturing enterprise in Europe. Company’s principal business divisions are Industry, Energy, Healthcare, Infrastructure & Cities. Founded in 1847 and headquartered in Munich, Germany, the company employs approx. 385’ooo people worldwide. Siemens is a part of both DAX40 and of SX5E indices. One can note that the economic success of the company is truly accompanied by a strong performance of the Siemens stock.

In the initial article from February 2021, we have forecasted a rally to the new highs. We were right. The new all-time highs have been printed in January 2022 at 157.96. Now, we see the stock price pulling back from the all-time highs. In the current blog, we analyze the structure of the price movement and provide the new upside targets.

Siemens Monthly Elliott Wave Analysis 06.14.2022​

The monthly chart below shows the Siemens stock $SIE traded at XETRA. From the all-time lows, the stock price has developed a cycle higher in black wave ((I)) of grand super cycle degree towards May 2001 highs at 89.75. From there, a correction lower in black wave ((II)) has unfolded as an Elliott wave expanded flat pattern. It has printed an important bottom on October 2008 at 32.07. From October 2008 lows, a new cycle in wave ((III)) has been already confirmed by breaking above 89.75 highs.

A closer look on the price action from 2008 lows unveals the development of another nest being blue wave (I) of black wave ((III)). The 2008 cycle has reached towards 133.50 on May 2017. From there, a correction has unfolded as a zigzag structure in wave (II). The consolidation has ended in March 2020 at 58.77. While above there, Siemens is already within blue wave (III). Break above the 133.50 high has confirmed that. A target for wave (III) will be 159.95-222.60 area and beyond.

Siemens Elliott Wave Monthly

Siemens Daily Elliott Wave Analysis 06.14.2022​

The daily chart below shows in more detail the first stages of the advance higher in wave (III). From the March 2020 lows at 58.77, we see the cycle in wave I of blue wave (III) and a pullback in wave II. First, the advance in red wave I is a classical umpulsive structure. Hereby, black waves ((1)), ((3)) and ((5)) of red wave I provide a clear subdivision into 5 waves of lesser degree. The cycle has ended by printing the all-time highs at 157.96 in January 2022. Then, from the highs, a pullback in wave II shows a zigzag lower. It is the preferred view, that it has ended in March 2022 at 111.38 lows. While above there, a new cycle in wave III of (III) might be in progress.

Notwithstanding the sanctions war in the world, the manufacturing giant Siemens should see the acceleration higher soon. The target for red wave III will be 205.06-266.33 area and even higher.

Siemens Elliott Wave Daily

Source: https://elliottwave-forecast.com/stock-market/siemens-acceleration-sanctions-war/
 

Elliottwave-Forecast

Master Trader
Feb 17, 2017
2,426
9
84
www.elliottwave-forecast.com
The long term fundamental background for Uranium is very promising. Shift towards green energy and less reliance on Russian's oil should support Uranium. One way to capitalize on this opportunity is with the Uranium Miners ETF (URA). The ETF invests on the Uranium itself as well as several mining companies in this sector. The monetary tightening by the Fed has created a tsunami of selloff in the market. The selloff is especially heavy in the tech and growth sector. Commodities however remain to be one of the few sectors which remain positive due to the high inflation environment. Recent pullback in Uranium may give investors an opportunity to participate in the sector.

URA Monthly Elliott Wave Chart​


Monthly Elliott Wave chart of Uranium Miners ETF (URA) above suggests that the ETF ended wave ((I)) on February 2021 peak at 134.52. and the pullback in wave ((II)) low ended at 6.95. Wave ((III)) is now in progress with internal subdivision as an impulse. Up from wave ((II)) low, wave I ended at 31.6, and wave II pullback is in progress to correct the rally from wave ((II)) low on March 2020 before the rally resumes.

URA Daily Elliott Wave Chart​


URA Daily Elliott Wave View above shows the rally from 3/1/2020 low to 31.6 ended wave I. Wave II pullback is currently in progress with internal subdivision as a double three. Down from wave I, wave ((W)) ended at 18.71 and rally in wave ((X)) ended at 28.49. Wave ((Y)) of II is now in progress to reach the 100% - 161.8% Fibonacci extension of wave ((W)) at 7.77 - 15.71 before the rally resumes again. Buyers should appear from the blue box area for further upside.

Source: https://elliottwave-forecast.com/stock-market/uranium-miners-etf-ura-support-area/
 

Elliottwave-Forecast

Master Trader
Feb 17, 2017
2,426
9
84
www.elliottwave-forecast.com
United Natural Foods Inc., (UNFI) together with its subsidiaries, distributes natural, organic, specialty, produce & conventional grocery & non-food products in the US and Canada. It operates in two segments, wholesale and retail. It is based Providence, Rhode Island, comes under Consumer Defensive sector and trades as “UNFI” ticker at NYSE.

UNFI made all time low at $3.50 in December-1999 & all time high at $83.91 in March-2015 as wave (I). It finished a larger pullback in March-2020 & made a low of $5.00 as wave (II) as zigzag correction. Currently, it favors a corrective pullback in wave II & expect to pullback lower towards $25.41- $10.42 area.

UNFI - Elliott Wave Latest Monthly View:​

It started impulse up from December-1999 low & favored ended at $83.91 high as wave (I). Later, it corrected the cycle in zigzag structure & ended it at $5.00 low as (II) correction. While above there, it against started trading higher in impulse sequence. Within (I), it placed I at $38.40 high & II at $12.83 low. While above there, it favored ended III at $79.64 high as third wave extension & placed IV at $58.04 low. Finally, it ended V at $83.91 high as (I).

Below there, it placed a red at $29.75 low, b of (II) at $52.69 high. Finally, it ended c of (II) at $5.00 as the part of zigzag correction before it resumes upside. While above (II) low, it placed wave I at $57.89 high. Currently, it favors a pullback in II & expect to extend lower in ((C)) of II towards %25.41 -$10.42 area, while bounce fails below $49.56 high of ((B)) leg. Buyers expect to enter the market within blue box area for next leg higher or at least 3 swing bounce.

Source: https://elliottwave-forecast.com/stock-market/unfi-expect-pulling-back-before-higher/
 

Elliottwave-Forecast

Master Trader
Feb 17, 2017
2,426
9
84
www.elliottwave-forecast.com
In our previous article on March 20, 2022 about Newmont Mining (NEM), we mentioned the stock can soon end 5 waves up from 2015 low and see a larger pullback. Fast forward 3 months later, the stock has started the pullback and still in the middle of it. In this update, we will look at the potential target and support for the current pullback. We will analyze it using Elliott Wave technical method. Newmont Mining (ticker: NEM) is the world's largest gold mining company, based in Greenwood Village, Colorado, United States.

Newmont Monthly Elliott Wave Chart​


Monthly Elliott Wave Chart in Newmont Mining suggests the stock has started the next bullish cycle as it broke above previous wave ((I)) high on September 1987 at 81.92. Currently wave I has ended at 86.37 as a 5 waves impulse from August 2015 low and the stock is correcting that cycle within wave II in larger degree 3, 7, or 11 swing before the rally resumes. As far as August 2015 low pivot at 15.39 remains intact, expect buyers to appear once wave II pullback is over and stock to resume higher again. See below Daily Chart for wave II possible support area.

Newmont Daily Elliott Wave Chart​


Daily Elliott Wave for Newmont Mining (NEM) above suggests wave II pullback can be unfolding as a double three ((W))-((X))-((Y)) structure. Down from wave I high, wave ((W)) ended at 63.68 and wave ((X)) rally ended at 70.16. In this structure, wave ((Y)) lower is in progress and can see further downside to reach 42.16 - 47.48 area to complete wave II. Afterwards, it should resume higher again or rally in 3 waves at least.

Source: https://elliottwave-forecast.com/stock-market/newmont-mining-nem-support-area-pullback/
 

Elliottwave-Forecast

Master Trader
Feb 17, 2017
2,426
9
84
www.elliottwave-forecast.com
Algorand is a proof-of-stake blockchain cryptocurrency protocol. Algorand's native cryptocurrency is called ALGO. It was founded in 2017 by Silvio Micali, a professor at MIT, composed of a company and a foundation. Algorand Foundation manages ecosystem growth, award funding, cryptographic research primitives, on-chain governance, and decentralization of the Algorand network, including nodes. The core development of the Algorand protocol is overseen by Algorand Inc., a private corporation based in Boston.

ALGO Daily Chart January 15th​

ALGO Daily Chart January 15th

In January of this year, the market conditions were no longer good, for this reason we expected the cryptocurrencies to fall. In the graph chart we can see ALGO. After making a sharp upward move last year, it continued to decline. From the peak we have a double correction (W), (X), (Y), and a new rally could have started. However, we forecast a triple correction given the bearish market scenario as explained above. The target for these moments we calculated in 0.88 to 0.58 area.

ALGO Daily Chart March 4th​

ALGO Daily Chart March 4th

After two months, ALGO had already reached the bounce area on January 22 falling to 80 cents. Nevertheless, as we can see on the March chart, we restructured the triple correction count (W), (X), (Y), (XX), and (Z). We now have a double correction more extended to look for further downside. The new target area in this case changed to go deeper from 46 cents to 28 cents. (If you want to learn more about Elliott Wave Theory, please follow these links: Elliott Wave Education and Elliott Wave Theory).

ALGO Daily Chart June 19th​

ALGO Daily Chart June 19th

Currently on June 19, the cryptocurrency has already reached the proposed objective again and it is around 30 cents. The time to reach these levels was longer than expected; therefore, we adjust the chart to market swings. This adjustment resulted in a triple correction where the wave (Z) is building a double correction in lower degree. To complete this structure, we need 7 swings down and we are just at the last one. The target now is 34 to 23 cents. We expect to complete an impulse in this leg and we are in wave (4), so a further low towards 0.23 could end the correction and give us the bounce that many are waiting for. However, Fibonacci has shown us that it could go as low as 6 cents. We don't want to be too bearish, but a break of 23 could take us to that level.

Source: https://elliottwave-forecast.com/forex/algorand-cryptocyrrency-algo-expect/
 

Elliottwave-Forecast

Master Trader
Feb 17, 2017
2,426
9
84
www.elliottwave-forecast.com
Blackstone Inc., (BX) is an alternative asses management firm specializing in real estate, private equity, hedge fund solutions, credit, secondary funds of funds, public debt & multi-asset class strategies. The firm typically invests in early stage companies. It is based in New York, comes under Financial services sector & trades as “BX” ticker at NYSE.

BX started impulse sequence higher from $33.00 low made on 3/18/2020 during global sell off. It made an all-time high of $149.78 on 11/19/2021 as wave I & started correcting lower against March-2020 low. It expect to trade lower towards $78.63 - $48.87 area to finish the correction before turning higher.

BX - Elliott Wave Latest Daily View :​

It placed ((1)) at $60.20 high on 6/05/2020 of the impulse sequence started from 3/18/2020 low. Later it favored ended ((2)) at $49.26 low on 9/24/2020 low as 0.382 Fibonacci retracement of previous cycle. Above there, it started third wave extension of third wave extension & placed ((3)) at $136.88 high on 9/17/2021. It ended ((4)) at $108.81 on 10/04/2021 low as slightly above 0.382 retracement. Finally, it ended ((5)) at $149.78 high on 11/19/2021 as wave I. While below there, it favors correcting lower in II in zigzag correction.

Below $149.78 high, it placed ((A)) at $101.65 low and ((B)) at $126.80 high as triangle on 4/21/2022. While below there, it favors lower in ((C)) leg towards $78.63 - $48.87 area to finish II correction before upside resumes in either new sequence up or at least 3 swing reaction higher. Currently, it appears ended (3) at $87.39 low and above there it should bounce in (4) before final leg down to finish ((C)) leg. We like to buy the dips towards blue box area for upside to resume

Source: https://elliottwave-forecast.com/stock-market/bx-correction-expect-continue-rally-resumes/
 

Elliottwave-Forecast

Master Trader
Feb 17, 2017
2,426
9
84
www.elliottwave-forecast.com
Marathon Oil Corporation ticket symbol: MRO engages in the exploration, production, and marketing of liquid hydrocarbons and natural gas. It operates through the following two segments: United States (U. S.) and International. The U. S. segment engages in oil and gas exploration, development, and production activities in the U.S. The International segment engages in oil and gas development and production across international locations primarily in Equatorial Guinea and the United Kingdom. The company was founded in 1887 and is headquartered in Houston, TX. We will look at the Elliott wave analysis below:

MRO Daily Elliott Wave Chart​

MRO Elliott Wave Analysis: Reaching Short Term Extreme Area

This is the Daily Elliott wave chart of MRO. In which the rally from the April 2020 low is unfolding in an impulse sequence favoring more upside to happen. While the rally to $14.33 high ended wave I, wave II pullback ended at $10.41 low. Then wave III ended at $33.24 high in a lesser degree 5 waves structure. Now looking to do a pullback in wave IV to correct the cycle from the August 2021 low before the upside resume.

MRO 4-Hour Elliott Wave Chart​

MRO Elliott Wave Analysis: Reaching Short Term Extreme Area

Above is the 4hr Elliott wave view showing pullback from the peak is unfolding as Elliott wave double three structure. And managed to reach the blue box area at $24.45- $20.94. From where buyers are expected to appear looking for new highs ideally or should do a 3 wave bounce at least. So at this stage of the market sellers need to be very careful because soon a minimum 3 wave reaction higher is expected to take place.

Source: https://elliottwave-forecast.com/stock-market/mro-reaching-short-term-extreme-area/
 

Elliottwave-Forecast

Master Trader
Feb 17, 2017
2,426
9
84
www.elliottwave-forecast.com
Chewy.com is an e-commerce company that specializes in pet food. Along with many other stocks, prices started a new cycle higher in March 2020. Chewy is now correcting that cycle and currently going fairly deep, and threatening to make new all time lows. Lets take a look at the company profile and see what they do:

“Chewy, Inc. is an American online retailer of pet food and other pet-related products based in Dania Beach, Florida. In 2017, Chewy was acquired by PetSmart for $3.35 billion, which was the largest ever acquisition of an e-commerce business at the time. The company completed its initial public offering in 2019, raising $1 billion.

Following the acquisition, Cohen remained CEO and operated the business largely as an independent unit of PetSmart. Between 2017 and 2018, Chewy’s sales increased from $2.1 billion to $3.5 billion, with 66% of sales coming from customers signed up for automatic recurring shipments. In 2018, Chewy created Chewy Pharmacy, an online pharmacy providing pet-targeted prescription medications. Orders placed through the business are completed in coordination with a team of in-house veterinarians.”


Lets take a look at the view I presented in Early May 2022:

Chewy Elliottwave View May 2022:​


At the time, I was still looking for more swings lower to complete the correction. This did take place, and now the stock is currently having a larger bounce. Is the correction complete? Lets take a look at the updated view from June 2022.

Chewy Elliottwave View June 2022:​


This stock made new all time highs in February 2021. After that peak, a deep correction has taken place. From the all time low @ 20.54, the stock has rallied in 5 waves and peaked in February of 2021. Medium term term view from Feb 2021 peak set @ 120.00 . The pullback since the peak over a year ago, has been a fairly clean pullback. There is a clear 5 waves down into ((A)), bounce in ((B)). As a result, the stock is declining in the final leg before a larger bounce may take place. Currently, the momentum is suggesting that blue (3) and (4) are set and as long as the 20,54 low remains intact, this instrument can still be correcting that 20.54 low.

It should be noted that there is a blue box that is present, from the 41.92 to invalidation level at 20.54. The blue boxes are areas where algos and buyers typically enter for a bounce. Prices are very close do invalidtion the bullish thesis. For now, we like to wait for some other sectors and indices like $SPY, $XLK, $XLY to reach some equal leg before buying some of these names. It can be choppy sideways to lower in the near term.

Source: https://elliottwave-forecast.com/stock-market/chewy-com-chwy-one-low-bottom/
 

Elliottwave-Forecast

Master Trader
Feb 17, 2017
2,426
9
84
www.elliottwave-forecast.com
Cotton is one of soft commodities, along with sugar, coffee, orange juice and cocoa. In early centuries, Alexander the Great has brought cotton from Pakistan to Europe. Much later and finally, it has obtained the dominance in textile manufacturing during the British industrial revolution in the 18th century. It was so critical that at times of Civil War in North America the Confederate bonds sold in Europe were backed by cotton. Today, the largest producers and, at the same time, the largest consumers of cotton are China and India. One can trade Cotton futures at ICE owned New York Board of Trade in contracts of 50’000 pounds each under the ticker CT #F. Also, there are similar contracts at CME owned NYMEX under the ticker TT #F.

Currently, we see other soft commodities like coffee and sugar turning higher after a long period of depressed prices. Based on the correlation within group of softs, the cotton is expected to turn higher as well. In particular, wave structure of CT #F supports that bullish view. Will the rally in the cotton prices make buying of the new clothes less affordable for the broad population?

In the initial article from May 2021, we have forecasted a strong initial wave higher. We were right. From March 2020 until May 2022, the cotton prices have trippled. Now, a short-term pullback provides an opportunity to join the rally. Here, we provide an update: buying area and price targets.

Cotton Quarterly Elliott Wave Analysis 06.20.2022​

The quarterly chart below shows the cotton front contract CT #F at NYBOT. Historically, cotton has been traded at New York Cotton Exchange since 1870. Later, it moved to NYBOT and the chart data shows cotton prices from 1972 on. From the lows, the prices have developed a corrective cycle higher in black wave ((w)) of a grand super cycle degree. One can see it as an Elliott Wave zigzag pattern. Hereby, blue wave (a) has demonstrated a leading diagonal structure and has ended in 3rd quarter of 1980. From there, a running triangle in wave (b) has caught the market in range bound oscillations until the 4th quarter of 2008. From there, the sideways market has resolved into an acceleration higher within an impulsive move in wave (c). Hereby, cotton has made 6x in prrice and saw the all-time highs in the 1st quarter of 2011 at 219.70.

From the all-time highs in 2011, a correction lower in wave ((x)) has unfolded as an Elliott Wave double three pattern. In 9 years, CT #F has become cheaper by 78% reaching 48.35 level. It is the preferred view that an important bottom on March 2020 has been set and the correction has ended. From the lows, a new multi-decade cycle within black wave ((y)) may have started.

For 2021-2040, the expectations are to retest if not to break above the all-time highs. The target for wave ((y)) will be 268-404 area. From current levels, the cotton should, therefore, double if not tripple in price.

Cotton Elliott Wave Quarterly

Cotton Weekly Elliott Wave Analysis 06.20.2022​

The weekly chart below shows in more detail the first stages of the new cycle within grand super cycle in black wave ((w)). From March 2020 lows, a clear impulse in red wave I has printed a top in May 2022 at 155.95. A pullback in wave II is currently in progress. Based on waves ((A)) and ((B)), wave ((C)) is trading already within 125.52-111.83 blue box area. Investors and traders can be looking to buy wave III in red from 125.52-111.83 range targeting 219-285 area and even higher.

Cotton Elliott Wave Weekly

Source: https://elliottwave-forecast.com/commodities/cotton-pullback-join-rally/
 

Elliottwave-Forecast

Master Trader
Feb 17, 2017
2,426
9
84
www.elliottwave-forecast.com
In this technical blog, we will look at the past performance of the 4hr Elliott Wave Charts of XOM. In which, the rally from the 23 March 2020 low is unfolding as an impulse and showed a higher high sequence. Therefore, we knew that the structure in XOM is incomplete to the upside for 1 more high & should see more upside. So, we advised members not to sell the stock & buy the dips in 3, 7, or 11 swings at the blue box areas. We will explain the structure & forecast below:

XOM 4 Hour Elliott Wave Chart​

XOM Elliott Wave View: Soon Longs Should Be Risk Free

Here’s the Elliott wave Chart from the 6/12/2022 update. In which, the rally to $105.60 high ended the cycle from the 19 August 2021 low in wave III & made a pullback in wave IV. The internals of that pullback unfolded as Elliott wave zigzag structure where wave (A) ended at $93.92 low. Then a bounce to $98.67 high ended wave (B) & started the next leg lower in wave (C) towards $87.07- $79.89 blue box area. From there, buyers were expected to appear looking for new highs ideally or for a 3 wave bounce minimum.

XOM Latest 4hr Elliott Wave Chart​

XOM Elliott Wave View: Soon Longs Should Be Risk Free

Above is the latest Elliott wave Chart from the 6/21/2022 update. In which the stock is showing a reaction higher taking place from the blue box area at $87.07- $79.89. Right after ending the zigzag correction within the blue box area. Allowed members to create a risk-free position with the minimum reaction higher towards 50%- 61.8% Fibonacci retracement from the wave (B) peak at $92.11- $93.66 area. However, a break above $105.60 high is still needed to confirm the next extension higher & avoid double correction lower.

Source: https://elliottwave-forecast.com/stock-market/xom-elliott-wave-soon-longs-risk-free/
 

Elliottwave-Forecast

Master Trader
Feb 17, 2017
2,426
9
84
www.elliottwave-forecast.com
Hello fellow traders. In this technical article we’re going to take a look at the Elliott Wave charts charts of BTCUSD published in members area of the website. As our members know we have had a lot of buying setups in Bitcoin during the past 2 years. However at this moment buyers should be very careful as bitcoin shows incomplete bearish sequences from the All-time high. The price structure is showing lower low sequences, suggesting we can get more downside as far as 48279.5 pivot holds. Since the price has broken 01.24 low on May 9th it confirmed bearish sequences in Bitcoin suggesting potential extension down toward 12470 area. In further text we’re going to explain the Elliott Wave forecast.

BTCUSD 4h Hour Elliott Wave Analysis 05.26.2022

Bitcoin is bearish against the 48279.5 pivot. Current view suggests that cycle from the mentioned high ended as 5 waves structure- ((A)) black, and now we are correcting it. Reaction from the low is shallow to be counted as full correction at this stage. We still expect to see another leg up (Y) of ((B)) before further decline ideally resumes.

BTCUSD

BTCUSD 4h Hour Elliott Wave Analysis 06.10.2022

Bitcoin has given us another leg up as we were expecting. Wave ((B)) recovery is counted completed at 32480. As far as the price stays below that level, we expect to see further decline toward new lows in wave ((C)). Break of ((A)) low (05/12) is needed to confirm next leg is in progress.

BTCUSD

BTCUSD 4h Hour Elliott Wave Analysis 06.21.2022

We got further decline as expected. Eventually Bitcoin has broken 05/12 low, confirming ((C)) leg is in progress. The crypto now remains bearish against the 3234.6 pivot in first degree. As of right now we are getting recovery (2) that should be ideally offer us new selling opportunities in 3,7,11 swings.

Keep in mind not every chart is trading recommendation. You can check most recent charts and new trading setups in the membership area of the site. Best instruments to trade are those having incomplete bullish or bearish swings sequences. We put them in Sequence Report and best among them are shown in the Live Trading Room.

BTCUSD

Elliott Wave Forecast
Source: https://elliottwave-forecast.com/trading/bitcoin-btcusd-bearish-sequences-decline/
 

Elliottwave-Forecast

Master Trader
Feb 17, 2017
2,426
9
84
www.elliottwave-forecast.com
We have been pretty bullish on the USDNOK throughout the year and Dollar has more strength to come to support this pair. Recently, we posted a trade idea on USDNOK that the market was correcting in a 3 or 7 swing structure and we took advantage of this. This has been a pretty successful trade so far. The best part is that we are completely risk free as I type this.

Lets have a look at a before shot​

21st June 2022 -USDNOK 1 Hour Elliott Wave Analysis​

usdnok, dollar, elliott wave


We can see that wave 2 was correcting as an Elliott wave Zigzag structure and our entry is based on wave ((c)) = ((a)) from the extreme of wave ((b)). Therefore, our entry was at 9.87 and the invalidation for the trade was at 1.618% extension at 9.75.

The above screenshot shows this trade was already triggered as it reached into the blue box zone. However, we still had projected wave (iv) and (v) to complete this 5 wave sequence into wave ((c)) of 2.

22nd June 2022 - USDNOK 1 Hour Elliott Wave Analysis​

usdnok, elliott wave, forex, dollar


So we can see here, wave (iv) and (v) did take place and it was very much deep towards 1.618% - but the trade was not stopped out. The trade has been unfolding towards a 5 wave sequence into wave ((i)) of 3.

We have now taken 50% profits off the table. We moved stop loss the same distance between the entry and 50% from wave ((b)) below the entry point. Therefore, the trade is 100% risk free.

Next step​

We are waiting for price to complete a 5 wave sequence to the upside and reach 100% extension of wave 3 against 1. But prior to that we want to see price breaking the extreme of wave 1.

Source: https://elliottwave-forecast.com/forex/usdnok-dollar-remaining-strong/
 

Elliottwave-Forecast

Master Trader
Feb 17, 2017
2,426
9
84
www.elliottwave-forecast.com
We saw a surge in the market in CHFJPY last week. First time since 2007, SNB have increased their interest rate by 50 basis points. This occurred as soon as the FED raised their interest rates. Therefore, the next step was us to wait for a 3 or a 7 swing correction. A good way to take advantage of the weak yen. As you know we are not fundamental analysts but we are aware of the world's macroeconomics. More often than not, macros are in line with our wave count.

The Opportunity We Spotted - CHFJPY 1 Hour Update - 23th June 2022​

CHFJPY


Wave 4 is unfolding in an Elliott wave zigzag structure. Also met the minimum Fibonacci Retracement requirement of wave 4 of up to 23.6%. As you can see from the above we entered into the Blue Box zone. The Blue Box zone is wave ((c)) = ((a)) at the extreme of wave ((b)).

How is it looking now? - CHFJPY 1 Hour Update - 24th June 2022​

chfjpy, elliott wave, swiss franc, japanese yen


Source: https://elliottwave-forecast.com/forex/chfjpy-taking-advantage-weakening-yen/