Temperatures Soaring - Is it time for a Coca Cola drink? In today's article, we will look at the difference between COKE and KO tickers and determine whether it's the right time to consume Coca Cola (COKE) or should we leave it in the refrigerator for now and wait for it to become Ice cold? We will also see if Christiana Ronaldo really caused a $4bn hit to the company when he asked to remove Coca Cola bottles and preferred water during his press conference back on June 15.
For those wanting to invest or trade shares of Coca Cola company, it is important to understand the difference between the two tickers. The actual production of Coca-Cola’s well known brands is done by independent bottlers and distributors; commonly known as “bottlers”. To make things confusing for anyone hoping to invest in Coca-Cola is that the bottlers stock name is nearly the same as the parent company. For clarification, here are the companies with the appropriate stock tickers:
Coca-Cola Company (KO): Parent Company Market cap: 242.292B as of August 10, 2021
Coca-Cola Consolidated (COKE): Bottling Company Market cap: 3.703B as of August 10, 2021
Coca-Cola Consolidated (COKE) is the largest independent bottler of Coca-Cola within the United States and has a market cap of 3.703B and 7.14M shares outstanding. Today, we will look at the long-term and mid-term Elliott Wave structure of COKE, the next blue box area where we can see buyers appearing and whether Ronaldo really caused a hit of $4bn to the parent company or the bottler.
Monthly chart shows data going back to 1975 or just before then. Rally from the all time low is unfolding as an Elliott Wave Impulse when wave (I) completed at $58.00, wave (II) completed at $15.00 while wave (III) completed at $413.39 and wave (IV) completed at $188.08 in March 2020. We have already seen a new all time high since then with price reaching $460 in June 2021. Expectations are that current pull back is wave ((4)) within cycle from March 2020 and should end with a new high above $460 after which we should expect a pull back in larger 3, 7 or 11 swings to correct cycle from March 2020 low at minimum. In terms of Elliott wave, we could be ending all of wave (V) and hence end cycle from all time lows but based in our correlation analysis, we doubt that would be the case and hence favoring the view of an extension within wave (V) or the more bullish path which is shown in the second chart.
COKE More Bullish Long-term Path (Monthly Chart)
This is the more bullish path which shows Super cycle wave (I) ended at $413.39 in May 2019 and wave (II) completed at $188.08 in March 2020. As per this view, we are within wave I of (III) and after cycle from March 2020 low ends, we will pull back in wave II to correct cycle from March 2020 low and start the strongest part of the rally which would be wave III of ( III).
Chart below shows cycle from March 2020 low is still alive. This low is labelled as blue (IV) on this chart or it could be blue (II) in case of more bullish path shown above. Wave ((3)) is proposed to be over at $460 and wave ((4)) pull back is proposed to be in progress and is expected to take the form of a double correction lower. As bounces fail below $434.55, price can drop as low as $353.50 - $303.39 in wave ((4)) and then it should resume the rally in wave ((5)) to end cycle from March 2020 low or produce 3 waves bounce at minimum. Even though, it's less likely but if price fails to break below July 8 low and makes a new high above $460, then new high should be treated as wave (5) of ((3)) and we would still look for a wave ((4)) pull back later on and then wave ((5)) up to end cycle from March 2020 low. We cycle is bullish, we don't favour selling and expect buyers to appear in the blue box area to resume the rally in wave ((5)) or produce 3 waves bounce at minimum.
We can also see that price did take a hit on June 15 but Ronaldos' actions just acted as a catalyst, market was already pulling back after having completed wave ((3)) at $460 and we think soon stock will reach a buying area from where it can rally to another all time high and buyers will be thanking Ronaldo for it.
Bitfarms is one of the worlds largest public bitcoin miners and has experienced an explosive move off the July 20/2021 low. Its recent listing to USA Nasdaq Exchange has only served to expose the company to more potential investors. Lets take a look at what the company does:
“Founded in 2017 Bitfarms is one of the one of the largest public bitcoin mining operations in the world. Bitfarms run vertically mining operations with onsite technical repair, data analytics and engineers to deliver high performance and uptime of operations.
Bitfarms has a diversified production platform with five industrial scale facilities located in Quebec. Each facility is 100% powered with environmentally friendly hydro power and secured with long-term power contracts.
Most recently, Bitfarms has announced it has mined 391 bitcoin in July 2021, and current mining rate is 12.5 to 13.5 BTC mined per day."
Bitfarms Elliotwave View:
Medium term term view from the all time low in October 2020. Bitfarms rallied in 5 waves before finding a peak in February 2021 at $8.50. After that, a complex multi month correction has taken place in a double zig zag pullback. This pullback ended on July 20, 2021. The July 19/20 cycle low has been a common low in many instruments, including many major tech names, and indices.
After that, the stock is acting impulsive and is still looking for further upside extension before correcting the cycle from July 20 low. What can be the upside target after Black ((2)) is set? If I extend higher for Red III, the area where the stock can reach is the 11.10 to 16.22 area. This is the equal leg 100% to 161.8% extension for Red III.
In conclusion, we do not like to chase, and prices are still currently within the middle area. It will remain in the middle until it makes new all time highs confirming the next move higher is underway. However, the depth of Red II and RSI readings suggest that the next cycle has already begun.
Source: https://elliottwave-forecast.com/stock-market/bitfarms-ltd-bitf-new-cycle-higher-commenced/
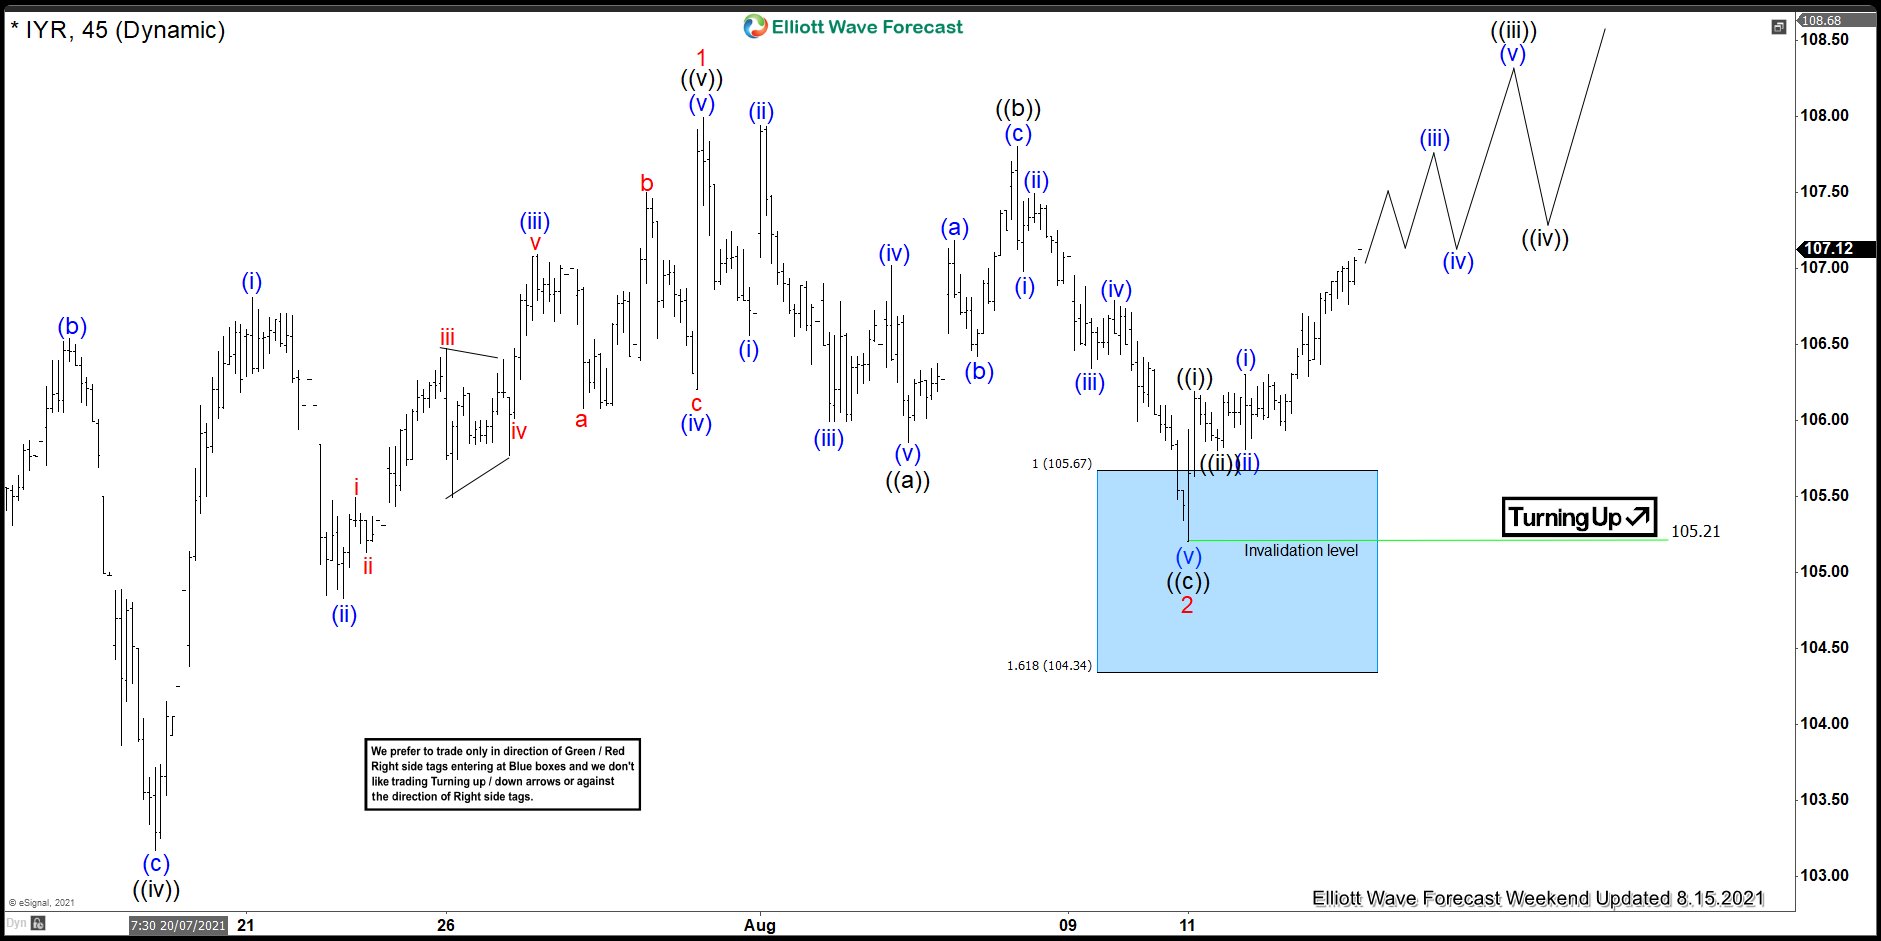
In this technical blog we’re going to take a quick look at the Elliott Wave charts of IYR ETF from the Group 3 , published in members area of the Elliottwave-Forecast. As our members know, we’ve been calling rally in the ETF due to impulsive bullish sequences within the cycle from the March 2020 low. We recommended members to avoid selling in any proposed pull back and keep on buying the dips in 3,7,11 swings. Recently IYR made pull back that has unfolded as Elliott Wave Zig Zag pattern which has given us good entries for the long side . In the further text we are going to explain the Elliott Wave Forecast and trading strategy.
IYR 1 Hour Elliott Wave Analysis 8.8.2021
IYR is doing pull back against the 103.17 low , unfolding as Elliott Wave Zig Zag Pattern. First leg (a) shows clear 5 waves, looking as leading diagonal. We assume that this was the first leg of the Zig Zag pull back that still needs to see another leg down. After Leading Diagonal in (a) we got clear 3 waves bounce in (b) blue, after which the price started turning lower again. For the ((ii)) target we use (a)-(b) equal legs, blue box. That area comes at 105.67-104.34 which is entry area for the buyers. As the main trend is bullish we expect buyers to appear for 3 waves bounce at least. Once bounce reaches 50 Fibs against the (b) blue high, we will make long position risk free ( put SL at BE). As our members know, Blue Boxes are no enemy areas , giving us 85% chance to get a bounce.
You can learn more about Elliott Wave Zig Zag Patterns at our Free Elliott Wave Educational Web Page.
IYR 1 Hour Elliott Wave Analysis 8.15.2021
Eventually IYR made another down toward blue box area 105.67-104.34 and found buyers as we expected. We got nice reaction from the blue box, which reached 50 fibs against the connector, so member who entered the long positions are risk free at this stage . 2 red pull back is counted completed at the 105.21 low , when we could be trading in 3 red now. We would like to see break above previous 1 red peak to confirm next leg up is in progress. If the price breaks 105.21 low, then new price structure will denied proposed count and pull back would be still in progress as 7 swings.
Keep in mind that market is dynamic and presented view could have changed in the mean time. Best instruments to trade are those having incomplete bullish or bearish swings sequences. We put them in Sequence Report and best among them are shown in the Live Trading Room. You can check most recent charts in the membership area of the site.
Deutsche Bank is a German multinational investment bank and financial services provider. It is one of the nine bulge bracket banks. Deutsche Bank is the largest German banking institution and is a part of the DAX index. Founded 1869 and headquartered in Frankfurt, Germany, it can be traded under tickers $DBK at Frankfurt and $DB at New York Exchange. After printing the all-time highs in May 2007 at 86.23, the stock price has lost more than 95% by March 2020. Currently, we see Deutsche Bank turning higher.
Deutsche Bank Monthly Elliott Wave Analysis 08.15.2021
The monthly chart below shows the Deutsche Bank stock $DBK traded at XETRA in Frankfurt. From the lows, the stock price has developed a cycle higher in wave ((I)) of a grand super cycle degree. It has ended at 76.87 in January 2001. From there, a correction lower in wave ((II)) has developed an expanded flat Elliott wave pattern. Hereby, expanded flats are 3-3-5 structures which do a new high in price. First, from January 2001 highs, a first leg lower has ended in 3 swings at 23.99 in March 2003. Then, second leg higher in 3 swings has printed the all-time highs at 86.23 in May 2007. Finally, the last leg lower shows an ending diagonal which is an Elliott Wave 3-3-3-3-3 structure.
Hence, Deutsche Bank may have ended correction in wave ((II)) in March 2020 at 4.45 lows. While above, a new cycle in black wave ((III)) is in the first stages and should reach towards the new all-time highs. The target for wave ((III)) will be 81.41-128.93 area and even higher.
Deutsche Bank Daily Elliott Wave Analysis 08.15.2021
The daily chart below shows the advance higher in black wave ((1)) of red wave I from the March 2020 lows. Within it, subwaves (1)-(4) have ended. Currently, wave (5) is in progress. Once over, a correction within wave ((2)) should take place. It is expected to find support in 3, 7, 11 swings above 4.45 lows. Investors and traders can be looking to buy the wave ((2)) pullback for a rally in wave ((3)).
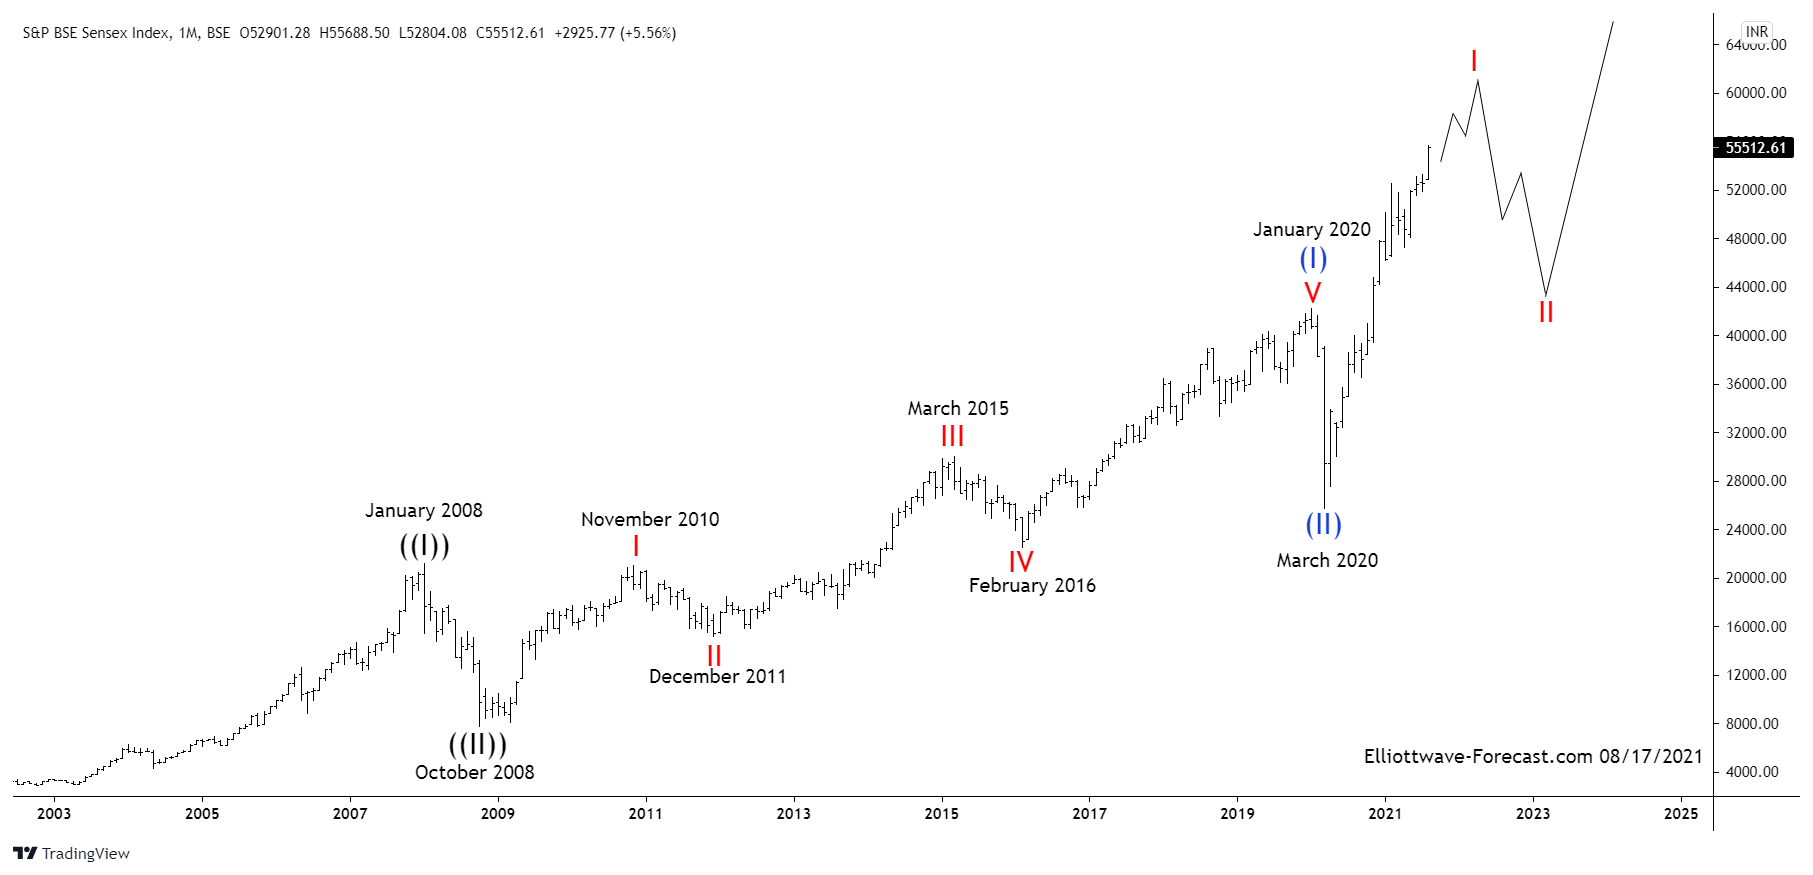
S&P BSE Sensex Index Long Term Elliott Wave & Bullish Cycles
The Sensex Index has been trending higher with other world indices. Firstly in it’s base year 1978 to 1979 the index’s point value was set at 100. From there it rallied with other world indices trending higher into the January 2008 highs. It then corrected the bullish cycle as did most other world indices. Furthermore it ended that larger degree correction in October 2008. From those 2008 lows, the index shows a bullish sequence that favors further upside.
Secondly there was a less bullish alternative Elliott Wave count that had a target extension at 46844. This is where a larger black ((I)) could have ended. However price has since went way past there invalidating the thought putting it more in line with other world indices. In this case the Fibonacci extension is measured is as follows. Take a Fibonacci extension tool on a charting platform. Point 1 will be at zero a hypothetical beginning. Point 2 is at the January 2008 cycle high. From there on up to the March 2020 lows will be the point 3. This gives a Fibonacci extension area fifth wave target where the fifth wave would be equal to the wave one where a larger ((I)) could have ended.
As price exceeded the area suggested in that view the momentum indicators also began suggesting this is a huge bullish nested series of wave one’s and two’s. The preferred analysis continues below the chart.
Sensex Index Monthly Chart
In conclusion the currently favored view in the Sensex index is as shown. It’s showing a nested Elliott Wave bullish cycle. It is in a larger wave ((III)) higher. From the 2008 lows there is a clear five waves up into the January 2020 highs as subdivided on the chart. The pullback in wave (II) into the March 2020 lows was very fast in time however while price is above the March 2020 lows the index should trade higher.
In this technical blog, we will look at the past performance of 4 hour Elliott Wave Charts of Bank of America stock ticker symbol: $BAC. In which, the rally from 23 March 2020 low unfolded as an impulse structure with an extended wave three. Therefore, we knew that the structure in BAC is incomplete to the upside & another push higher should happen to complete the 5 wave advance from March 2020 low. So, we advised members not to sell the stock & buy the dips in 3, 7, or 11 swings at the blue box areas. We will explain the structure & forecast below:
BAC 4 Hour Elliott Wave Chart
Here's 4hr Elliott wave Chart from the 7/18/2021 Weekend update. In which, the cycle from 24 September 2020 low ended in 5 waves structure at $43.50 high & made a pullback lower. The internals of that pullback unfolded as Elliott wave double three structure where wave (W) ended in 3 swings at $38.49 low. Then a bounce to $42 high ended wave (X) & started the next leg lower in wave (Y) with a lesser degree zigzag structure towards $36.98- $33.87 blue box area. From where buyers were expected to appear looking for new highs ideally or for a 3 wave bounce minimum.
BAC Latest 4 Hour Elliott Wave Chart
This is the latest 4hr Elliott wave Chart from the 8/17/2021 update. In which the stock is showing a strong reaction higher taking place from the blue box area at $36.98- $33.87. Right after ending the double three corrections within the blue box area. Allowed members to create a risk-free position shortly after taking the long positions at the blue box area.
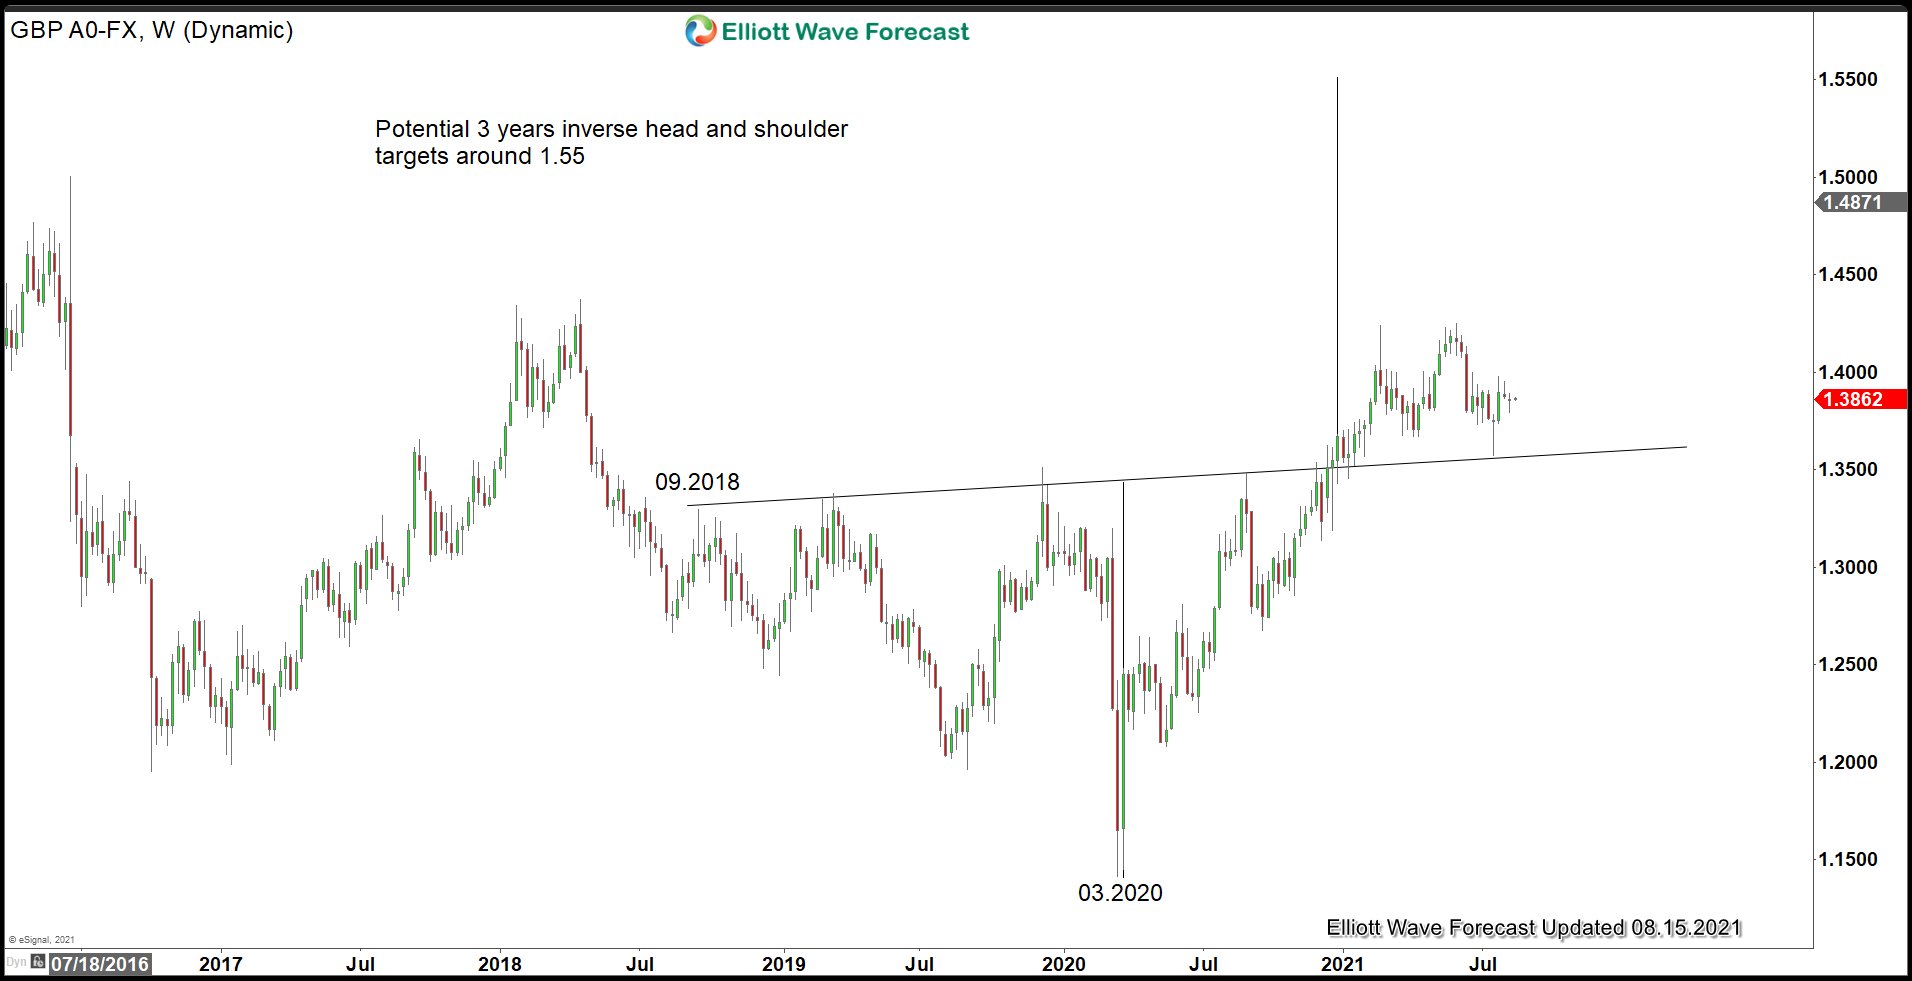
In the last Bank of England's meeting, the central gave a signal for a potential interest rate hike in 2022. This would put it ahead of a number of other G10 central banks, including RBA, U.S Fed, BOJ, and ECB. The hawkish outlook by the central bank could potentially provide underlying support for Pound Sterling.
GBPUSD Potential Weekly Inverse Head and Shoulder
GBPUSD weekly chart above shows a potential 3 years inverse head and shoulder pattern. Pair has broken above the neckline of the inverse head and shoulder. Measuring the distance between the head and neckline, then projecting it from the point of the breakout yields a target towards 1.55.
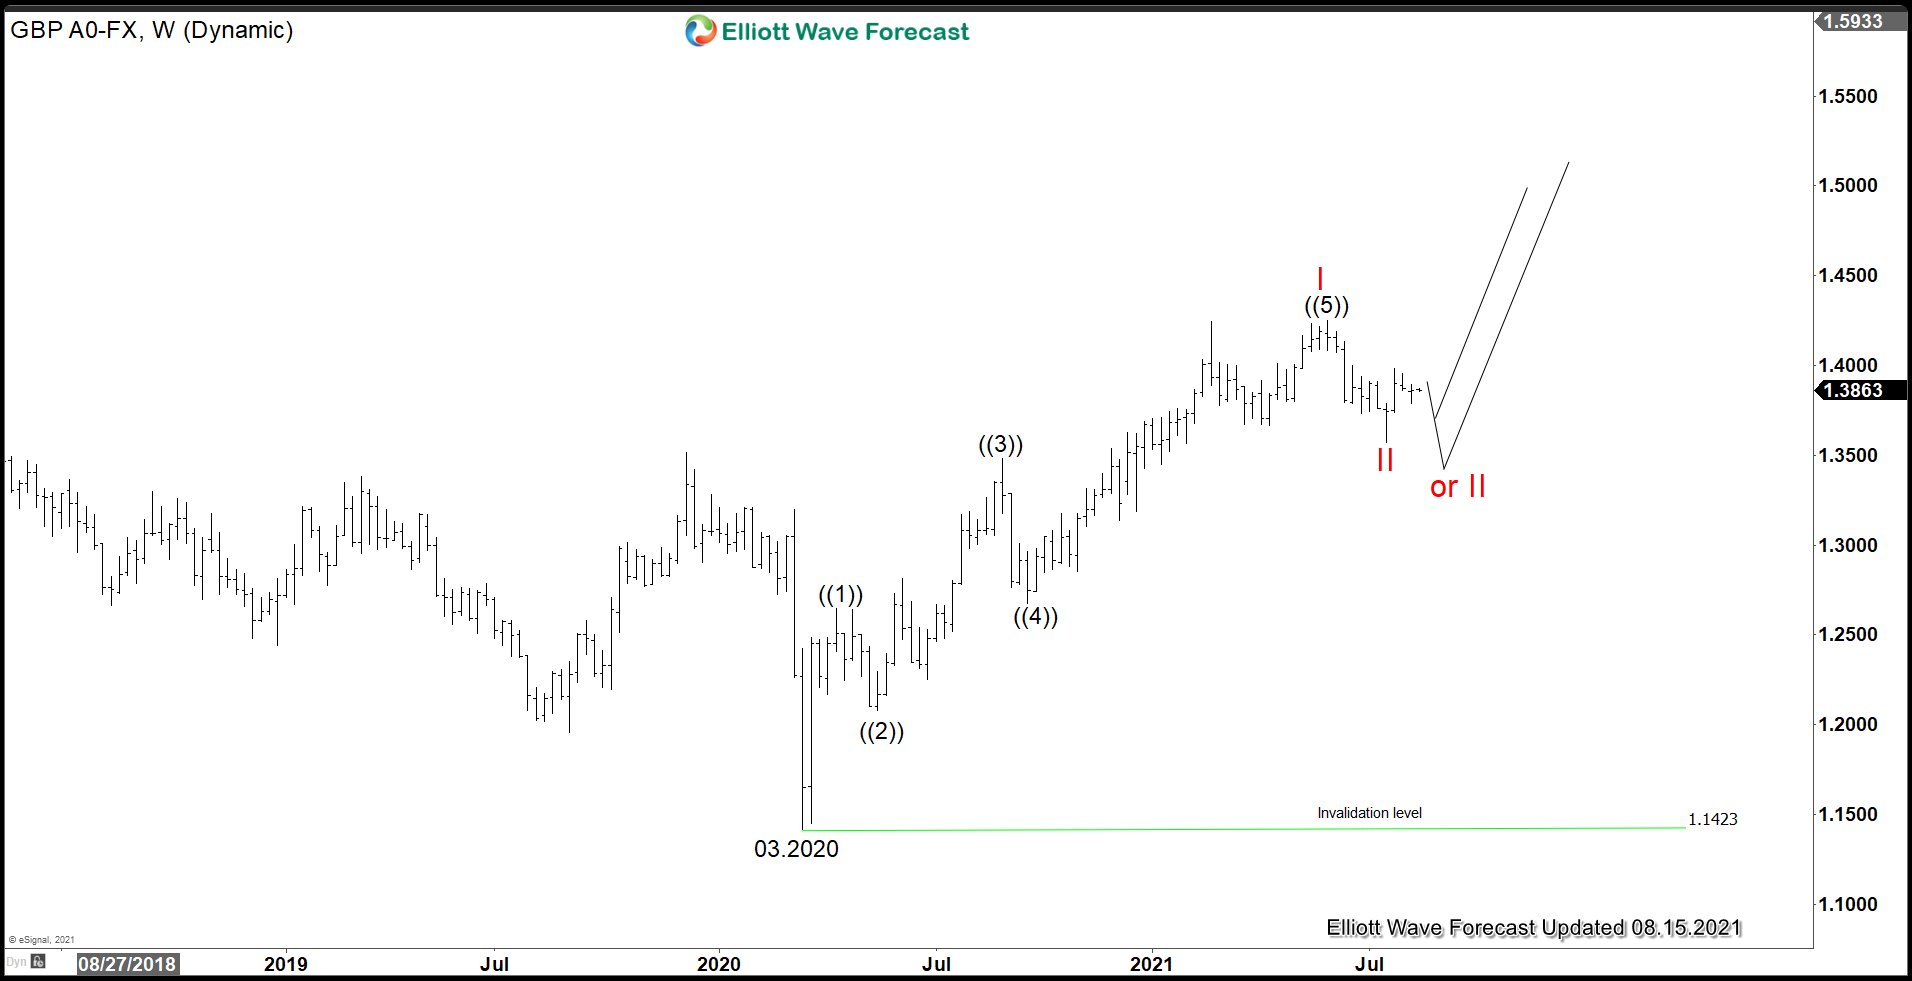
GBPUSD Weekly Elliott Wave View
Weekly Elliott Wave chart of GBPUSD above shows the rally from March 2020 low unfolded as a 5 waves impulse Elliott Wave structure. Up from March 2020 low, wave ((1)) ended at 1.2648 and pullback in wave ((2)) ended at 1.2077. Pair extended higher again in wave ((3)) towards 1.3483. Dips in wave ((4)) ended at 1.2676. Final leg higher wave ((5)) ended at 1.4251. This completed wave I in higher degree. Wave II pullback has either ended at 1.3572, or else it can do a double correction with next potential support at 1.2861 - 1.3288 area for further upside or 3 waves rally at least.
Hello fellow traders. In this technical blog we’re going to talk about Microsoft $MSFT stock and take a look at the charts presented in members area of the Elliottwave-Forecast. As our members know, Microsoft is showing incomplete bullish sequences , calling the further rally. The stock is bullish against the 268.66 low. Consequently, we advised our members to avoid selling the Stock, favoring the long side. Recently the pair has found buyers after completing Elliott Wave Expanded Flat Pattern. In further text we’re going to explain the forecast and Elliott Wave Pattern.
Before we take a look at the real market example of Regular Flat, let’s explain the pattern in a few words. Elliott Wave Regular Flat is a 3 wave corrective pattern which could often be seen in the market nowadays. Inner subdivision is labeled as A,B,C , with inner 3,3,5 structure. Waves A and B have forms of corrective structures like zigzag, flat, double three or triple three. Third wave C is always 5 waves structure, either motive impulse or ending diagonal pattern. Wave B is usually very deep, but ends below starting point of A. You can learn more about Elliott Wave Flats and other Patterns at our Free Elliott Wave Educational Web Page.
At the graphic below, we can see what Expanded Flat structure looks like.
Now, let’s take a look at real market example and see what that pattern looks like.
Microsoft 1 Hour Elliott Wave Analysis 08.19.2021
Microsoft is doing 4 red correction that is unfolding as Elliott Wave Flat pattern. We got 3 waves down in ((a)) leg ,then 3 waves bounce in ((b)) and now doing final ((c)) leg. Wave 4 red pull back still looks incomplete at the moment. We expect to see another marginal push lower to complete 5 waves down in ((c)) leg. The stock remains bullish against the 08.19 low.We don't recommend selling it in any pull back and expect further rally to continue once 4 red correction ends.
Microsoft 1 Hour Elliott Wave Analysis 08.19.2021
The stock made another short term low as we expected. As far as the price stays above 287.25 low, we believe 4 red pull back is completed there as Elliott Wave Flat. Now we need to see further separation higher, and break above August 16th peak to confirm next leg up is in progress.
Microsoft 1 Hour Elliott Wave Analysis 08.19.2021
The stock held above 287.25 low and resume trading higher. Eventually we got break above previous 3 red peak - August 16th, confirming next leg higher is in progress. Microsoft now remains bullish against the 287.25 low in first degree. We expect it to keep finding buyers in 3,7,11 swings as far as the mentioned pivot holds.
Keep in mind that market is dynamic and presented view could have changed in the mean time. Best instruments to trade are those having incomplete bullish or bearish swings sequences. We put them in Sequence Report and best among them are shown in the Live Trading Room. You can check most recent charts in the membership area of the site.
TecDAX is a stock index which tracks the performance of 30 largest German companies from the technology sector. Even though these enterprises are of a high economic importance, their market capitalization and the book order turnover are far below of that of the DAX index. The TecDAX is related to DAX in a similar way like NASDAQ is related to Dow Jones Industrial Average index.
From technical perspective, NASDAQ has been the strongest index in the US. As a matter of fact, it has provided high rewards for those traders who were buying the dips for more upside. One of the features of the market behavior is that weak indices remain weak and strong indices remain strong. The fact that NASDAQ has been outpacing other US indices makes it a good candidate to buy it again once the indices turn higher again. Similar strong uptrend can be also seen in a behavior of TecDAX. This index, therefore, allows entering the German technology sector by providing investors and traders with high returns and protecting them, at the same time, from the defaults originating from trading of single stocks.
Last year, we have presented in the initial article an expectation for more upside in the TecDAX. We were right, the rally has happened as anticipated. Here, we will present an update.
TecDAX Monthly Elliott Wave Analysis 08.23.2021
The monthly chart below shows the TecDAX index $TDXP listed at Frankfurt Stock Exchange. From the all-time lows, the index price has developed a cycle higher in wave (I) of a super cycle degree. It has ended in November 2007 at 1060.35. From there, a correction lower in wave (II) has retraced part of the rise by printing a bottom in March 2009 at 387.50.
In 2013, TecDAX was able to make a higher high opening up a bullish sequence. As a matter of fact, it has extended from March 2009 lows far beyond 1.618. Therefore, the cycle higher is an impulse in blue wave (III). It has reached 3051.44 highs in September 2018. From the top, a correction lower has unfolded as an expanded flat which has found its bottom in March 2020 at 2127.05. From march 2020 lows, a cycle higher in blue wave (V) has started and might be already in the final stages.
Once wave (V) of the cycle in black wave ((I)) will end, a correction in wave ((II)) against the all-time lows should follow.
TecDAX Daily Elliott Wave Analysis 08.23.2021
The daily chart below shows in more detail the $TDXP price action from the March 2020 lows. The advance is an impulse in blue wave (V) which might be in the final stages. Red waves I-IV of a cycle degree have ended. Currently, red wave V is unfolding as a thrust out of a triangle in wave IV. On its own, red wave V looks like it is missing one swing more to the upside. Then, a larger correction can take place.
In a larger picture, TecDAX demonstrates enough number swings and can be correcting lower very soon. Hence, it is dangerous to buy the technology index from Germany at current levels. A consolidation move in wave ((II)) will provide another opportunity though. Investors and traders can, therefore, be looking to buy TecDAX in a pullback in 3, 7 or 11 swings into a larger wave ((III)) higher.
Kering is a French multinational luxury goods company. Headquartered in Paris, Kering was founded 1963 as Pinault S.A. The company controls and manages 3 prestigious brands: Gucci, Yves Saint Laurent and Bottega Veneta. Kering is a part of CAC40 index. Investors can trade it under the ticker $KER at Euronext Paris.
Kering Monthly Elliott Wave Analysis 08.23.2021
The monthly chart below shows the Kering stock $KER listed at Euronext. From the all-time lows, first, the stock price has developed a cycle higher in wave (I) of a super cycle degree. It has ended in January 2000 at 268.00. From the top, a correction lower in wave (II) has unfolded as an Elliott Wave zigzag pattern. It has printed a bottom in November 2008 at 31.06.
From the 2008 lows, Kering has broken to new highs and is still within a strong rally. This rise shows an extension of more than 2.618 multiples in relation to the length of the wave (I). Without any doubt, one can qualify the cycle higher as the blue wave (III). From 2008 lows, it shows 5 waves higher of cycle degree. Currently, the red wave V is extending higher and should still see more upside in the coming months. Then, expect the blue wave (III) to end and a pullback in blue wave (IV) to happen. Investors and traders can be looking to buy wave (IV) in 3, 7 or 11 swings against 31.06 lows expecting more upside in blue wave (V).
Since the crash of March 2020, all stocks have tried to recover what they lost and JNJ was no exception. Johnson & Johnson did not only recover the lost, but it also reached historic highs. In those days, we were looking as a first entry in 155.33 – 156.93 area to reach a target above $176 and a few days ago we achieved the minimum target at $178.97.
JNJ April Daily Chart
In April old chart, we can clearly see that after the fall of March 2020, JNJ had a strong and rapid recovery in 3 swings. The wave ((3)) had its highest point at 173.69 where market rejected. This rejection did another double correction structure and overlaps the wave ((1)) zone to end the wave ((4)) and from here it should continue higher to complete wave ((5)) as a diagonal. (If you want to learn more about Elliott Wave Theory, please follow this link: Elliott Wave Theory).
JNJ July Daily Chart
The share price continued to rise until reaching 172.79, we call wave (1) and you can see the structure is a Leading Diagonal (LD). Besides in April, wave 2 in red drop to our minimum entry at 156.93 and bounce to complete the LD. From there, we have a clear correction as a zig zag wave (2) missing our ideal second entry for a few cents and the possible target to complete wave ((5)) came in 178.97 – 187.48 area.
JNJ Daily Chart
We are calling wave (3) of ((5)) at 179.92. That means our 178.97 minimun target was achieved from 156.93 give us a 14.04% return. Actually, we are expecting a pullback as wave (4) and then a last push above 179.92 to complete wave (5) and also the wave ((5)) of the big ending diagonal. This is the principal view and we need a little more run of the market to determinate some new alternatives that could happen with JNJ from here.
In this technical blog, we will look at the past performance of 4 hour Elliott Wave Charts of EURNZD, which we presented to members at the elliottwave-forecast. In which, the pullback from 18 June 2021 high unfolded as a double three structure & showed a blue box area. A green right side tag suggested buying opportunity in the pair looking for the next leg higher or for a 3 wave bounce at least. We will explain the structure & forecast below:
EURNZD 4 Hour Elliott Wave Chart
Here's 4hr Elliott wave chart of EURNZD from the 8/11/2021 update. In which, the pullback from 6/18/2021 high unfolded as Elliott wave double three structure where wave W ended at 1.6691 low. Wave X bounce ended at 1.7101 high and wave Y managed to reach the blue box area at 1.6657- 1.6553. From where buyers were expected to appear looking for more upside or for a 3 wave bounce at least.
EURNZD Latest 4 Hour Elliott Wave Chart
Here’s the 4hr Elliott wave chart of EURNZD from the 8/23/2021 update. The pair is showing a strong reaction higher taking place from the blue box area after ending the double three correction at a 1.6637 low. Allowed members to create a risk-free position shortly after taking the long positions at the blue box area.
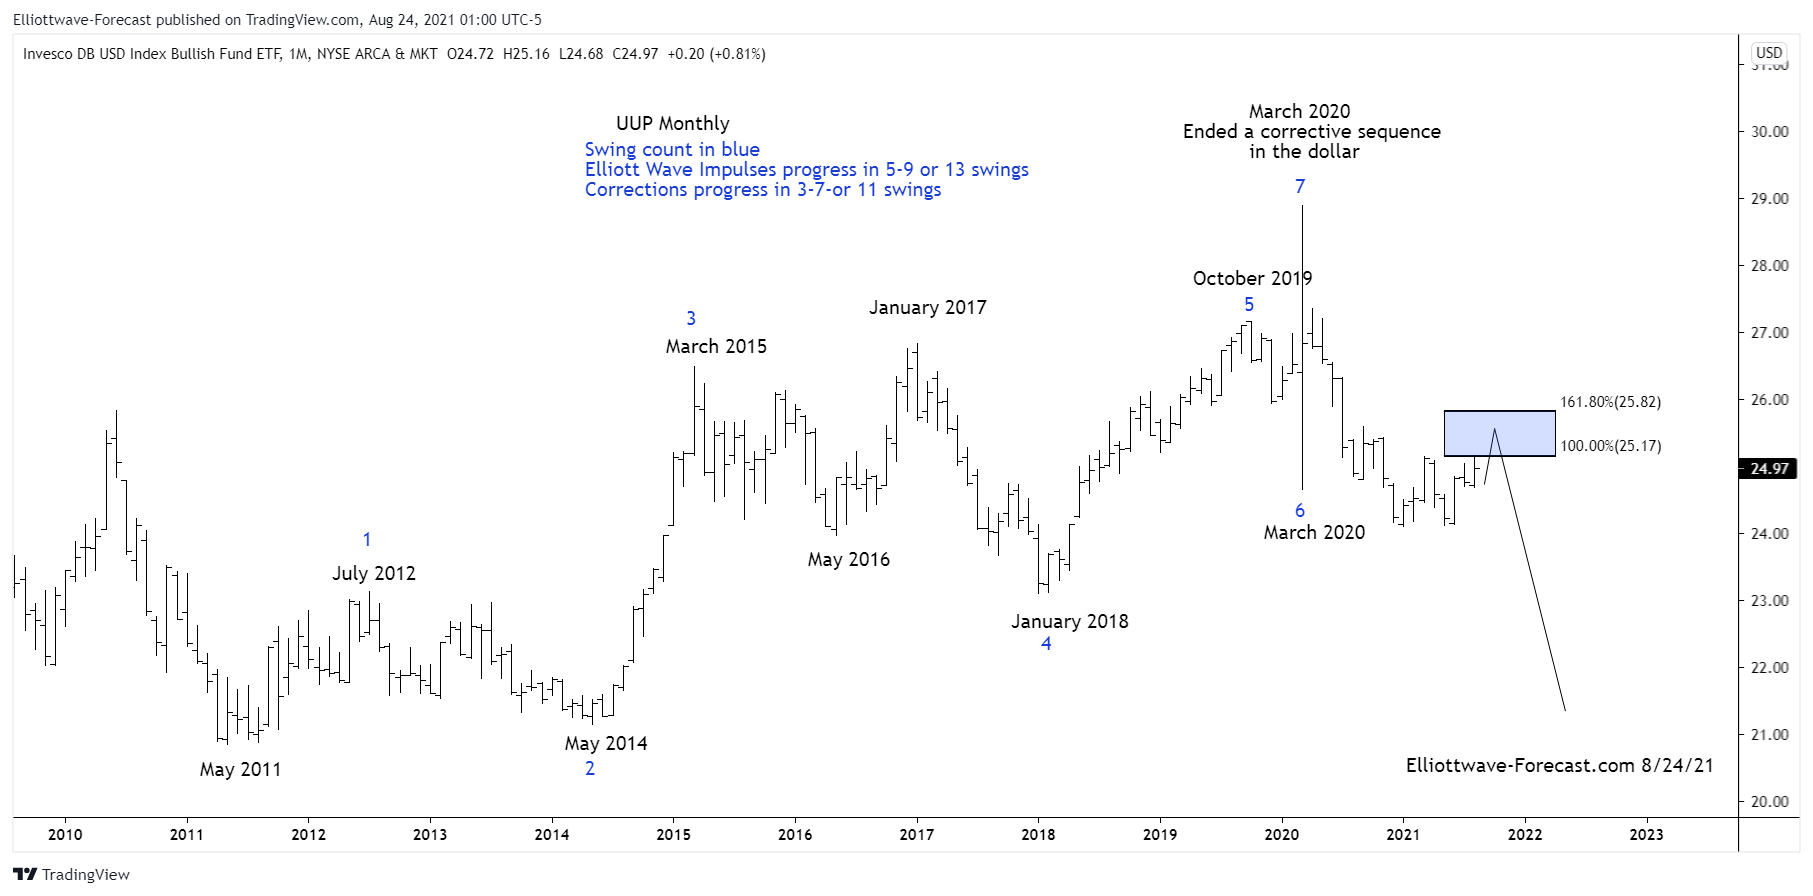
Firstly the dollar tracking ETF fund UUP inception date was 2/20/2007. Interestingly the dollar index has a low in March 2008. The UUP ETF fund shows a low in May 2011. The dollar index did make a pullback cycle low in May 2011 however it was well above the March 2008 lows. The cycle up from the May 2011 lows in UUP is the focus of this analysis where it begins on the monthly chart. It should see some further downside relatively soon before any more larger bounces higher in the longer term cycles.
The analysis continues below the $UUP monthly chart.
Secondly the cycle up from the May 2011 lows in UUP appears to have advanced higher with some overlap in the cycles. From the May 2011 lows the dollar instrument appears to have 7 swings in place to the March 2020 highs. This cycle from the May 2011 lows to the March 2020 highs is a corrective sequence.
Thirdly and in conclusion. The bearish corrective sequence plus the decline from the March 2020 highs suggests further downside in the dollar for some time to come. March 2020 saw some fast 6th & 7th swings. The best reading of the cycles suggest the decline from there in to the January 2021 lows was an impulsive five waves of larger degree. The price decline to the January 2021 lows also caused our trend system pivot to give up. This suggests the cycle from May 2011 was over. In this case that would be the fourth swing low from January 2018. After a little near term weakness the dollar can see another high in the blue box extension area before resuming a larger downtrend.
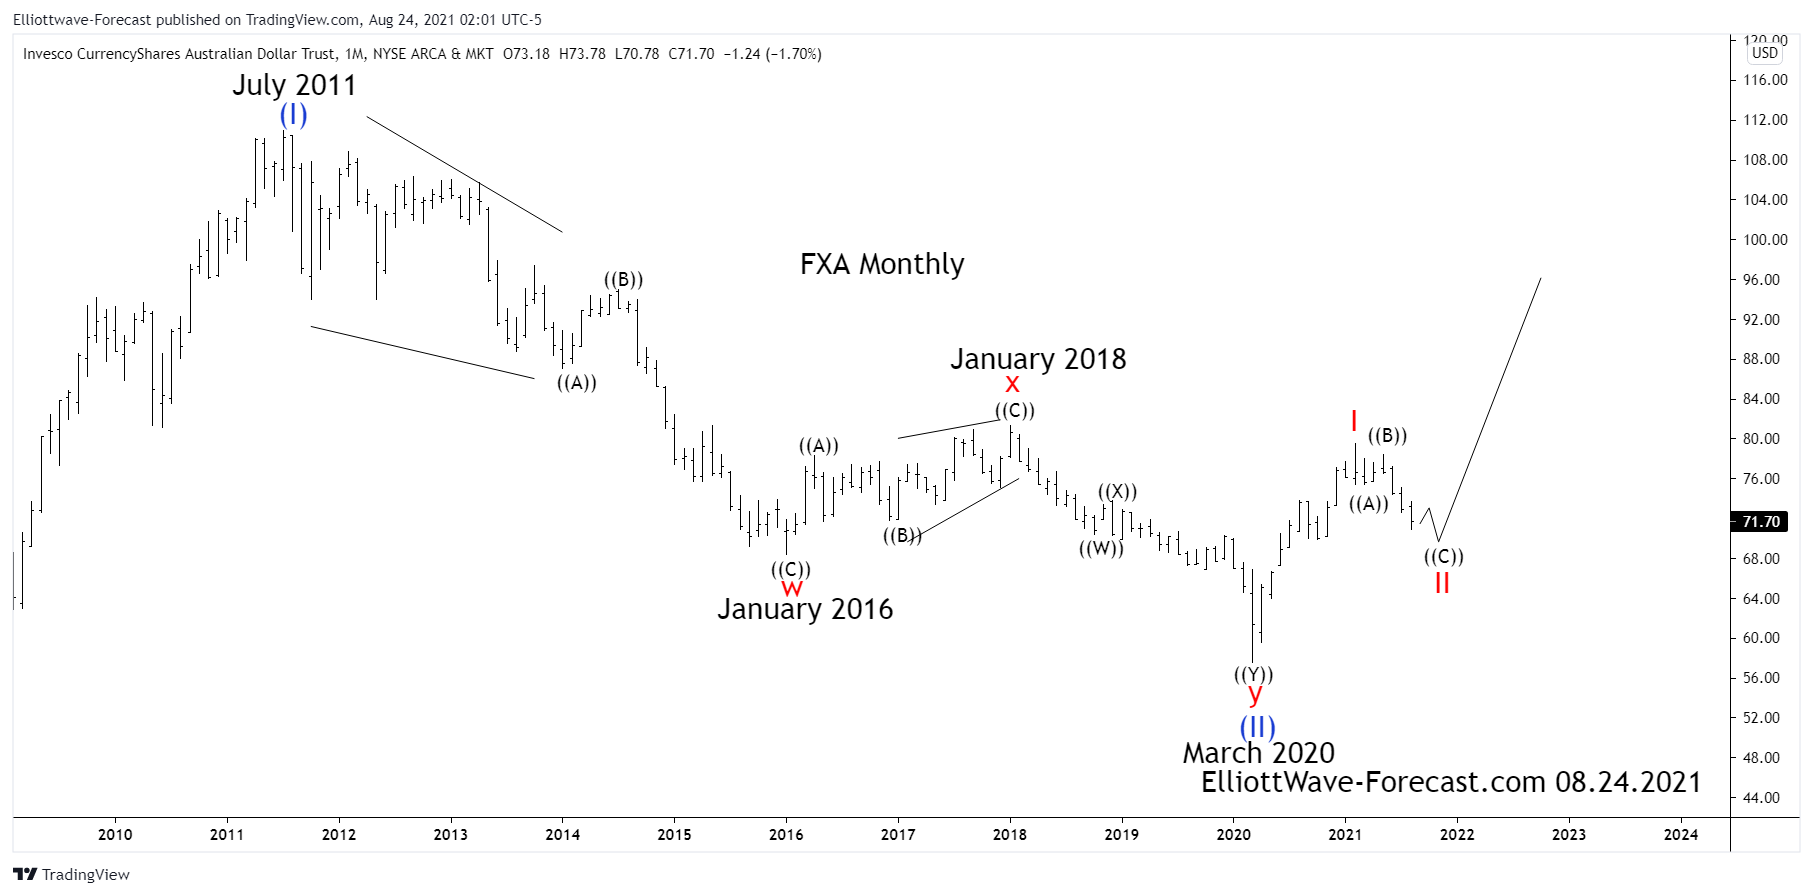
The FXA ETF fund is the Australian dollar tracking fund that has an inception Date of 06/21/2006. With that said the fund mainly reflects the currency spot price of the AUDUSD forex pair. The data available from the Reserve Bank of Australia at their website suggests the spot price was 1.4875 back in 1973 to 1974 translates into an FXA price of around 148.75. The cycle analysis suggests a larger pullback cycle ended in March 2020.
Back before the FXA fund inception date, the AUDUSD spot currency price reached what is still the currency low in April 2001 at .4778. From there the currency pair went up in what appears to be a lead diagonal until July 2011 at a high of 1.1080. That translates into the FXA ETF fund price high of 110.99 in July 2011. This is where the monthly Elliott wave analysis begins on the chart below.
The analysis continues below the monthly chart.
Secondly the decline from the aforementioned July 2011 highs does not seem legitimately able to count the whole cycle from there down to the January 2016 lows as a regular impulse by itself as a whole. The cycle lower in the red wave w has been subdivided as an ((A))-((B))-((C)) in black. The instrument has since then bounced in three swings. Further, this appeared to be a zig zag Elliott wave x in red that ended in January 2018.
Thirdly and in conclusion, since the wave x highs from January 2018 the instrument has declined in another Elliott Wave double three structure into the March 2020 lows. There it appears ended a larger pullback cycle. Lastly, from there it now appears the pair can soon finish correcting the cycle up from the March 2020 lows. While the pullback remains above there it should trend higher again.
Despite the new all-time high in S&P 500 (SPX), the potential tapering by the Fed may cap the strength in US Indices. The Fed's chair Jerome Powell will speak this Friday at the annual gathering in Jackson Hole. He is expected to reveal details on how and when the Fed will start to taper its bond buying program. Mr. Powell has indicated last time that the Fed has started to internally discuss tapering. However, the Fed still lacks the specifics on the time and scale. The situation is further complicated with the current rise in Delta variant. It's likely that the Fed will not announce a taper at Jackson Hole. More likely is for the Fed to announce a taper in November or December at a gradual pace.
If the Fed sounds ambiguous about the time and scale, it could support to the Indices. On the other hand, if The Fed surprises the market by announcing a taper or dropping a clear hint on the pathway, the strength in Indices may prove temporary.
SPX Daily Elliott Wave Chart
S&P 500 (SPX) shows two bullish cycles from March 2020 low and September 24, 2020 low. The cycle from September 24, 2020 low is quite mature and should end as 5 waves impulse with a few more highs. Near term, there is an incomplete bullish sequence from July 19, 2021 low. The Index likely sees 2 more highs before ending cycle from July 19, 2021 and at the same time September 24, 2020 low. Once cycle from September 24, 2020 low ends, the Index should see larger pullback in 3, 7, or 11 swing in wave 4 to correct this cycle. There's a likelihood that the pullback in wave 4 happens on the third / fourth quarter of this year due to the potential threat of tapering. Thus, the new high in US Indices is just as an extension within an almost 1 year old cycle.
Every once and awhile a new stock gets the mass attention of retail traders and causes an extreme impulsive move. Support.com is one of those names right in the middle of a breakout. When I talk about the heart of a wave 3, it is the wave when most traders are chasing the stock. Lets take a look at what the company does:
"Support.com, Inc. is a technical support company for businesses and consumers. It is headquartered in Wilmington, Delaware with administrative office in Sunnyvale, California. The company's services are performed on Windows, macOS, iOS, and Android, supporting connected and smart devices. These services are performed by the company's remote, full-time workforce based mainly in the U.S.
Support.com owns SUPERAntiSpyware, headquartered in Eugene, Oregon, which offers anti-malware software. The company also owns RightHand IT, headquartered in Louisville, Colorado, which provides managed IT services for small businesses."
Lets dig into the charts!
Support.com Elliottwave View:
Medium term term view from the all time low in May 19/2021 low. The stock pulled back in a wave ((2)) correction after an impulse off the March 2020 low. After setting a low at 2.32 May 19, Support.com again rallied in 5 waves to form a nest in blue (1) and (2). After (2) set on August 17 the stock really started to take off in a wave 3 of 3. It is important to understand the psychology of the wave 3 of 3 advance. This is the wave when most traders throw caution to the wind, and start chasing the price action. As a result, causes the wave 3 advance that can be known as the heart of the wave 3. It is when there is no fighting between buyers and sellers, it is when buyers have clear control of the price action.
Lets take a look at the RSI and see what it is telling us about how the momentum is acting.
As you can see, the RSI has recently exceeded the high from 8/13 peak, this confirms the wave (3) advance. The next stage would be for RSI to exceed the peak from the 3/22 high. I favour this to take place within the next few days. Before peaking, the stock should exhibit signs of momentum divergence before correcting the cycle from 5/19 low. As always we do not like to chase, we only like to look for opportunity in 3, 7 or 11 swing at blue box extreme areas.
Firstly as seen on the monthly chart shown below the instrument made a high in April 2008. There is data back to December 2005 in the ETF fund. Data correlated in the EURUSD foreign exchange pair suggests the high in April 2008 was the end of a cycle up from the all time lows. EURUSD data shows the pair had a five wave up move from the early 1970’s era. This data is derived from the German Mark currency against the US Dollar that preceded the inception of the Euro currency.
As you can see the FXE instrument reflects the price swings of the single currency well. As previously mentioned the instrument made a high in April 2008. This where the analysis begins on the monthly chart shown below. The correction from those highs appears to be a an Elliott Wave zig zag structure correction. The analysis continues below the monthly chart.
Secondly as mentioned the decline from the April 2008 highs appears to be an Elliott Wave zig zag structure. This structure is also called a 5-3-5 in Elliott Wave terms. When a cycle ends against a trend it will show up in momentum indicators usually before price makes it obvious. Further these cycle lows and highs are in the blue color as shown on the chart above (a)-(b)-(c). This finished ((b)) in January 2017.
In this technical blog, we will look at the past performance of 1 hour Elliott Wave Charts of Nike ticker symbol: $NKE. In which, the rally from 25 March 2021 low is unfolding as an impulse structure. And showing an incomplete structure to the upside favoring more extension to take place. Therefore, we advised members not to sell the stock & buy the dips in 3, 7, or 11 swings at the blue box areas. We will explain the structure & forecast below:
Nike 1 Hour Elliott Wave Chart
Here's the 1hr Elliott wave chart from the 8/15/2021 Weekend update. In which, the cycle from 20 April 2021 low ended wave (3) in a 5 wave structure at $174.38 high. Down from there, the stock made a pullback in wave (4) & was expected to take a form of an Elliott wave zigzag structure before it gets ready for the next extension higher. Therefore, our strategy remained to buy the dip towards the end of the correction looking for the next extension higher or for a 3 wave bounce minimum.
Nike 1 Hour Elliott Wave Chart
Above is the 1hr Elliott Wave Chart from the 8/24/2021 Pre-Market update. In which the stock failed lower in wave (4) pullback & managed to reach the blue box area. While the internals of the pullback unfolded as Elliott wave zigzag structure where wave A ended at $168.78 low. Wave B bounce ended at $172.40 high and wave C ended at $164.34 after reaching the blue box area. Thus offered members a short-term buying opportunity. Up from there, the stock already made a bounce higher & reached the 50% Fibonacci retracement of the decline from the peak at $169.35 level. Allowed longs to get into a risk-free position. However, a break above $174.38 high remains to be seen to confirm the next extension higher & avoid double correction lower.
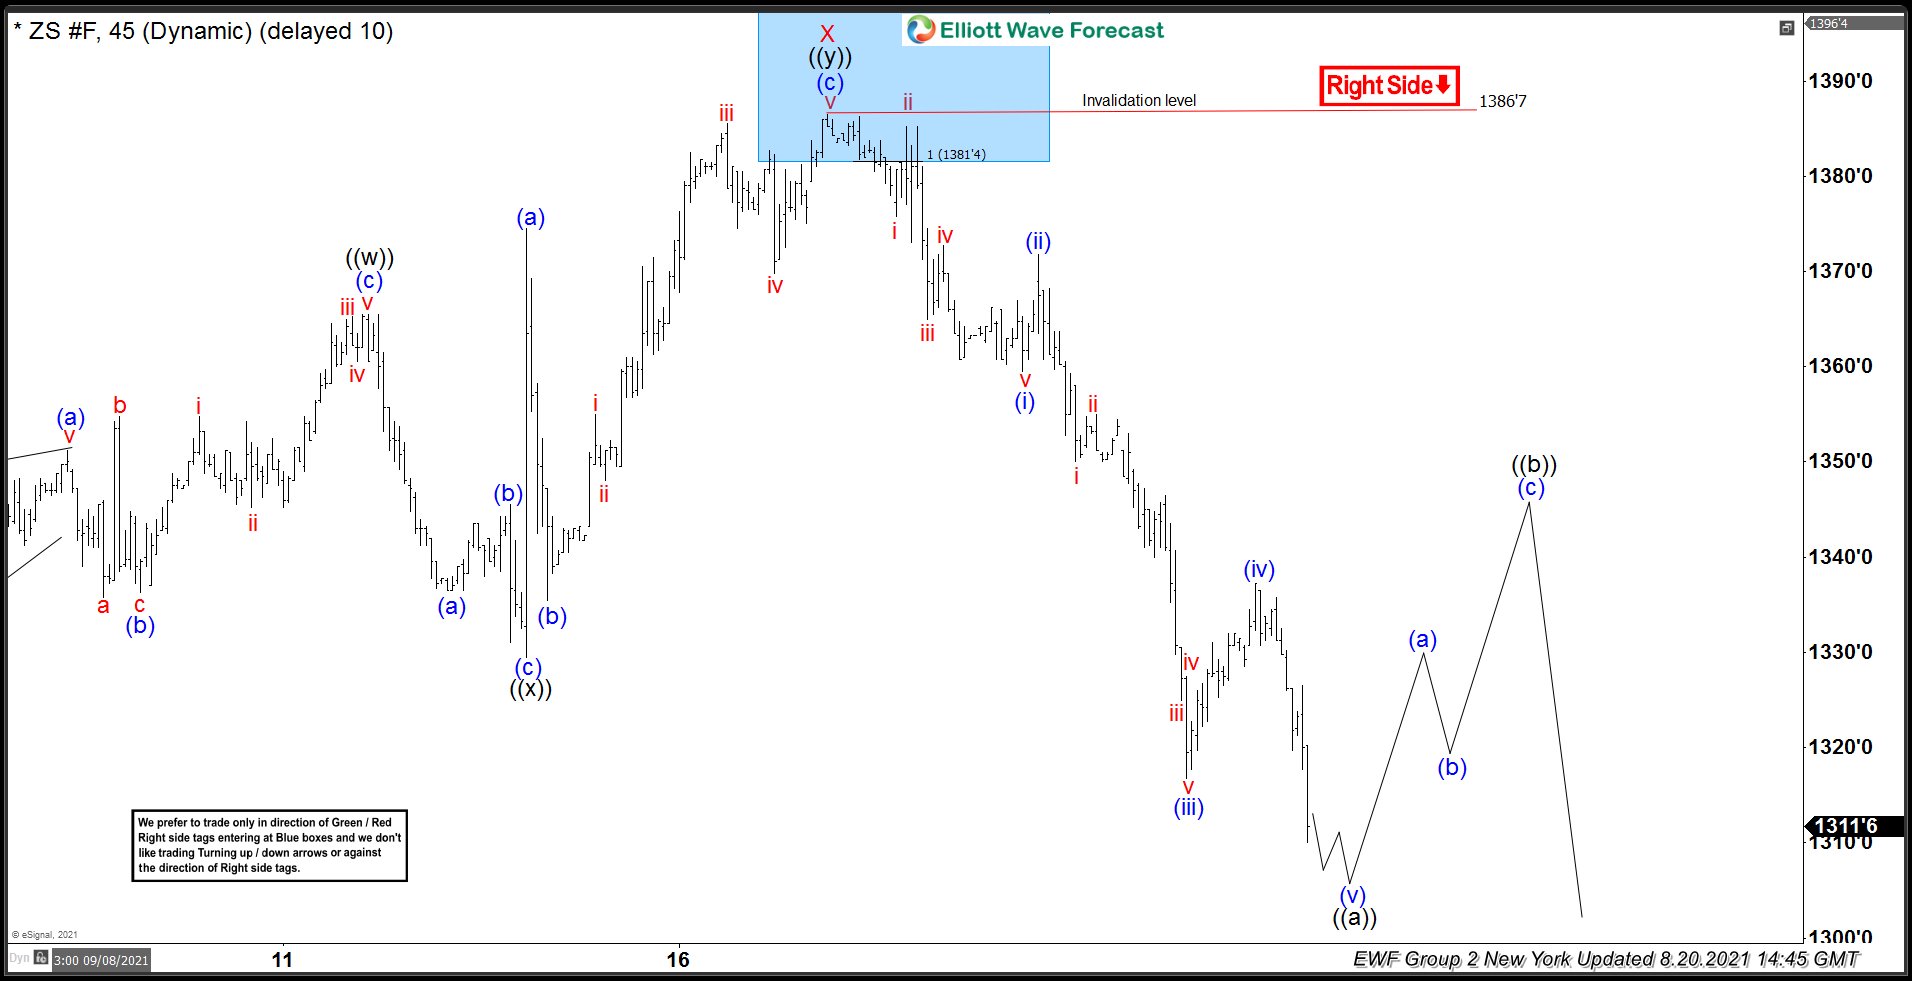
Hello fellow traders. In this technical blog we’re going to take a quick look at the Elliott Wave charts of Soybeans Futures ( $ZS_F ) published in members area of the Elliottwave-Forecast . As our members know, Soybeans Futures is showing lower low sequences in the cycle from the May peak. Recently we got recovery that has unfolded as Elliott Wave Double Three pattern that has given us opportunity to enter short trades. In further text we’re going to explain the forecast and Elliott Wave Pattern and trading strategy.
Before we take a look at the real market example, let’s explain Elliott Wave Double Three pattern.
Elliott Wave Double Three Pattern
Double three is the common pattern in the market , also known as 7 swing structure. It’s a reliable pattern which is giving us good trading entries with clearly defined invalidation levels.
The picture below presents what Elliott Wave Double Three pattern looks like. It has (W),(X),(Y) labeling and 3,3,3 inner structure, which means all of these 3 legs are corrective sequences. Each (W) and (Y) are made of 3 swings , they’re having A,B,C structure in lower degree, or alternatively they can have W,X,Y labeling.
Now, let's take a look what Elliott Wave Double Three Pattern looks like in the real market.
Soybeans is giving us X red recovery that is unfolding as Elliott Wave Double Three Pattern. It's having ((w))((x)) ((y)) inner labeling. The main characteristic of Double Three is that all 3 legs has corrective sequences. First leg Wave ((w)) has Zig Zag Formation -535 structure. Then we got 3 waves pull back in ((x)) connector, when now doing last leg up ((y)) which is also unfolding as Zig Zag Pattern. Recovery looks incomplete at the moment, suggesting another leg up. The Commodity is looking for 1381'7-1414'5 area, to complete Double Three . Although expecting more upside in near term, we recommend members to avoid buying and sell the commodity at marked blue box area. We like to be sellers at the blue box zone. Invalidation level for the trade is break above 1.618 fib extension (1381'7).
You can learn more about Elliott WaveDouble Three and Zig Zag Patterns at our Free Elliott Wave Educational Web Page.
Sellers appeared at the blue box and we got good reaction from there. The decline from the blue box reached 50 fibs against the ((x)) connector, as a result short positions from the blue box are Risk Free and partial profit are taken. At the moment we see recovery completed at 1386'7, however if mentioned pivot gives up we could see larger recovery. Now we are about to complete short term cycle from the 1386'7 peak, expecting to see bounce again. Anyway, as far as the price stays below 1386'7, short positions remain active. As our members know, Blue Boxes are no enemy areas , giving us 85% chance to get a reaction.
Keep in mind that market is dynamic and presented view could have changed in the mean time. You can check most recent charts in the membership area of the site. Best instruments to trade are those having incomplete bullish or bearish swings sequences. We put them in Sequence Report and best among them are shown in the Live Trading Room.
Since the crash of March 2020, all stocks have tried to recover what they lost, and Berkshire Hathaway was no exception. BRK.B did not only recover the lost, but It also reached historic highs. Now, it is building an impulse from March 2020 lows and we are going to follow to determinate the best area to complete the impulse.
Berkshire Hathaway Old Daily Chart
Wave ((1)) ended as an expanding leading diagonal, the structure could be rare for you because it is not quite common (If you want to learn more about Elliott Wave Theory, please follow this link: Elliott Wave Theory). I think it is better to manage the structure of Berkshire Hathaway in that way instead of a nest, and this is because comparing some cycles in the market has more sense with the current structures of the market. Then we have a clear (A), (B), (C) correction as wave ((2)) and we are developing wave ((3)) in this moment.
Berkshire Hathaway Daily Chart
In Berkshire Hathaway, the wave (4) extended in time ended at 270.73 and the movement of that last days is suggesting that the wave (5) of wave ((3)) is developing. The wave 1 of this impulse completed at 291.82 and wave 2 should end soon. Near term, we are looking for a spike to break 291.82 to know that wave 3 is on the road and the target comes in 300.90 – 316.51 area to complete wave ((3)).
Vinco Ventures is an interesting company with an intriguing business model. It has been fairly volatile the within the 2021 year and it looks like the swings are just starting.
“Vinco Ventures, Inc. leverages the new market opportunity by utilizing their B.I.G. Strategy: Buy. Innovate. Grow.
Buy - Acquisitions is our model. We will seek to acquire significant brands to continue to add to the Portfolio.
Innovate – Leverage the internal traffic platforms of Honey Badger and Social Pulse Media, our brands are able to quickly innovate and determine the highest conversion traffic and target accordingly. Once identified, we scale while maintaining conversions for success.
Grow - More targeted traffic equals more conversions. With our internal engines, we are able to expedite growth of our acquired brands to reach their target numbers quicker."
Recently this company has involved itself with the NFT sphere (non-fungible token) which is quickly gaining in popularity. This exposes the company in a round about way, to the Ethereum blockchain.
Vinco Ventures Elliottwave View:
Medium term term view from the all time low in Jan 2021. Vinco consolidated for a few days and gapped up to the wave Red I peak on Jan 21/2021 @ 9.40. After that, a lengthy consolidation took place which bottomed in Red II on April 16/2021. From there, a 5 waves advance took place into (1) which peaked on June 9/2021. Again, another pullback took place in (2) which bottomed on 8/19/2021. After that, a very impulsive rally took hold which caused a rally of 590% and now the stock is consolidation.
The idea is that there is an incomplete bullish sequence right now, and further up[side is favoured to take place. Another nest is possible in ((1)) and ((2)) before further upside takes place.
Since the crash of March 2020, all stocks have tried to recover what they lost and P&G was no exception. P&G did not only recover the lost, but It also reached historic highs. Now, we are going to try to build an impulse from wave II with a first target to $154.00 next $167.50 and $174.00, depending how the structure is developing.
P&G Old Daily Chart
As we see in the daily chart, P&G built an impulse ((1)), ((2)), ((3)), ((4)), and ((5)) that we call I in red and it ended at 146.92. Then, the stock dropped in 7 swings down ((W)), ((X)) and ((Y)) forming a double correction as wave II.
P&G Last Month Daily Chart
This wave II bounced from 121.54 dollars missing our ideal level for a few cents at 120.68. (If you want to learn more about Elliott Wave Theory, please follow this link: Elliott Wave Theory).
P&G Daily Chart
P&G rallied, and it completed wave ((1)) at 138.63 dollars. Also, we have seen a pullback that bounced at 130.19 dollars, Fibonacci 50% retracement, ending for us the wave ((2)). Wave (1) of ((3)) ends at 139.18 and wave (2) of ((3)) made a double correction to complete at 131.93. Wave (3) of ((3)) ended at 145.97 and wave (4) of ((3)) pullback completed at 141.47. As we stay above this level, we should continue higher to build a new impulse as wave (5) of wave ((3)) as you could see in the chart above. The target to complete wave ((3)) comes in 147.19 – 149.97 area. As Alt view, wave (4) of ((3)) is not done and it could breat 141.47 and then bounce to complete wave ((3)).
Hello fellow traders. In this technical blog we’re going to take a quick look at the Elliott Wave charts of Soybeans Futures ( $ZS_F ) published in members area of the Elliottwave-Forecast . As our members know, Soybeans Futures is showing lower low sequences in the cycle from the May peak. Recently we got recovery that has unfolded as Elliott Wave Double Three pattern that has given us opportunity to enter short trades. In further text we’re going to explain the forecast and Elliott Wave Pattern and trading strategy.
Before we take a look at the real market example, let’s explain Elliott Wave Double Three pattern.
Elliott Wave Double Three Pattern
Double three is the common pattern in the market , also known as 7 swing structure. It’s a reliable pattern which is giving us good trading entries with clearly defined invalidation levels.
The picture below presents what Elliott Wave Double Three pattern looks like. It has (W),(X),(Y) labeling and 3,3,3 inner structure, which means all of these 3 legs are corrective sequences. Each (W) and (Y) are made of 3 swings , they’re having A,B,C structure in lower degree, or alternatively they can have W,X,Y labeling.
Now, let’s take a look what Elliott Wave Double Three Pattern looks like in the real market.
Soybeans is giving us X red recovery that is unfolding as Elliott Wave Double Three Pattern. It’s having ((w))((x)) ((y)) inner labeling. The main characteristic of Double Three is that all 3 legs has corrective sequences. First leg Wave ((w)) has Zig Zag Formation -535 structure. Then we got 3 waves pull back in ((x)) connector, when now doing last leg up ((y)) which is also unfolding as Zig Zag Pattern. Recovery looks incomplete at the moment, suggesting another leg up. The Commodity is looking for 1381’7-1414’5 area, to complete Double Three . Although expecting more upside in near term, we recommend members to avoid buying and sell the commodity at marked blue box area. Invalidation level for the trade is break above 1.618 fib extension (1381’7). You can learn more about Elliott WaveDouble Three and Zig Zag Patterns at our Free Elliott Wave Educational Web Page.
Sellers appeared at the blue box and we got good reaction from there. The decline from the blue box reached 50 fibs against the ((x)) connector, as a result short positions from the blue box are Risk Free and partial profit are taken. At the moment we see recovery completed at 1386’7, however if mentioned pivot gives up we could see larger recovery. Now we are about to complete short term cycle from the 1386’7 peak, expecting to see bounce again. Anyway, as far as the price stays below 1386’7, short positions remain active. As our members know, Blue Boxes are no enemy areas , giving us 85% chance to get a reaction.
Keep in mind that market is dynamic and presented view could have changed in the mean time. You can check most recent charts in the membership area of the site. Best instruments to trade are those having incomplete bullish or bearish swings sequences. We put them in Sequence Report and best among them are shown in the Live Trading Room.
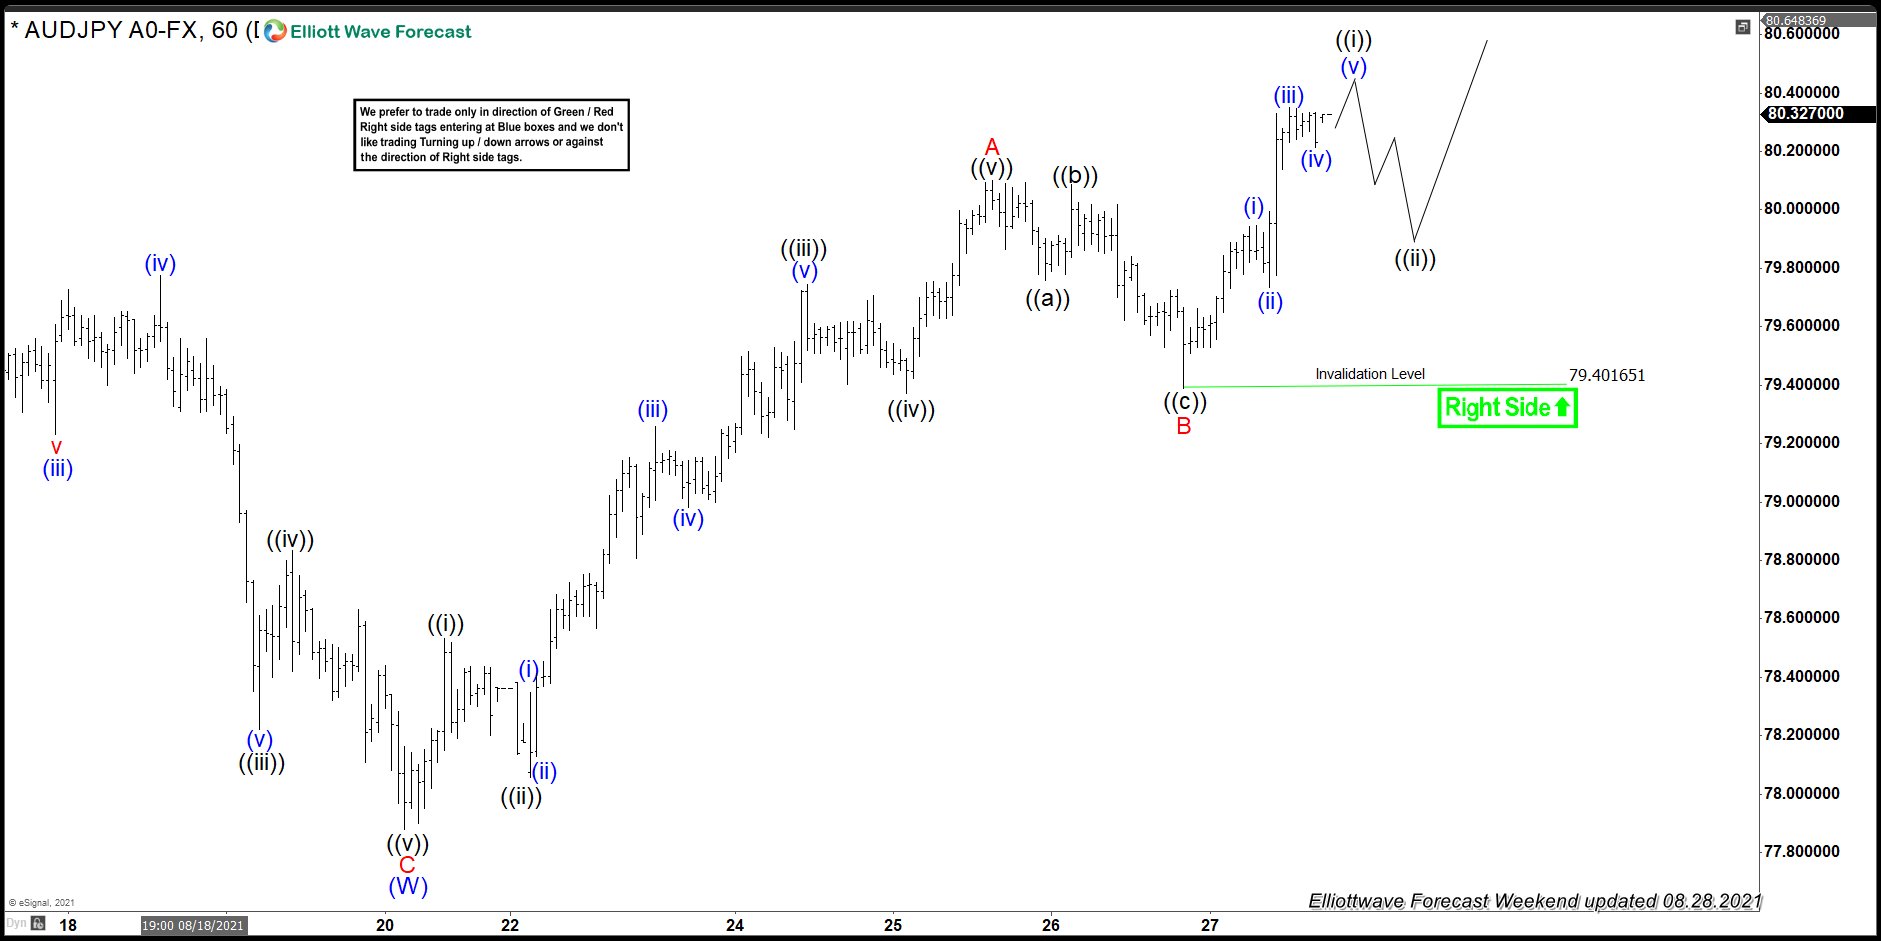
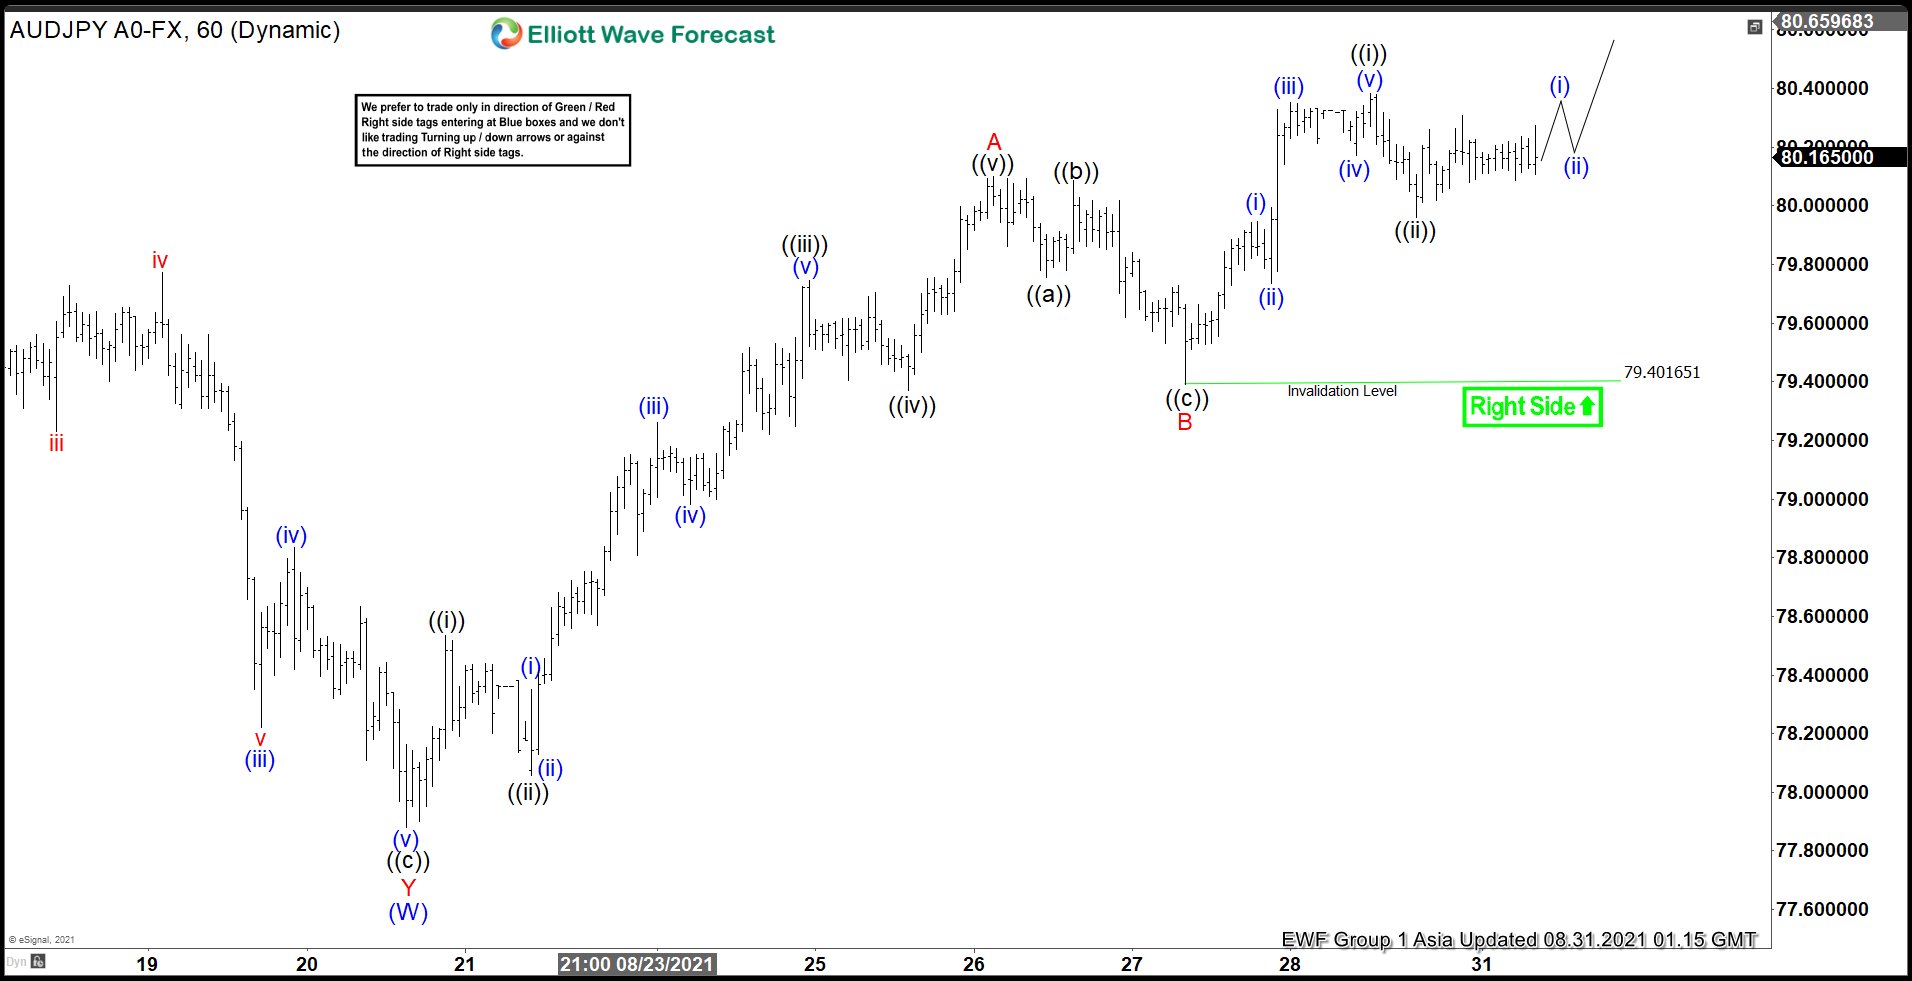
Hello fellow traders. In this blog, we’re going to take a quick look at the Elliott Wave charts of AUDJPY, published in members area of the website. AUDJPY has been giving us correction against the 05/10 peak. We’ve been calling rally in the Forex pair due to higher high sequences in the short term cycle from the 08/10 low. In the further text we are going to take a look at the price structure and explain the forecast.
AUDJPY 1h Hour Elliott Wave Analysis 8.28.2021
As we can see on the chart below, the forex pair made 5 waves up from the 8.10 low. That cycle is labeled as A red. We got 3 waves pull back - B red after which the price rallied and made new short term peak. The pair is now showing higher high sequences from the 8.10 low. We expect the pair to trade higher within C red that should unfold in 5 waves. The pair is bullish against the 76.4 low and calling for further rally. Short term cycle from the 79.4 low looks to be unfolding as 5 waves which should be wave ((i)) of C. We expect to see another short term high to complete 5 waves in ((i)) black. Then we can get 3 waves pull back ((ii)) before buyers appear again for further rally.
AUDJPY 1h Hour Elliott Wave Analysis 8.31.2021
Short term cycle from the 74.4 low ended as 5 waves, and we got ((ii)) pull back as expected. As far as the price stays above 79.94, more aggressive view suggests ((ii)) can be done. We believe that next leg up can be in progress. We don't recommend selling the pair and favor the long side against the 79.4 low due to bullish sequences in the cycle from the 08/10 low. The pair is targeting 81.61-82.13 area. Current price structure in the August cycle is characteristic for the Incomplete Elliott Wave Zig Zag Pattern.
You can learn more about Elliott Wave Zig Zag and other Patterns at our Free Elliott Wave Educational Web Page.
AUDJPY 1h Hour Elliott Wave Analysis 8.31.2021
The price held above 79.94 low and we got extension higher. Our target area 81.61-82.13 area is not so far away, but still looking for more upside. At this stage we call for another marginal push up to complete ((iii)) of C red.
Keep in mind that not every chart is trading recommendation and market is dynamic so presented view could have changed in the mean time. Best instruments to trade are those having incomplete bullish or bearish swings sequences. We put them in Sequence Report and best among them are shown in the Live Trading Room. You can check most recent charts in the membership area of the site.
Digihost Bitcoin Miner touts itself as a clean bitcoin miner who's electricity usage is 90% green energy. The chart looks pretty clean, but lets take a look at more details on the company:
“Digihost is a Blockchain Technology Company based in the United States with a focus on Bitcoin mining. Our growth-oriented strategy is to continuously exploit opportunities that increase mining hash rate; reduce energy costs through favourable contracts and vertical integration; and, increase the Company’s inventory of Bitcoin mined and held.
Digihost is well positioned to maintain strong Bitcoin mining operations while continuing to execute on its strategy to expand its business operations and achieve its goal of being one of the fastest growing Bitcoin mining companies in North America.”
This miner is a small cap stock, which has large potential, lets take a look at the Elliottwave View.
DigiHost Elliottwave View:
Medium term term view from the all time low in July 2020. Digihost was slow to start but caught up fairly quickly to other miners. After initially ralling into ((1)) and correcting in ((2)) in early 2021, the stock experienced an impulsive breakout. The rally was swift, which took the price from ((2)) low @ 0.43 to the peak ((5)) @ 4.75 within the span of a month. Consequently, after such a large run, a pullback was inevitable.
The stock then pulled back in an ABC correction. This correction struck a low in Red II on July 20/2021 @ 0.88. Since we have an area to measure from regarding Red I and II, the next area above where a pullback can happen is the 5.62 to 8.55 area.
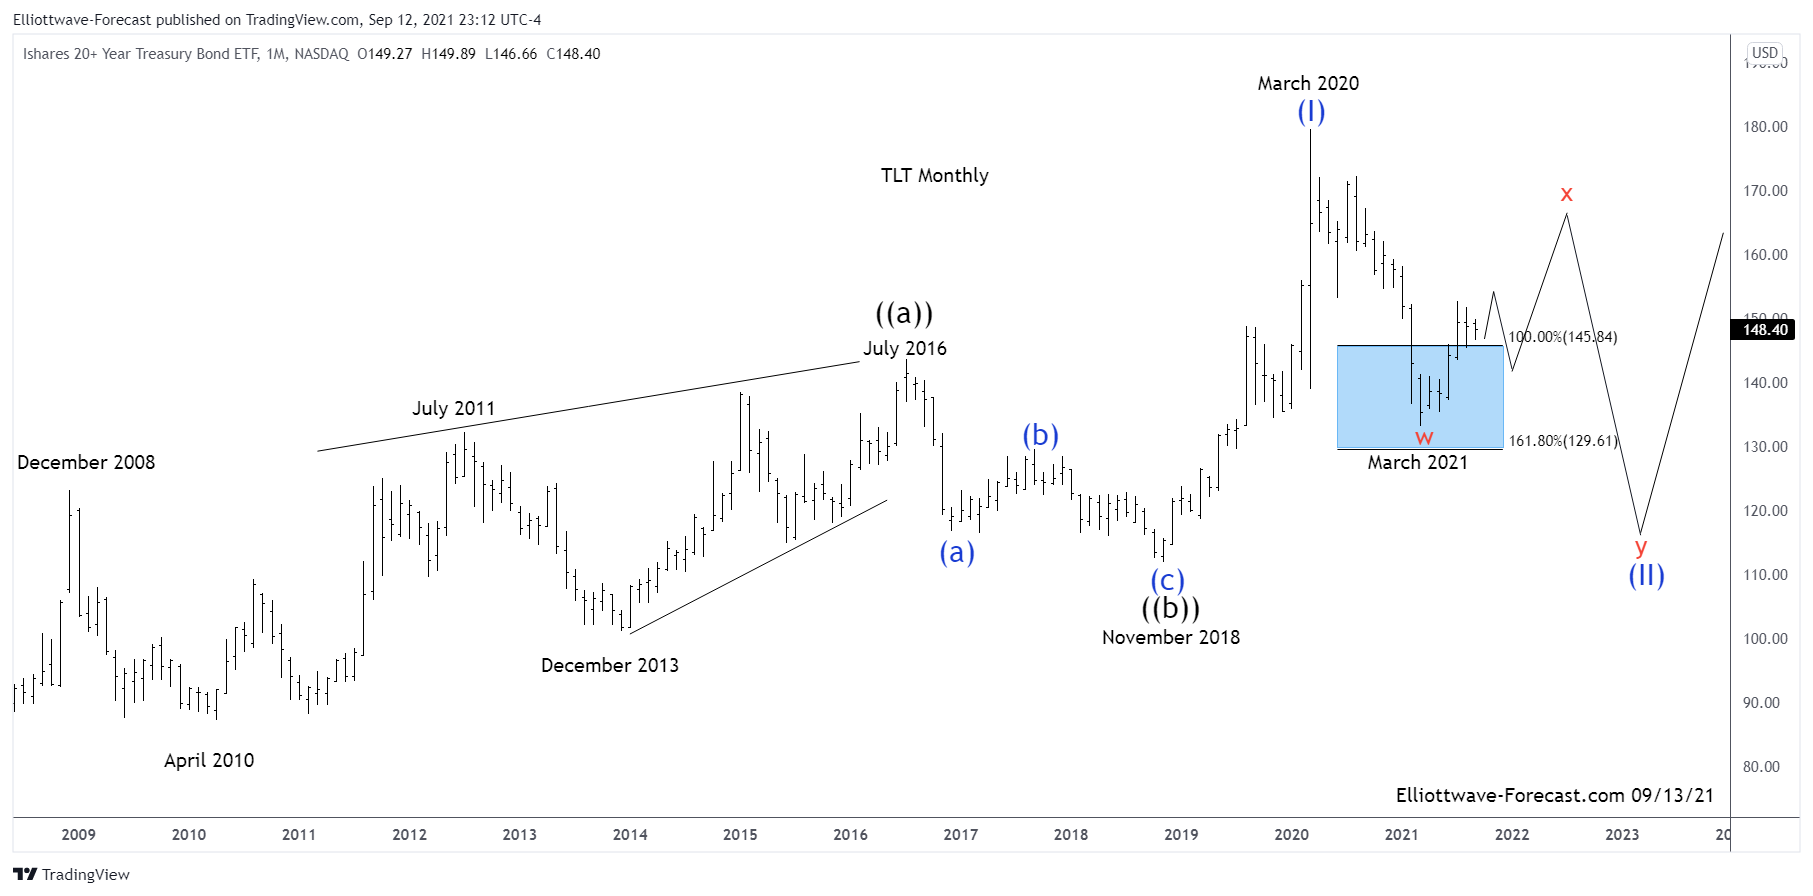
$TLT Can Bounce Further to Correct a Cycle From the March 2020 Highs
Firstly the ETF fund TLT inception date was on July 22, 2002. This instrument seeks to track the investment results of an index composed of or in U.S. Treasury bonds with maturities twenty years or more remaining. There is a lack of data before July 22, 2002. This article will focus on the larger uptrend cycle from there which is presumed finished a cycle higher from those lows in wave ((a)) in July 2016. The pullback from that high appeared to be an Elliott wave zig zag structure in three waves into the November 2018 wave ((b)) lows.
Secondly: The aforementioned pullback lower in the wave ((b)) was strong enough to suggest it was correcting the cycle up from the all time lows. Thus it appears ended that cycle. From those November 2018 lows the instrument has made another high above the July 2016 highs creating a bullish sequence. This sequence higher from the November 2018 lows appears to be incomplete. On the monthly chart shown below, Elliott wave corrective sequences are in either three, seven or eleven swings. Impulses are in either five, nine or thirteen swings. It is obvious the three swings lower from the July 2016 highs into the November 2018 lows were of three swings.
The analysis continues and concludes below the Monthly chart.
Thirdly and in conclusion the cycle up from the November 2018 lows ended at the March 2020 highs. Down from there a three swing cycle ended at the March 2021 lows. While a pullback remains above there it can see another swing higher to correct the cycle lower from the March 2020 highs. Afterward it can see another swing lower to correct the cycle up from the November 2018 lows.
Gold and related Index such as Gold Miners Junior (GDXJ) have been in steady decline / sideways in the past 14 months. GDXJ in particular continues to correct lower after forming the high at 65.95 on August 2020. In this article, we will take a look at the potential support area for the ETF. We believe the longer term direction of this ETF still remains higher despite the more than 1 year correction.
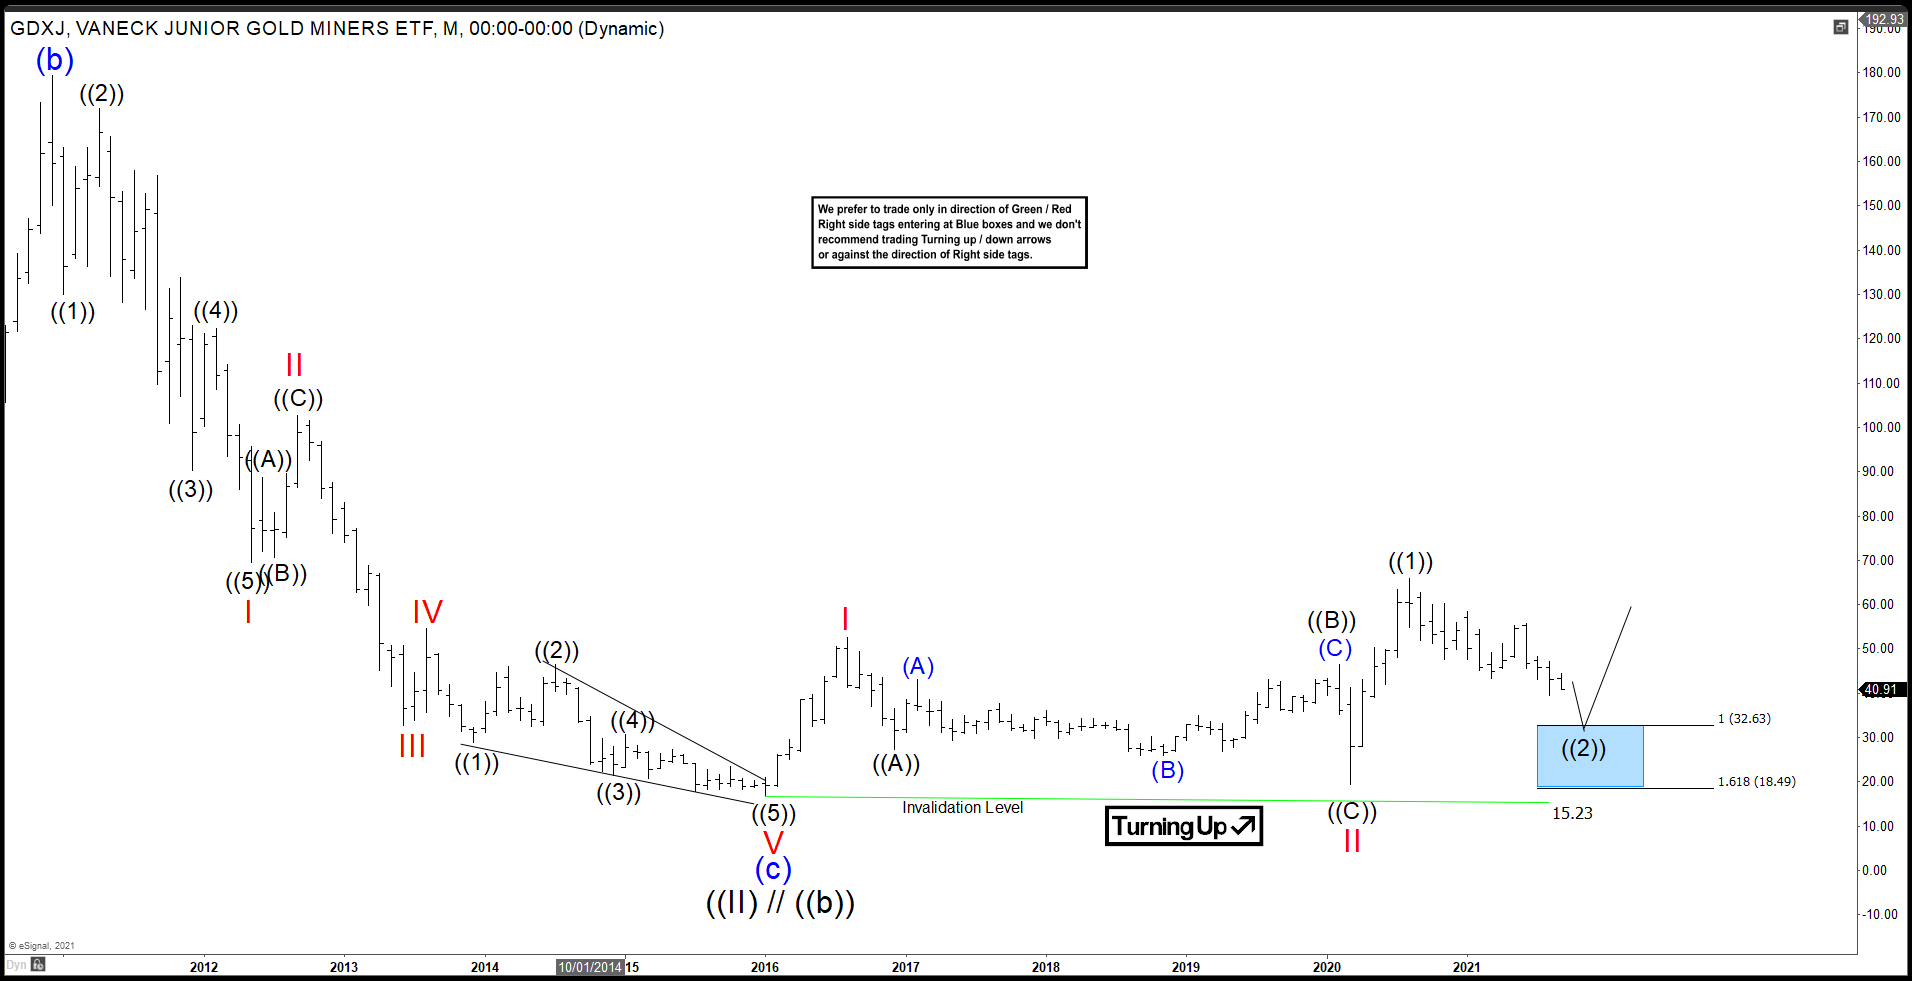
GDXJ Monthly Elliott Wave Chart
Monthly chart of GDXJ above suggests decline to $15.23 ended Grand Super Cycle wave ((II))/((b)) on January 2016. The ETF starts to turn higher and likely in the very early stage of the next multi-year / decade bull run. Wave ((2)) of III pullback is currently in progress to correct cycle from March 2020 low. As far as pullback stay above $15.23, expect the ETF to resume higher again.
GDXJ Daily Elliott Wave Chart
Daily chart of GDXJ above shows rally to 65.95 ended wave ((1)) as an impulse. Wave ((2)) pullback is currently in progress as a double three Elliott Wave structure. Down from wave ((1)), wave A ended at 47.68 and wave B ended at 58.55. The ETF then resumes lower in wave C towards 43.24 which also completed wave (W). Wave (X) rally ended at 55.79 as a zigzag structure. Final leg lower wave (Y) of ((2)) could see a little more downside to reach 100% - 161.8% of wave (W) towards 19.06 From this area, the ETF could turn and start the next leg higher.
Eramet is a French multinational mining and metallurgy company. The company produces non-ferrous metals and derivatives, nickel alloys and superalloys, as well as high-performance special steels. Founded in 1880 with the funding of the Rothschild family and headquartered in Paris, today, the company is largely owned by Duval family and the French state. Eramet is a part of CAC Mid 60 index and can be traded under the ticket $ERA at Euronext Paris.
Today, we see commodities in general and metals in particular strongly turning up. In consequence, company like Eramet should see strong support in the overall bullish market. Therefore, investors can be looking to buy Eramet in order to diversify their portfolio by indirect investment in rising metal prices.
Eramet Monthly Elliott Wave Analysis 09.13.2021
The monthly chart below shows the Eramet stock $ERA traded at Euronext. From the all-time lows, the stock price has developed a cycle higher in black wave ((I)) of grand super cycle degree towards the all-time highs on May 2008 at 669.98. From the highs, a correction lower in black wave ((II)) has unfolded as an Elliott wave zigzag pattern. It has printed an important bottom in February 2016 at 15.36. From the lows, a new cycle in wave ((III)) has already started and should extend towards 669.98 highs and even higher.
Within wave ((III)), one can see one nest in place. Indeed, red wave I of blue wave (I) has ended at 167.20 highs. Then, a pullback in wave II has found support at 18.66 on March 2020. While above there, a new cycle in red wave III of (I) is already in progress. The target for wave III will be 171.13-265.55.
Eramet Daily Elliott Wave Analysis 09.13.2021
The daily chart below shows in more detail the first stages of the advance higher in wave III. From the March 2020 lows at 18.66, the initial impulsive advance in black wave ((1)) migfht be still in progress. The blue subwaves (1)-(4) have ended. While above 47.48, wave (5) o ((1)) can extend higher. Once accomplished, a correction in wave ((2)) should correct the March 2020 cycle before an acceleration to the upside within wave ((3)) of III should take place.
Investors and traders can be looking to buy Eramet in a pullback against 18.66 lows in 3, 7 or 11 swings expecting acceleration higher.
Oz Minerals is an Australian mining company. The main products are gold and copper. Formed in 2008 after the merger of Oxiana Limited and Zinifex, it is based in Adelaide, Australia. One can trade it under the ticker $OZL at ASE.
Since 2020, we see a strong rally in all metals. Therefore, one should expect mining companies to profit substantially from the rising prices of the underlying assets. Indeed, we see Oz Minerals turning higher from 2013 lows. Without any doubt, the rising gold prices since 2015 have supported the $OZL stock. Then, from 2020 lows, a strong push higher in Copper has provided an additional effect to the company stock. Now, we expect more upside in both gold and copper. Therefore, Oz Minerals should remain profitable for both investors and traders as it offers a considerable upside in the next future.
Oz Minerals Monthly Elliott Wave Analysis 09.13.2021
The monthly chart below shows the Oz Minerals stock $OZL at ASE. From the all-time lows, the stock price has developed a cycle higher in wave (I) of a super cycle degree. Hereby, $OZL has printed the all-time high on November 2007 at 43.20. From the 2007 highs, a correction lower has unfolded as a zigzag correction in the blue wave (II). It has ended correcting the previous super cycle by printing an important bottom in December 2013 at 2.11.
From the 2013 lows at 2.11, a new cycle in wave (III) has already started. Clear break above 43.20 highs will confirm that. Right now, the wave (III) might be within a red wave I. Hereby, initial nest comprising waves ((1)) and ((2)) of red wave I has been formed. It has ended on March 2020. From the March 2020 lows, waves ((3))-((4))-((5)) should accomplish the wave I. Then, one should expect a pullback in red wave II and an acceleration higher in red wave III of the blue wave (III). The target for the wave ((III)) will be 45.14-71.79 area and possibly higher.
Oz Minerals Daily Elliott Wave Analysis 09.13.2021
The daily view demonstrates the advance from the March 2020 lows in black wave ((3)). From the 5.83 lows, wave ((3)) shows an extension as it has clearly reached beyond the 1.618 multiples of the length of the wave ((1)). It has ended in May 2021 at 27.15. From the highs, a pullback in wave ((4)) should find support above 5.83 lows for an extension in black wave ((5)).
Traders can be looking to buy 3 swings lower into the balck wave ((5)). While below 24.60 highs, one can buy $OZL from 17.48-13.09 area. There, a rally to new highs or a bounce in 3 waves as minimum should be expected.
By contrast, long-term investors should wait for waves ((4))-((5)) of red wave I to end. Then, a consolidation lower in red wave II will provide a long-term opportunity in the monthly timeframe.
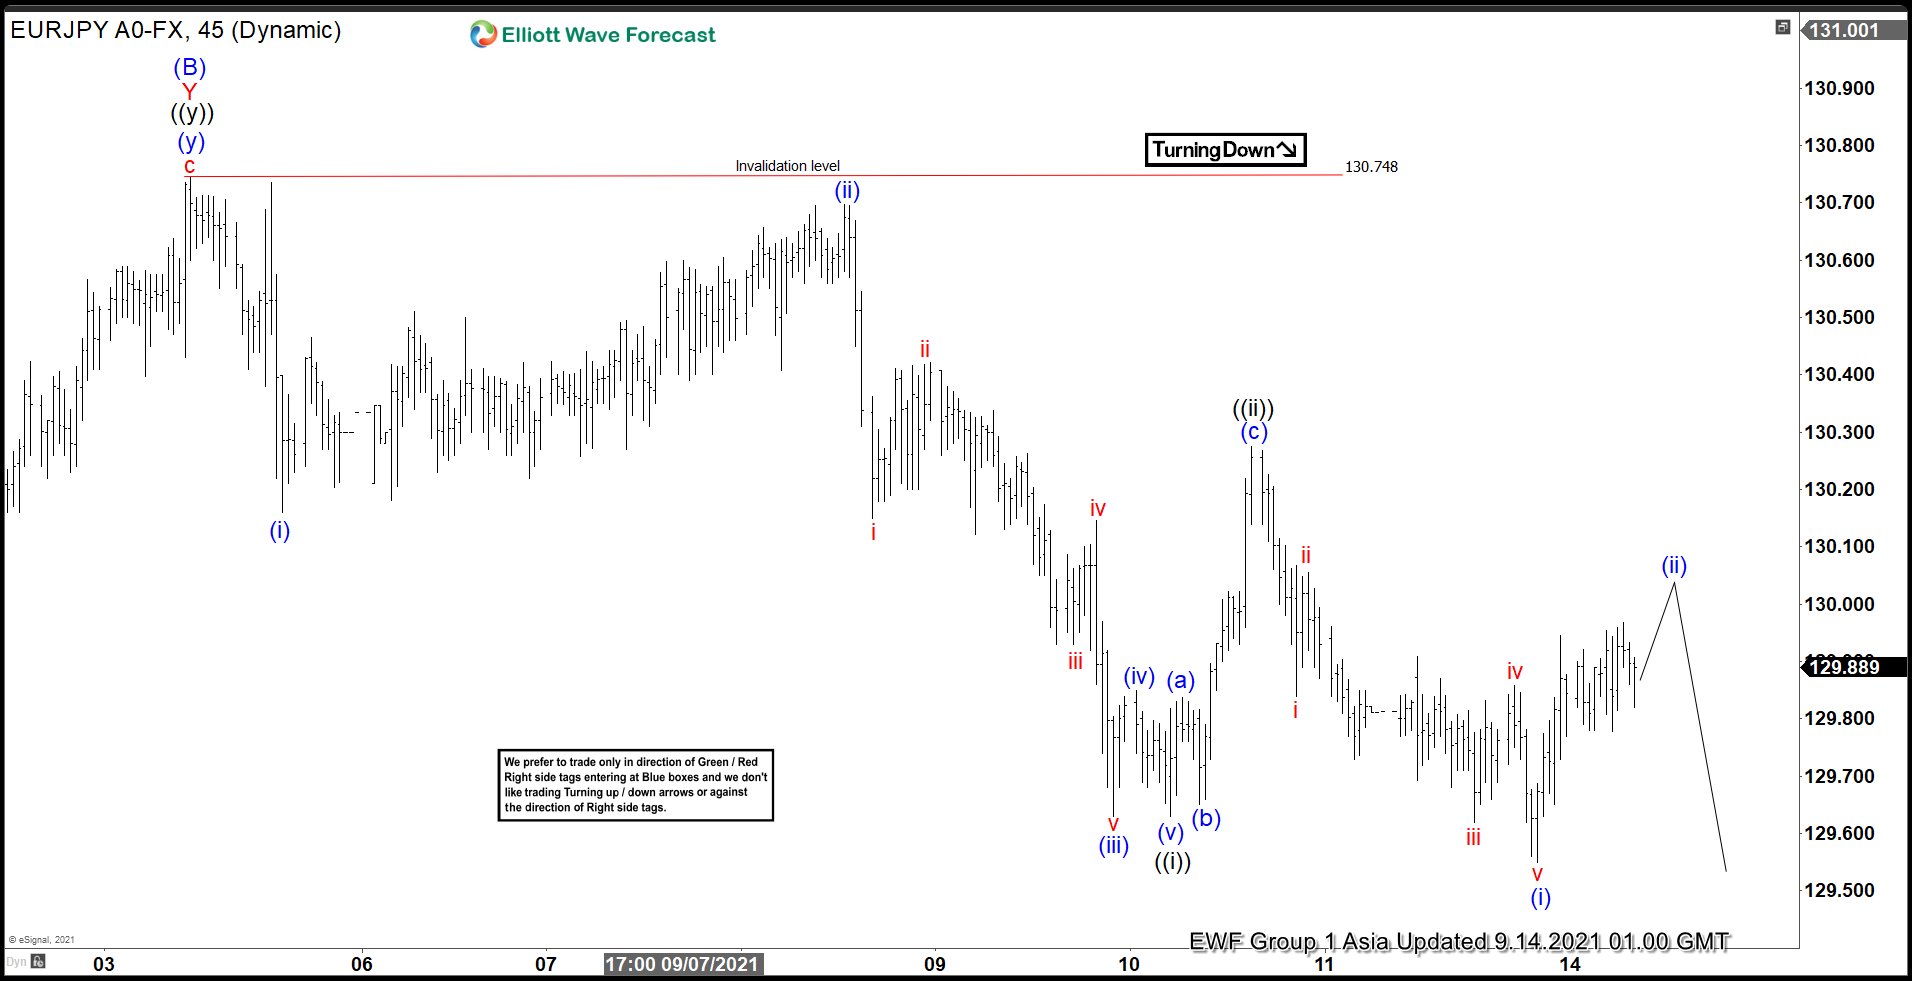
Short-term Elliott wave view in EURJPY suggests rally to 130.75 ended wave (B). Pair has turned lower in wave (C) but it still needs to break the previous wave (A) low at 127.9 on August 19 to rule out a double correction. Down from wave (B), decline is in progress as a 5 waves impulsive structure. First leg wave (i) ended at 130.16, and rally in wave (ii) ended at 130.698.
Pair resumes lower in wave (iii) towards 129.63, rally in wave (iv) ended at 129.85, and final leg lower wave (v) ended at 129.63. This completed wave ((i)) in higher degree. Correction in wave ((ii)) then ended at 130.27 as a zigzag structure. Pair has resumed lower in wave ((iii)). Down from wave ((ii)), wave (i) ended at 129.55 and wave (ii) correction is in progress. While rally fails below wave ((ii)) high at 130.27, and more importantly below 130.75, expect pair to extend lower. Another possible alternate is that pair ended wave ((i)) at the recent 129.55 low. In the alternate scenario, current rally is in wave ((ii)) which could see larger 3 waves but still expected to fail below 130.75 for more downside. Near term, as far as pivot at 130.75 high stays intact, expect rally to fail in 3, 7, or 11 swing for further downside.
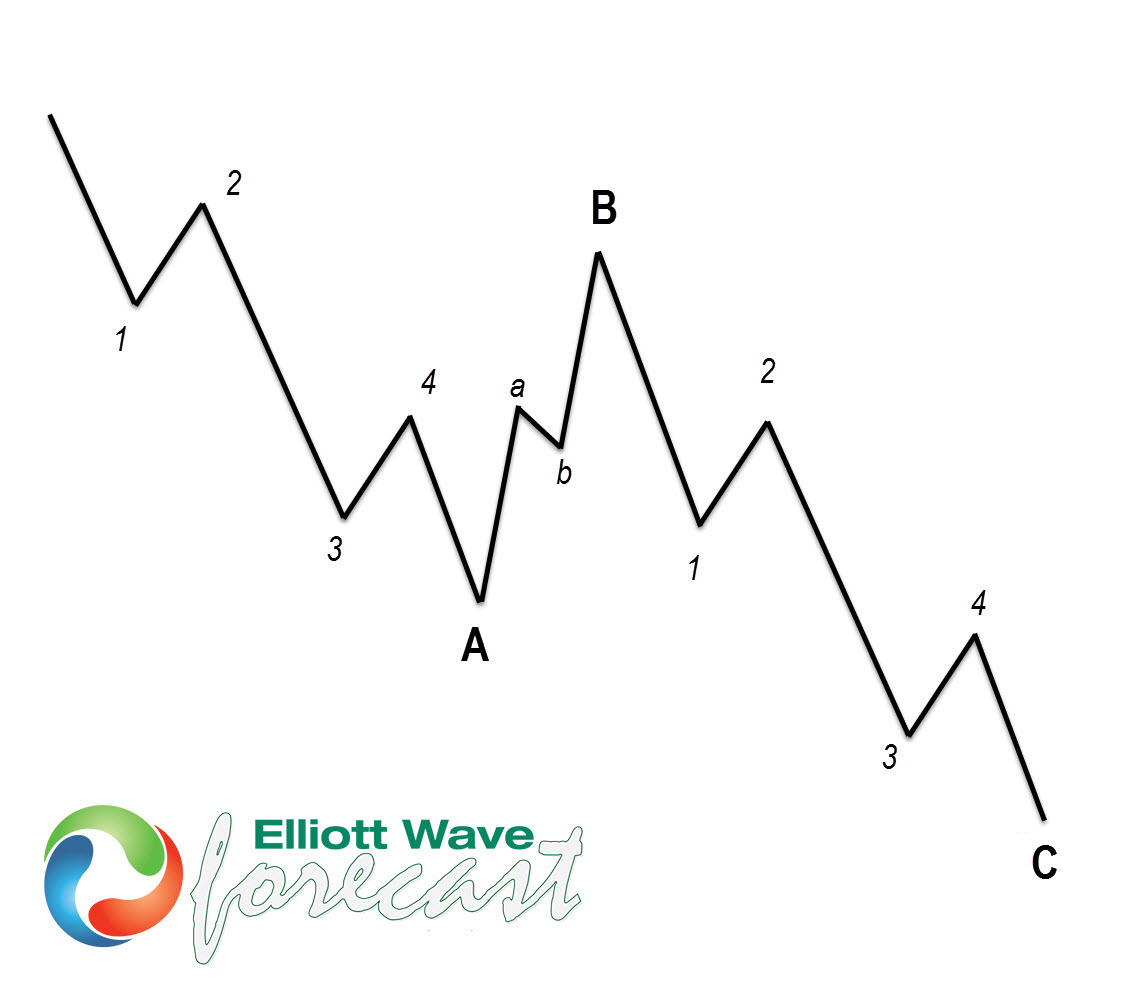
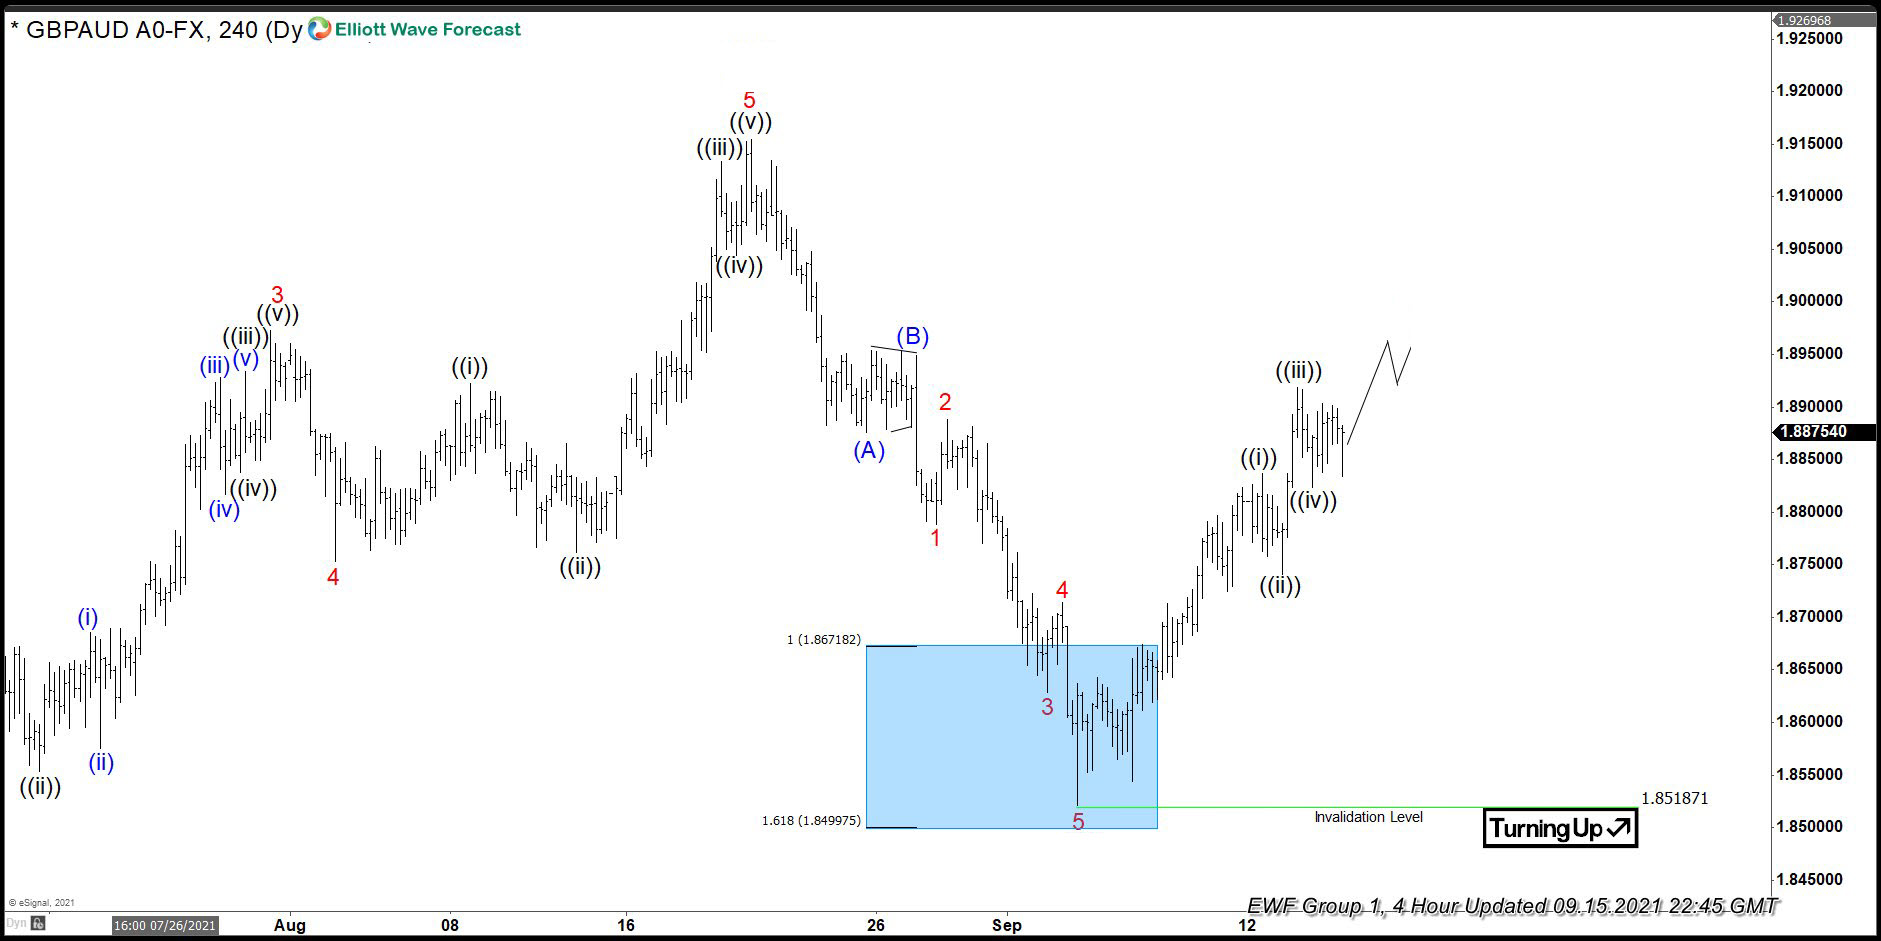
Hello fellow traders. In this technical blog we’re going to take a quick look at the Elliott Wave charts of GBPAUD, published in members area of the website. As our members know, we’ve been calling rally in the Forex Pair. The pair made pull back that has had a form of Elliott Wave Zig Zag pattern. We expected GBPAUD to find buyers at the extreme zone from the 08/20 peak. In the further text we are going to explain the Elliott Wave Pattern and trading strategy.
Before we take a look at the real market example, let’s explain Elliott Wave Zigzag.
Elliott Wave Zigzag is the most popular corrective pattern in Elliott Wave theory . It’s made of 3 swings which have 5-3-5 inner structure. Inner swings are labeled as A,B,C where A =5 waves, B=3 waves and C=5 waves. That means A and C can be either impulsive waves or diagonals. (Leading Diagonal in case of wave A or Ending in case of wave C) . Waves A and C must meet all conditions of being 5 wave structure, such as: having RSI divergency between wave subdivisions, ideal Fibonacci extensions and ideal retracements.
GBPAUD Elliott Wave 1 Hour Chart 09.02.2021
At the chart below we can see what Elliott Wave Zig Zag pattern looks like in real market. Pull back reached equal legs at 1.86718-1.84997 (buyers zone). First leg of the– A red, has subdivided into 5 waves. Then we got B red that has form of Triangle Structure. Finally doing C red that should have 5 waves. Currently we can be doing ((iv)) of C red. Once bounce completes another leg down within blue box should ideally follow . We don't recommend selling the pair and favor the long side from the blue box area. Once bounce reaches 50 Fibs against the B red high, we will make long position risk free ( put SL at BE). As our members know, Blue Boxes are no enemy areas , giving us 85% chance to get a bounce.
You can learn more about Elliott Wave ZigZag Patterns at our Free Elliott Wave Educational Web Page.
GBPAUD Elliott Wave 1 Hour Chart 09.02.2021
The pair made another wave down within blue box area and found buyers as we expected. We got nice reaction from the blue box, which reached and exceeded 50 fibs against the connector, so any long trades from the blue box should be risk free at this stage. Cycle from the peak is counted completed at 1.85187 low. Now we would like to stay long from the blue box and not forcing new trades , until 08/20 peak gets broken. In that case GBPAUD will have again bullish sequences and will offer new long opportunities in 3,7,11 swings.
Keep in mind that market is dynamic and presented view could have changed in the mean time. You can check most recent updates in the membership area of the website. Best instruments to trade are those having incomplete bullish or bearish swings sequences. We put them in Sequence Report and best among them are shown in the Live Trading Room. You can check most recent charts in the membership area of the site.
The Swiss Market Index (SMI) is one of the other Capital Markets worldwide that is building motive wave from the lows of March 2020. We can clearly see that it has already completed 3 waves to the upside and we are correcting on wave 4 now.
SMI Daily Chart
Wave ((1)) ends at 10534 as leading diagonal. Wave ((2)) did a double correction to complete at 9498. Then the SMI bounce from there developed another impulse as wave ((3)). The wave (1) of ((3)) did another leading diagonal. If you want to learn more about Elliott Wave Theory, please follow this link: Elliott Wave Theory). Then wave (2) of ((3)) was short ending at 10922. Wave (3) of ((3)) impulse ends at 12088 and wave (4) of ((3)) pullback at 11800. Last push to complete wave (v) of ((3)) and wave ((3)) peak at 12582.
Currently, we are developing wave ((4)) that should find support in 11844 – 11395 area and continue higher to complete the impulse from March 2020 low. This last swing should end in 13757 – 12760 area where wave I of upper degree will end and we should correct the whole cycle in wave II. As SMI ALT view in blue, wave ((3)) could not be completed and needs one more swing high to finish it and then we will see a pullback an a last push to complete the impulse.
Vinco Ventures is an interesting stock. Recently it has had a surge from $2 to just under $13. So what is behind the sudden move? Lets take a look at the company profile:
“Vinco Ventures, Inc. leverages the new market opportunity by utilizing their B.I.G. Strategy: Buy. Innovate. Grow.
Buy - Acquisitions is our model. We will seek to acquire significant brands to continue to add to the Portfolio.
Innovate – Leverage the internal traffic platforms of Honey Badger and Social Pulse Media, our brands are able to quickly innovate and determine the highest conversion traffic and target accordingly. Once identified, we scale while maintaining conversions for success.
Grow - More targeted traffic equals more conversions. With our internal engines, we are able to expedite growth of our acquired brands to reach their target numbers quicker.”
Recently, some of their plans include the NFT market which does expose them to the crypto world in a way. Lets take a look at the charts!
Vinco Ventures Elliottwave View:
Medium term term view from the Jan 2021 low. the stock experienced a large overnight gap up which marked the peak of Red I. After that the stock pulled back in consoldation and formed a low in Red II on April 16/2021. From there, another (1) and (2) took place, which bottomed on 8/19. After that, the attitude of the stock took on a classic wave 3 impulse which left many traders chasing price action higher.
The stock took its time to complete (3) which peaked on Sep 8 @ 12.49. However there is now an incomplete bullish sequence which is pointing to at least one more high to take place. It is currently favoured the stock has bottomed in (4), or can be close to doing so. One more leg higher can take place before another larger pullback may take place in ((2)).
With these meme stocks, it is important to expect extreme volatility, and to use correct position sizing.
Hard Red Winter Wheat is one of the grain commodities, along with soft red wheat, corn, soybeans and others. Within the wheat family, first of all, there is a fundamental difference between two wheat types. Soft wheat is low in protein and is basically used in cakes in pastries. By contrast, hard wheat has a higher content of protein and it founds itself in breads and hard baked goods. Some time ago, trading of hard wheat took place at Kansas City Board of Trade. Then, it moved to Chicago. One can trade hard wheat futures at Chicago Board of Trade under the ticker $KE. Hereby, the contract size is 5’000 bushels (300’000 pounds) each and the prices are in Dollars US per 100 bushel.
In december 2020, the initial article has presented our bullish view. As a matter of fact, the prices climbed from 524 USD in decmeber 2020 towards 738 USD by August 2021. Now, we expect a short term pullback. Then, a rally towards 1000 USD and higher should take place.
Hard Red Winter Wheat Weekly Elliott Wave Analysis 09.19.2021
The weekly chart below shows the Hard Winter Wheat front contract IH #F. From the all-time lows, the prices have developed a cycle higher in black wave ((a)) of a grand super cycle degree. It has ended in March 2018 at 1148 Dollars. From the highs, a correction lower in wave ((b)) has unfolded as an Elliott Wave double three pattern. In 8 years, as a matter of fact, IH #F has lost 3/4 of the price reaching 296 Dollars per 100 bushel. It is the preferred view that an important bottom on October 2016 has been set and the black wave ((b)) has ended.
From the lows, consequently, a new rally within wave ((c)) may have started. Hereby, the super cycle degree waves (I) and (II) have already ended, while above 365, wave (III) is extending higher. It has reached the 625-785 target area. However, the RSI reading still shows a divergence as related to the wave (I). As a consequence, acceleration within wave (III) should still take place. Therefore, after ending wave I in August 2021, one should expect a consolidation in wave II and the following acceleration in wave III of (III). The medium-term target for coming 1-2 years will be towards 1000 USD per 100 bushel and even higher. Investors and traders can be looking to buy the pullback in wave II in 3, 7 or 11 swings against 365 lows expecting more upside.
2025-2030, the expectations are to break out to the new all-time highs. The long-term target for wave ((c)) to end will be 1444-2153 area.
In this technical blog we’re going to take a look at the Elliott Wave charts charts of Russell $RTY_F published in members area of the website. Recently the Index corrected the cycle from the 9th June peak , when recovery unfolded as Elliott Wave Flat structure. In further text we’re going to explain the forecast and Elliott Wave Pattern.
Before we take a look at the real market example of Expanded Flat, let’s explain the pattern in a few words.
Elliott Wave Expanded Flat Theory
Elliott Wave Flat is a 3 wave corrective pattern which could often be seen in the market nowadays. Inner subdivision is labeled as A,B,C , with inner 3,3,5 structure. Waves A and B have forms of corrective structures like zigzag, flat, double three or triple three. Third wave C is always 5 waves structure, either motive impulse or ending diagonal pattern. It’s important to notice that in Flat Pattern wave B is very deep, but completes above the start point of wave A. Wave C ends above the ending point of wave A . Wave C of Flat completes usually between 1.00 to 1.236 Fibonacci extension of A related to B, but sometimes it could go up to 1.618 fibs ext.
At the graphic below, we can see what Expanded Flat structure looks like.
Now, let’s take a look what Elliott Wave Flat Pattern looks like in the real market
Russell 4Hour Elliott Wave Analysis 8.31.2021.
Russell is correcting the cycle from the June peak. Short term recovery X red looks to be unfolding as Elliott Wave Flat Pattern. As we can see on the chart below, waves ((a)) and ((b)) are showing corrective sequences. At this stage we expect to see more short term strength to complete 5 waves up from the recent low which would be ((c)) leg of X red Flat recovery. Recovery can be ending at 2270-2309.4 area, which is 1.00-1.236 fib extension of ((a))-((b)) .
You can learn more about Elliott Wave FLAT Patterns at our Free Elliott Wave Educational Web Page
Russell 4Hour Elliott Wave Analysis 9.20.2021.
Recovery made 5 waves in ((c)) leg and completed Elliott Wave Flat Structure at 2312.5 high. As far as the price stays below that high, Russell can be giving us next leg down. We expect further separation from the current 2312.5 peak and ideally break of 07/19 lw low which will confirm next leg down is in progress.
Keep in mind that market is dynamic and presented view could have changed in the mean time. You can check most recent charts in the membership area of the site. Best instruments to trade are those having incomplete bullish or bearish swings sequences. We put them in Sequence Report and best among them are shown in the Live Trading Room.
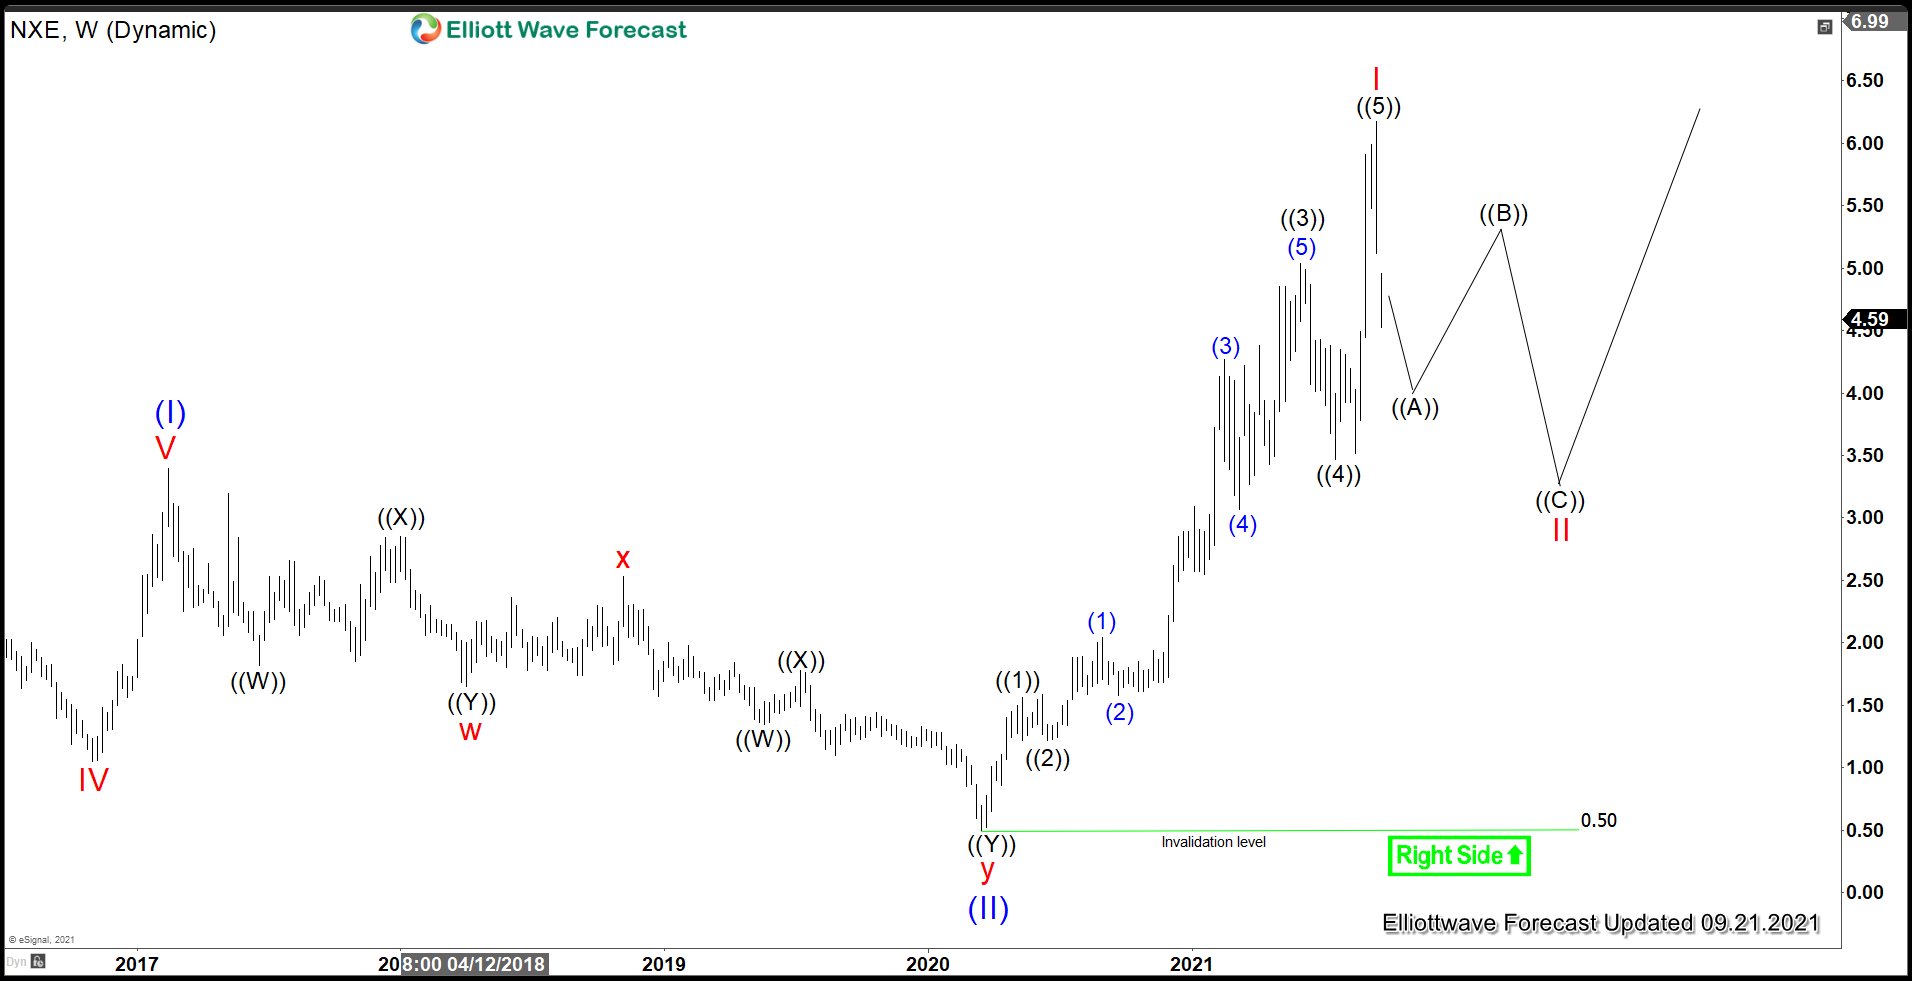
NextGen Energy (ticker: NXE) has rallied over 300% this year following the spot price of Uranium. The stock got a boost this year on the back of new physical Uranium ETF by Sprott. It is the world's only physical uranium fund. The Trust has been on a buying spree, increasing its stockpile by 45%. However, investor demand from hedge funds and family offices has been strong this year even before the launch of the new trust on July 19.
On the back of the expectation of Fed's tapering, the stock is now pulling back to do larger degree correction. We will look at the Elliott Wave structure below:
$NXE Weekly Elliott Wave Chart
NXE could be ending cycle from March 2020 low and now looking to do larger 3 waves pullback to correct this cycle before the rally resumes. Decline to 0.50 ended wave (II). Wave (III) is currently in progress as a 5 waves impulse Elliott Wave structure. Up from wave (II), wave I ended at 6.17. Look for wave II pullback to unfold in 3, 7, or 11 swing before it resumes higher.
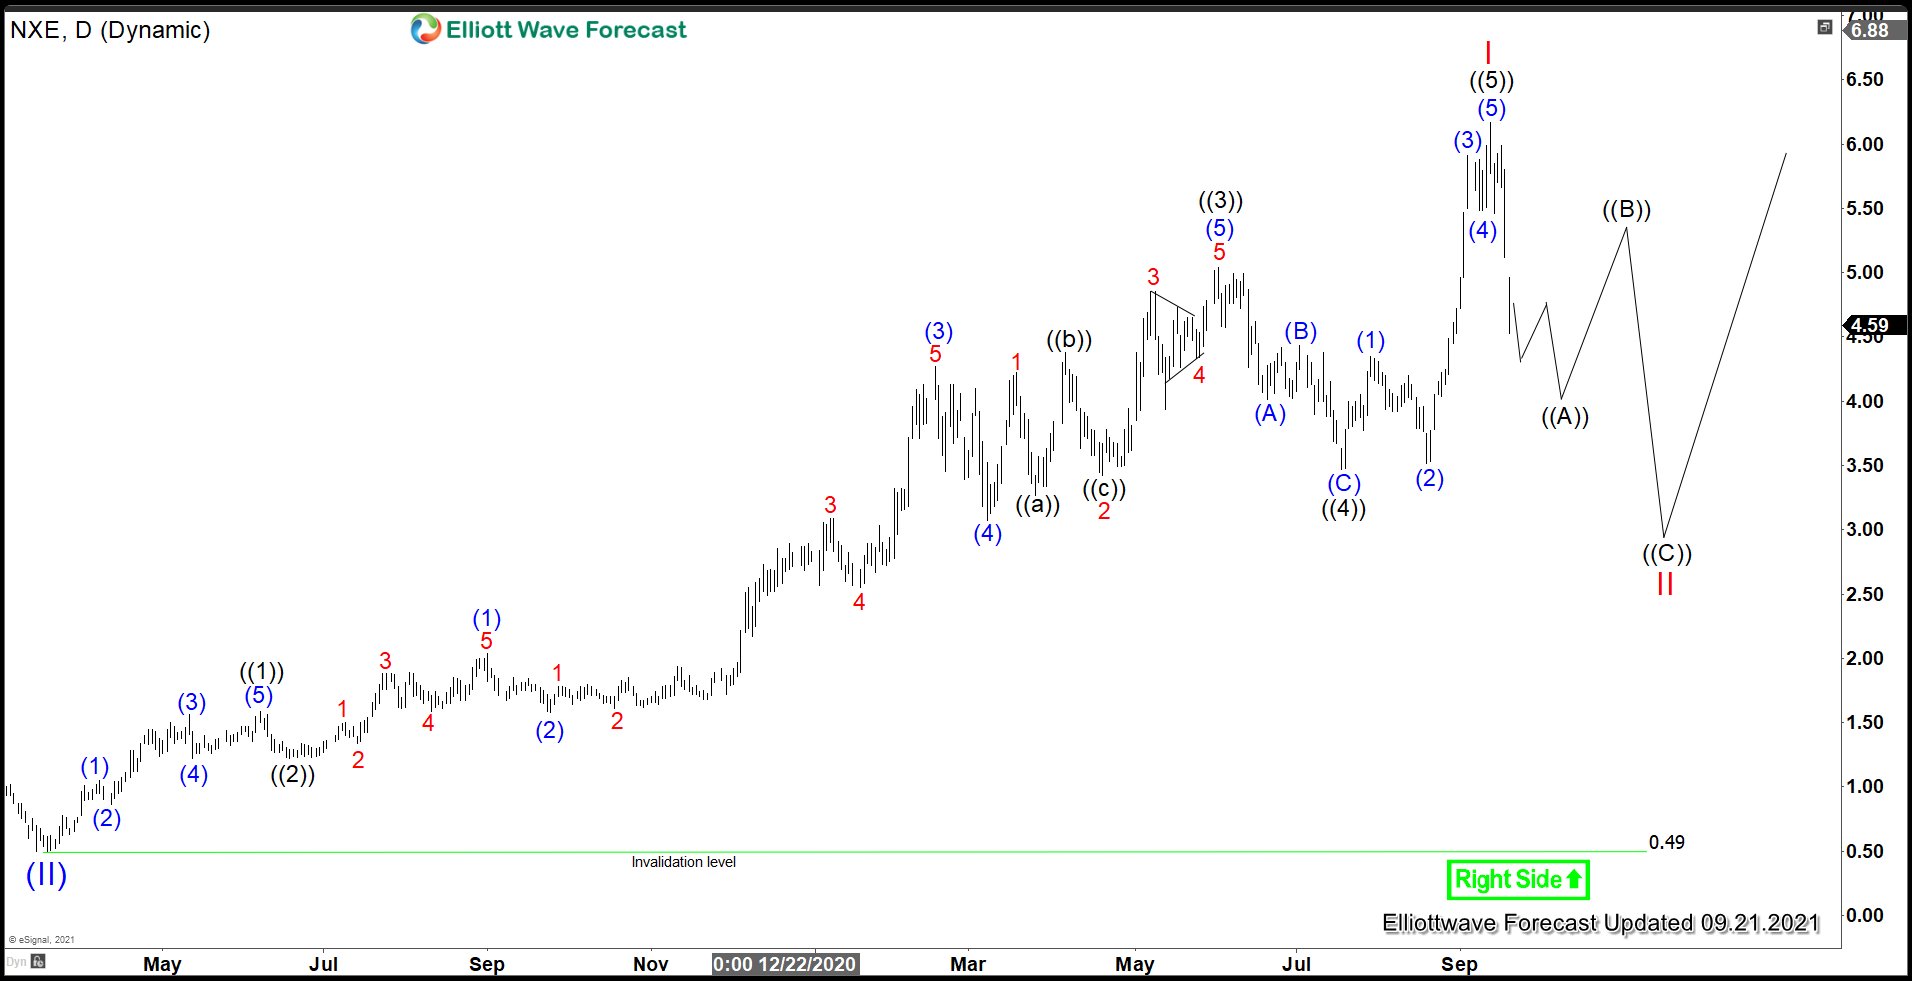
$NXE Daily Elliott Wave Chart
NXE Daily Chart above shows the stock has ended cycle from March 2020 low. Wave II of (III) pullback is in progress as a zigzag structure in which wave ((A)) of this zigzag remains in progress. After a 5 waves down and wave ((A)) ends, expect the stock to rally in wave ((B)) then turns lower 1 more time to complete wave ((C)) of II. As far as pivot at 0.5 low remains intact, expect further upside in the stock.
In this technical blog, we are going to take a look at the past performance of NZDUSD, 4-Hour Elliott wave Charts that we presented to our members. But before looking into the Charts, we need to understand the market nature first. The market always fights between the two sides i.e Buying or Selling. We at Elliott Wave Forecast understand the Market Nature and always recommend trading the no-enemy areas. We called blue boxes on our charts as no-enemy areas. They usually give us the reaction in favor of market direction in 3 swings at least. Now, let us take a quick look at the NZDUSD Charts and structure below:
NZDUSD 4 Hour Elliott Wave Chart
Above is the 4hr Elliott wave chart update from 9/02/2021. In which, the decline from February 2021 peak ended wave (W) at $0.6802 low. Up from there, the pair corrected the cycle from the February peak in wave (X) bounce. The internals of that bounce unfolded as Elliott wave zigzag structure where wave A ended at $0.6983 high. Wave B ended at $0.6929 & Wave C was expected to find sellers at $0.7112- $0.7225 blue box area. From there, sellers were expected to appear looking for more downside or for a 3 wave reaction lower at least.
NZDUSD Latest 4 Hour Elliott Wave Chart
This is the latest 4hr Elliott wave Chart from the 9/21/2021 update. In which the pair is showing a strong reaction lower taking place from the blue box area at $0.7112- $0.7225. Right after ending the zigzag correction within the blue box area. Allowed members to create a risk-free position shortly after taking the short positions at the blue box area. However, a break below $0.6802 low remains to be seen to confirm the next extension lower & avoid double correction higher. Note: later on with more data, we were able to upgrade the primary degree of the structure.