Elliottwave-Forecast

Master Trader
Feb 17, 2017
2,426
9
84
www.elliottwave-forecast.com
Hello fellow traders. Another instrument that we have been trading lately is NIKE stock. In this technical blog we’re going to take a quick look at the Elliott Wave charts of NIKE, published in members area of the website. As our members know, NIKE had incomplete bearish sequences in the cycle from the 01/21 peak, targeting 74.47-61.76 area . Consequently, we advised members to avoid buying NIKE and keep on selling the rallies in the sequences of 3,7,or 11 swings whenever get chance. In further text we’re going to explain Elliott Wave Forecast and Trading strategy.

NIKE 4 Hour Elliott Wave Analysis 3.10.2020
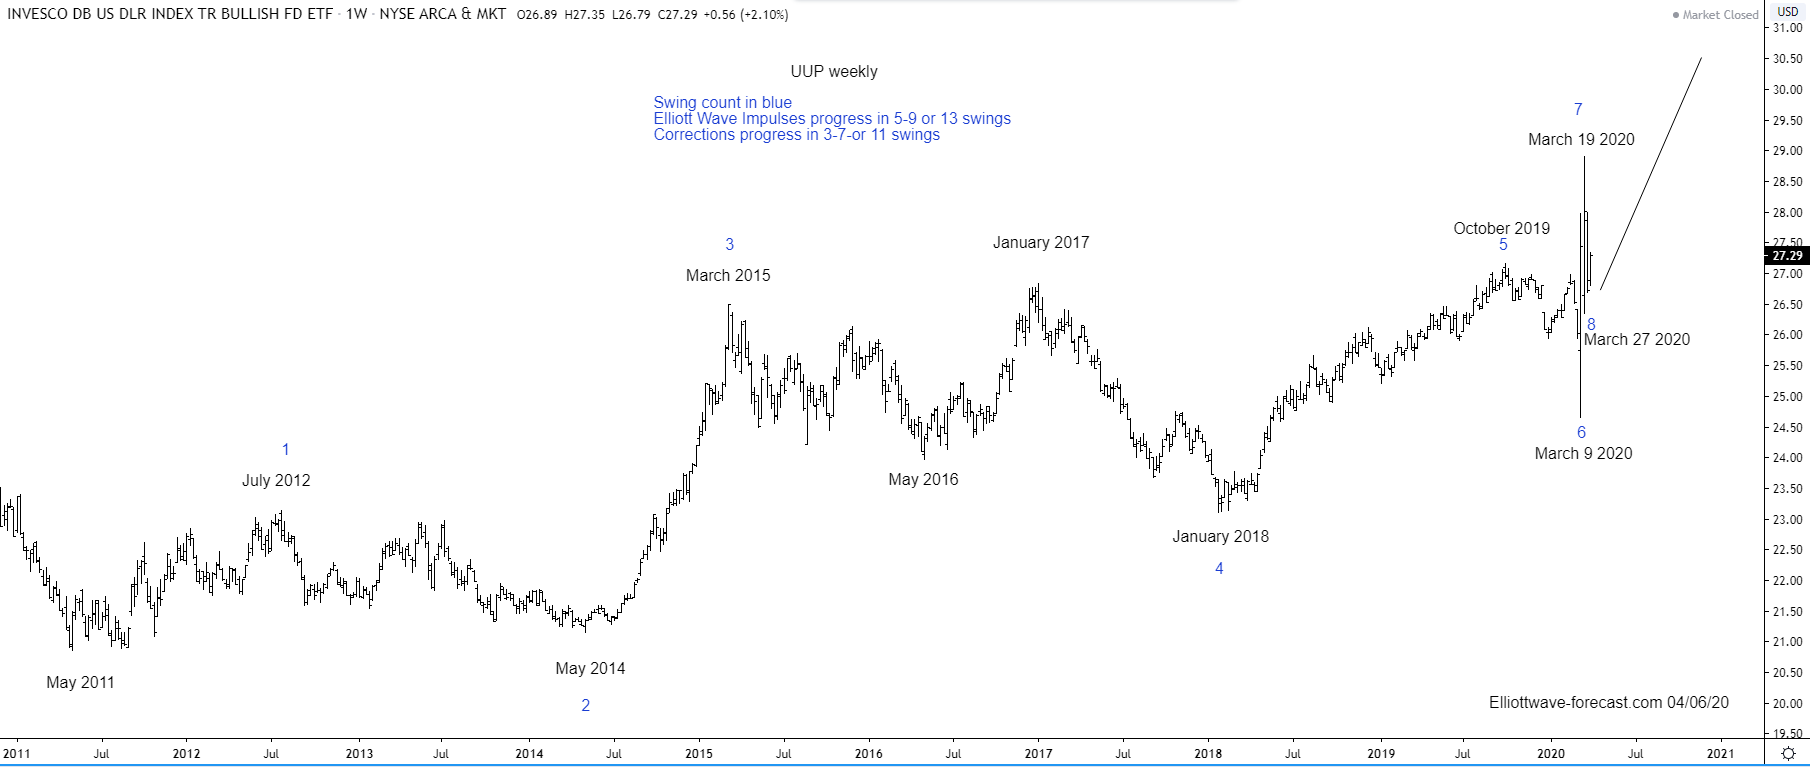
Break of 02/28 low made NIKE stock bearish against the 94.99 peak . Cycle from the January 21st peak looks incomplete now, calling for further weakness. We don’t recommend buying NIKE in any proposed recovery. Strategy is waiting for the clear 3 waves bounce and then sell the Index in 3,7,11 swings when get chance.

NIKE

NIKE 1 Hour Elliott Wave Analysis 3.10.2020
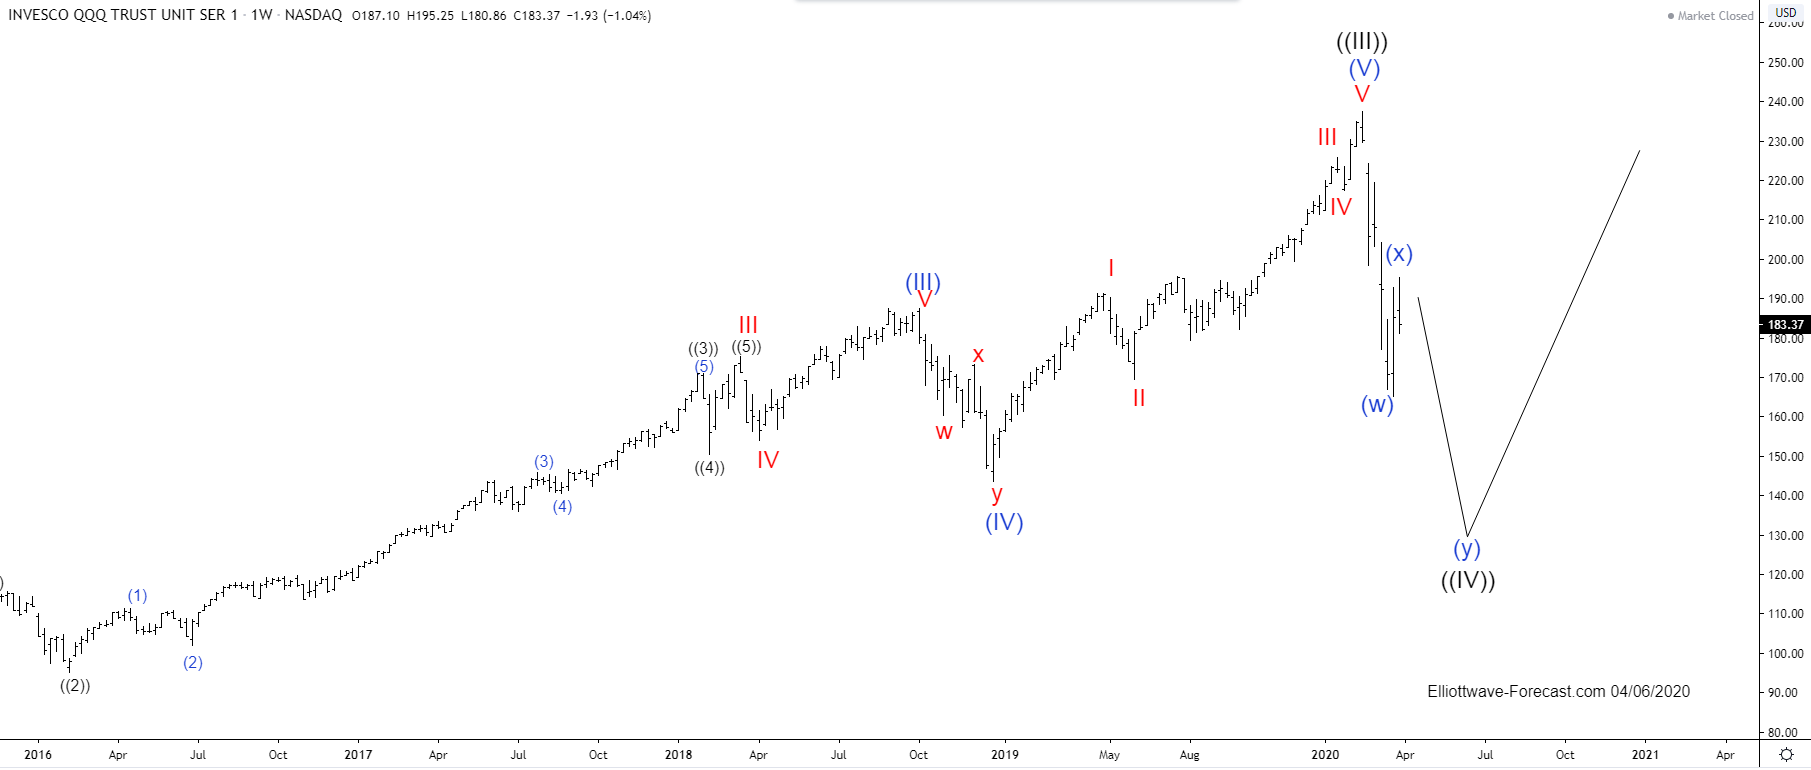
NIKE is correcting the cycle from the 94.99 peak. At this stage bounce looks incomplete. We got 5 waves up from the low, assuming we have ended only first leg of recovery. We expect to see another leg up toward 87.79-91.38 (sell area). At the marked blue box sellers should ideally appear for proposed decline or 3 wave pull back alternatively. We don’t recommend buying NIKE in proposed leg up, and favor the short side – selling the index in the blue box.


NIKE

NIKE 1 Hour Elliott Wave Analysis 3.10.2020
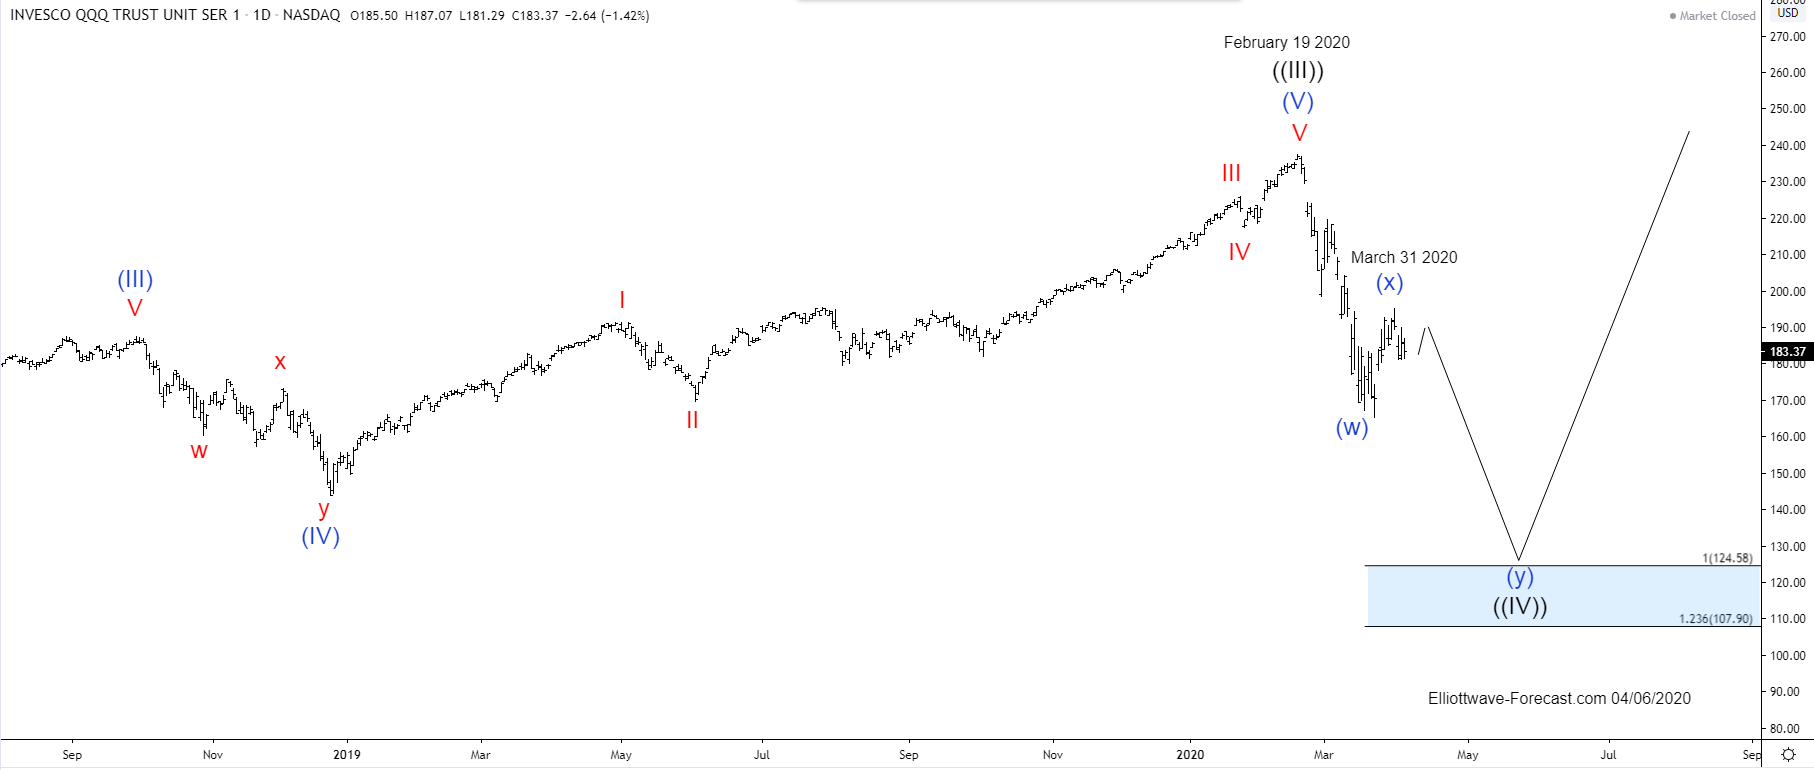
NIKE made expected leg up and reached selling area at 87.79-91.38( marked blue box). We like to be sellers there for proposed decline or 3 waves pull back at least.As our members know Blue Boxes are no enemy areas , giving us 85% chance to get a bounce. H1 Trend is bearish and we expect to see sellers in the blue box for further decline or 3 waves pull back at least. As soon as the pull back reaches 50 fibs against the B red low, we will make short positions risk free. Invalidation level for sellers is break above 1.618 fib extension: 91.38.

NIKE

NIKE 1 Hour Elliott Wave Analysis 3.12.2020
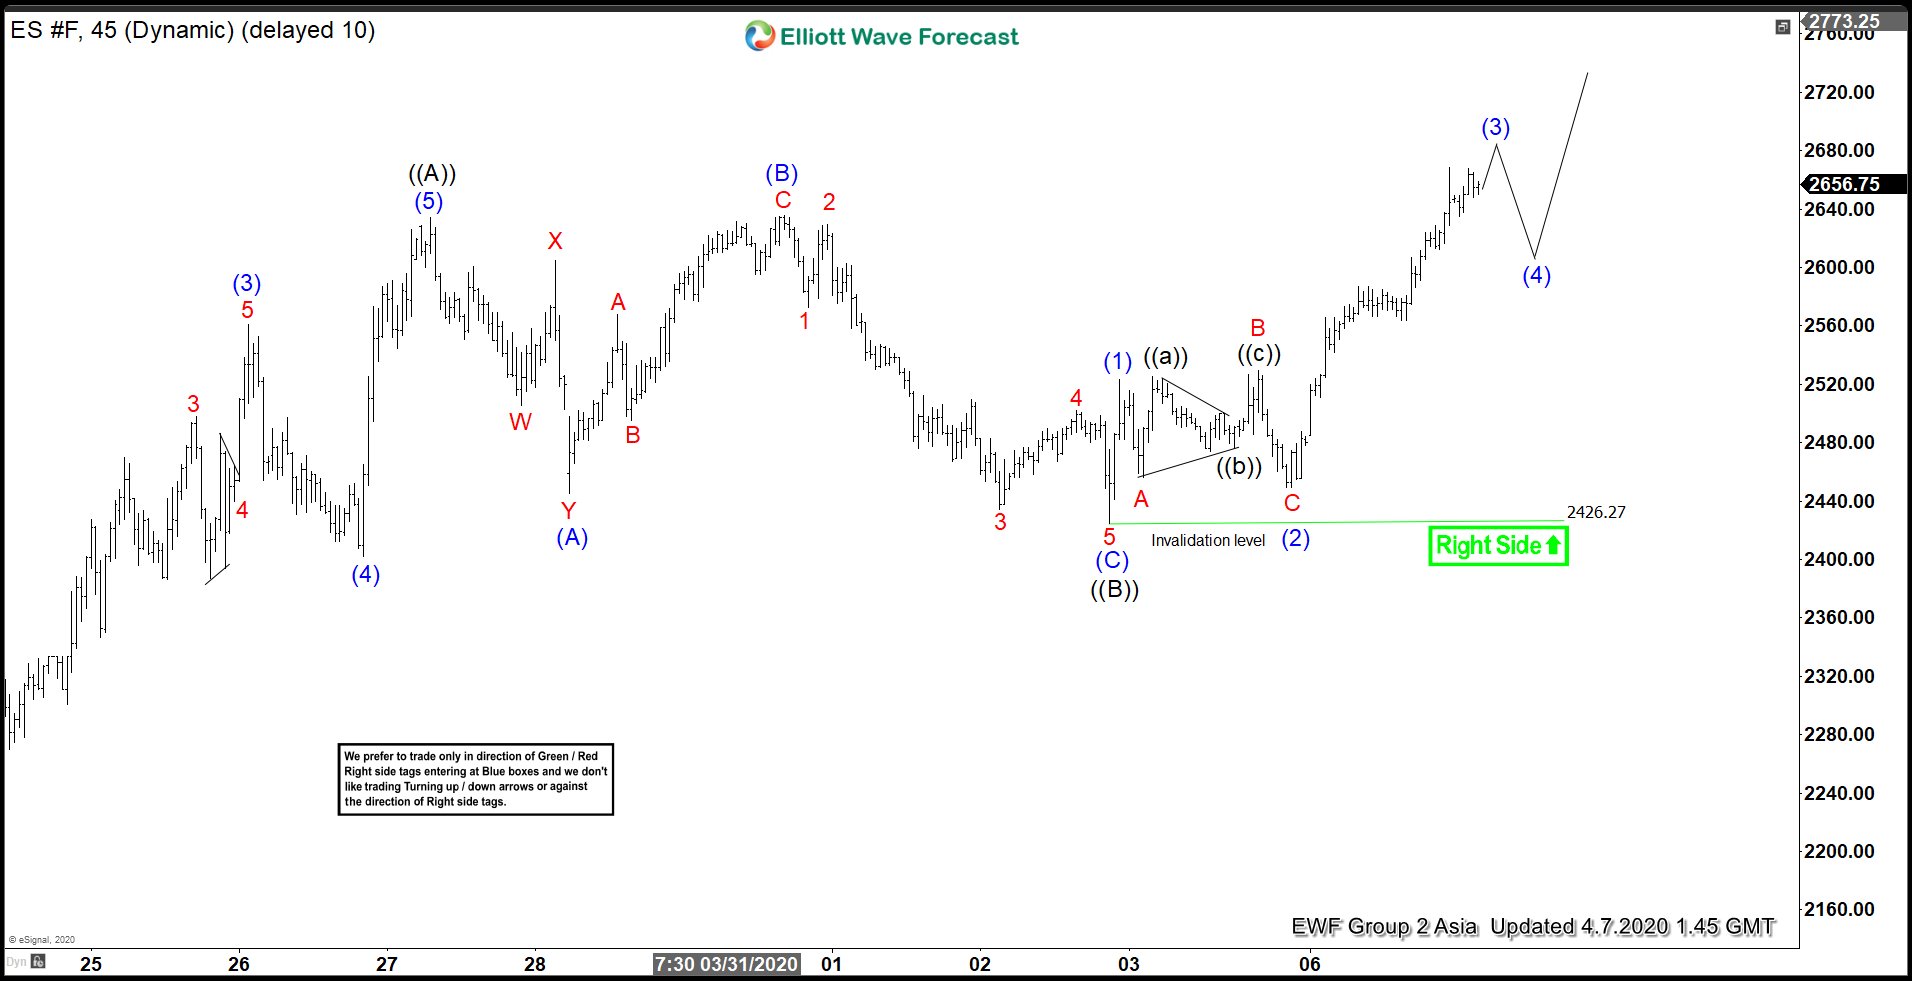
Sellers appeared right at the blue box and we got nice decline. The price has already made new low, confirming (C) wave is in progress. Wave (B) blue recovery completed at 88.4 high and stock is now bearish against that level, targeting 74.47-61.76 area.

It’s crucial to fully understand our official strategy: trading the equal legs and sequences in 3,7,11 swings. Combined with Trend Trading it gives you very powerful system that protects your account and makes you profit. If not already familiar with this strategy, all you have to do is to sign up for 14 days Free Trial and watch our Free Educational Video in membership area. If still having some questions after watching it, feel free to let us know and we will help. You can ask questions in 24 Hour Chat Room and in Live Analysis Sessions.

NIKE

Elliott Wave Forecast
 

Elliottwave-Forecast

Master Trader
Feb 17, 2017
2,426
9
84
www.elliottwave-forecast.com
On Friday, Bank of Canada (BOC) made another rate cut for the third time this month. The central bank lowered the interest rate by 50 basis points to 0.25%. This unscheduled rate cut is intended to provide support to the financial system and the economy during the COVID-19 pandemic. Prior to the cut, Canada has the highest rate among G7 countries. The central bank also announced two new programs: the Commercial Paper Purchase Program and the purchase of Canadian government securities in the secondary market. The government securities purchases will begin with a minimum of $5 billion per week, across the yield curve, the bank said in its statement.

The spread of COVID-19 is causing serious consequences for Canadian economy. With oil prices also continue to crater, it's likely that Canada could fall into a recession. BOC has stated that it is ready to take further action as required to support the economy and financial system. Meanwhile, the flight to safety amid concerns of the coronavirus spreading around the global could provide strength to the Japanese Yen. If the Canadian data continue to take a hit, CAD/JPY could see more weakness in the future.

CADJPY Weekly Chart Elliott Wave Update
CADJPY 3.30.20 weekly chart update

The weekly chart of CADJPY shows that the cycle from December 8, 2014 high is incomplete. The move down is unfolding as a zigzag structure. Wave a ended at 74.83 low and wave b bounce ended at 91.77 high. The pair is currently in wave c, where it is unfolding as an ending diagonal. While below 91.77 high, the pair can continue to extend lower. The 100% – 123.6% Fibonacci extension of wave a - b, where wave c can end is at 52.60-60 area.

CADJPY 3.28.20 4 Hour Weekend Elliott Wave Update
CADJPY 3.28.20 4 Hour weekend update

The 4 hour chart above shows that the bounce in wave (X) ended at 78.48 high, which is within the blue box area. From there, it has reacted lower. The pair now needs to break below wave (W) low at 73.76 to confirm that the next move lower is in progress. Otherwise, the pair can still do a double correction in wave (X).
 

Elliottwave-Forecast

Master Trader
Feb 17, 2017
2,426
9
84
www.elliottwave-forecast.com
$FXA Bearish Cycles From The July 2011 High

First the FXA ETF fund is the Australian dollar tracking fund that has an inception Date of 06/21/2006. With that said the fund mainly reflects the currency spot price of the AUDUSD forex pair. The data available from the Reserve Bank of Australia at their website suggests the spot price was 1.4875 back in 1973 to 1974 translates into an FXA price of around 148.75. Obviously that is a long term downtrend. The bearish cycle analysis suggests it can go lower to possibly retest those lows eventually.

Back before the FXA fund inception date, the AUDUSD spot currency price reached what is still the currency low in April 2001 at .4778. From there the currency pair went up in three swings until July 2011 at a high of 1.1080. That translates into the FXA ETF fund price high of 110.99 in July 2011. This is where the monthly Elliott wave analysis begins on the chart below.

The analysis continues below the monthly chart.


Secondly the decline from the aforementioned July 2011 highs does not seem legitimately able to count the whole cycle from there down to the January 2016 lows as a regular impulse by itself as a whole. The cycle lower in the blue wave (a) has been subdivided as an a-b-c in red. The instrument has since then bounced in three swings in what appeared to be a zig zag Elliott wave (b) that ended in January 2018.

The analysis continues below the weekly chart.


Thirdly since the wave (b) highs from January 2018 the instrument has declined in a relatively clean & clear 5 wave impulse in wave a to the October 2018 lows. A bounce to the December 2018 highs was technically strong. It suggested it was correcting the cycle from the January 2018 highs. The new lows since then gives it a bearish sequence to go along with the down trend.

In conclusion the equal legs of the larger blue (a) -(b) on the two charts shown above comes in at the 38.70 area. The 61.8 extension area of the (a)-(b) is at 55.00. This is a place where price may stall a little during the decline. The decline should continue lower most immediately while below the 12/31/19 highs, more importantly while below the December 2018 highs.
 

Elliottwave-Forecast

Master Trader
Feb 17, 2017
2,426
9
84
www.elliottwave-forecast.com
EURGBP Technical Analysis March 30/2020

EURGBP : There are clear visible bullish market patterns on the 1 hour chart but traders will still need to wait for more confirmation that a bottom will form and for price to bounce higher. Bullish AB=CD pattern triggers BUYS in the BC 1.27-1.618 Fib. levels. Price has already reached the 1.27 minimum Fib. level and have yet to see if this will be enough for the pair to bounce higher. If price moves below the BC 1.618 level then the bullish AB=CD pattern is invalidated. Another signal that EURGBP can bounce higher is bullish divergence seems to be forming or possibly formed which can also signal buyers to get in the market and push price higher. More confirmation of a possible bottom is when the pair starts to trade above the 50MA (blue) and also if price structure moves in a higher high / higher low sequence to confirm possible trend change. Bulls will be watching a break above 0.8987 level for now. Only time will tell what the pair will do but now you know what to watch for if EURGBP decides to bounce higher.

EURGBP 1 Hour Chart 3.30.2020

EURGBP, forex, trading, technical analysis, elliottwave, aidanfx, market patterns

Of course, like any strategy/technique, there will be times when the strategy/technique fails so proper money/risk management should always be used on every trade. Hope you enjoyed this article and follow me on Twitter for updates and questions> @AidanFX or chat me on Skype > EWF Aidan Chan

*** Always use proper risk/money management according to your account size ***

At Elliottwave-Forecast we cover 78 instruments (Forex, Commodities, Indices, Stocks and ETFs) in 4 different timeframes and we offer 5 Live Session Webinars everyday. We do Daily Technical Videos, Elliott Wave Trade Setup Videos and we have a 24 Chat Room. Our clients are always in the loop for the next market move.
 

Elliottwave-Forecast

Master Trader
Feb 17, 2017
2,426
9
84
www.elliottwave-forecast.com
Dow Jones Futures (YM_F) ended the cycle from February 13, 2020 high at 18086 as wave a. Down from February 13 high, wave ((1)) ended at 24675 and wave ((2)) ended at 27075. Wave ((3)) ended at 18766 and bounce in wave ((4)) ended at 20882. Finally, wave ((5)) of a ended at 18086. Wave b bounce remains in progress as a zigzag Elliott Wave structure. Up from 18066, wave ((A)) ended at 22545 as a 5 waves impulse. Wave (1) ended at 19804, and wave (2) pullback ended at 18101. Index then resumes higher in wave (3) towards 21892 and pullback in wave (4) ended at 20510. Finally, wave (5) of ((A)) ended at 22545.

Wave ((B)) pullback is proposed complete at 20778 and unfolded as a double three Elliott Wave structure. Down from 22545, wave (W) ended at 21316 and bounce in wave (X) ended at 22185. Wave (Y) of ((B)) ended at 20778. Index still needs to break above wave ((A)) at 22545 to confirm the next leg higher has started. Near term, expect wave ((C)) to extend higher and while dips stay above 20778, and more importantly above 18066 low, expect the Index to extend higher within wave ((C)). Potential target higher is 100% - 123.6% of ((A))-((B))-((C)) towards 25215 - 28078.

Dow Jones Futures (YM_F) 1 Hour Elliott Wave Chart
Elliott Wave View: Dow Jones Futures (YM_F) Can See Further Strength
 

Elliottwave-Forecast

Master Trader
Feb 17, 2017
2,426
9
84
www.elliottwave-forecast.com
Total SA is traded under tickers $FP @ Euronext and $TOT @ NYSE. It is of particular interest today as the world indices are dropping in a straight down mode. Hereby, Total may provide clues to identify the turning point in indices as it shows a pattern with the textbook quality. Since stocks are always bullish in their nature, correct determination of a corrective pattern may be used by investors as a key to enter the market at a reasonable price.

Total Weekly Elliott Wave Analysis 03.31.2020
Weekly chart below shows the Total stock $FP at Euronext. From the all time lows, first, it has developped an impulsive rally to the important top on 07.2007. The motive wave in blue wave (I) is of grand super cycle degree. It consists of 5 red subwaves of cycle degree. The waves I, III and V in their turn contain 5 subwaves of primary degree. From Elliott Wave theory, we know that after 5 waves advance a correction in 3 waves should follow.

The decline from 07.2007 highs to the 09.2011 lows is sharp and shows a 5 wave form. This is a sign that the correction lower is unfolding as an Elliott Wave Zigzag pattern. Consequently, we denote the first leg down as a red wave a. From 09.2011 lows, the rise towards the 09.2018 highs is overlapping and can be a double three pattern of wave b. Choppy patterns form frequently a connector wave, the middle part, within a zigzag.

Finally, the market was ready to extend lower in another leg down to end correction of the grand super cycle. From 09.2018 highs, the stock price has demonstrated two nests lower in waves ((1))-((2)) of primary degree and (1)-(2) of intermediary degree. As a consequence, a sharp fall in (3) of ((3)) has brought the prices to the equal legs extension area towards 22.65-14.79. From there, immediate reaction higher has been observed. As a matter of fact, blue boxes are high frequency areas where prices should resume the rally or to provide a 3 waves bounce at least.

Total Blue Box Elliott Wave Weekly

Total Outlook
While below 36-38, Total may extend lower in series of waves (4)-(5) of intermediary degree and ((4))-((5)) of primary degree. In fact, these are required to resolve the two nests below the peak on 09.2018. Therefore, the stock should see two new lows towards 20-15. Until all necessary swings are in place, the stock should find pressure from sellers. Investors should consider buying from the blue box area at 22.65-14.79. As a prerequisite for more upside, however, observation of two swings lower is mandatory. Only then, investors may enter the market. Once the important bottom is in place, Total may extend towards 65 and higher along with oil prices and world indices.
 

Elliottwave-Forecast

Master Trader
Feb 17, 2017
2,426
9
84
www.elliottwave-forecast.com
Back in October 2019, we mentioned that SEKJPY had reached extreme area down from September 2017 peak and should bounce soon in 3 or 7 swings which should fail for more downside. In this article, we will look at the price action which followed since then and what is expected next in the pair. First of all, let's take a look at the chart from October 2019.

SEKJPY Swing Sequence Chart 10.9.2019
As the chart below shows, back in October 2019, pair showed 5 swings down from January 2014 peak and at the same time, it had reached 100% Fibonacci extension of the 1st leg down from September 2017 peak and therefore, we expected cycle from September 2017 peak to end in the blue box between 10.728 - 9.386 and pair to bounce in 3 or 7 swings before resuming the decline toward 9.009 - 7.799 area.

SEKJPY Weekly chart 10.9.2019

SEKJPY Swing Sequence Chart 3.31.2020
In the chart below we can see pair did bounce from the blue box area between 10.728 - 9.386 and has already made a new low below September 2019 low and previously it had an incomplete sequence down from January 2014 peak and now it has another incomplete bearish sequence down from September 2017 peak and should see more downside as far as bounces stay below December 2019 peak.

SEKJPY Swing Sequence chart 3.31.2020

SEKJPY Elliott Wave Analysis - 8 Hour Chart - 3.31.2020
In the chart below, we look at the structure of the decline down from 12.29.2019 peak and what is expected next. Decline from 11.75 (12.29.2019) peak to 10.41 (3.18.2020) low could be counted as an 11 swings Elliott wave diagonal structure. We have labelled this as wave (A) and the corrective bounce to 11.09 is labelled as wave (B) completed. As bounces fail below 11.09 peak, we expect the pair to resume the decline for a new low below 10.41 ideally reaching 9.76 area. If pair fails to break below 10.41 low and breaks above 11.09 high, then we should still be in wave (B) and it could test 11.36 - 11.52 before resuming the decline. We don't like buying the pair and favor more downside as far as 11.09 high and more importantly 11.75 high remains intact.

SEKJPY 8 Hour Elliott Wave Analysis
 

Elliottwave-Forecast

Master Trader
Feb 17, 2017
2,426
9
84
www.elliottwave-forecast.com
Intel is a very important component for the Semiconductor industry. It is the #2 holding in in both the SOXX ETF, and the SMH ETF. With such a strong weighting in the overall sector, it has much influence over the direction of the industry as a whole. Most recently, Intel has declined with the broad indices, in one of the fastest declines ever witnessed. So what is in store for Intel after this decline? Today I'll go over some long term and short term counts to help clarify what the future may hold.

Intel Elliott Wave Weekly
Intel

Generally speaking, INTC is closely aligned with the major American Indices at the present time. For the most part, the current climate in the indices will control the price movement with Intel in the Medium term. On a weekly time frame, our view is that Intel is correcting the cycle from the 2009 lows set on Feb 23/2009 at 12.05. From those lows, Intel has formed a 5 waves sequence and topped in Blue (I) on Jan 24/2020 at 69.29. Our current expectation is for a 3 waves correction in Blue (II) to present itself before a long term bottom can materialize.

Wave red a has been set on Mar 16/2020 at a low of 43.63. From there a bounce in 3 waves at least is expected to take place in red b. From there it should head lower in wave red c of Blue (II). It is also possible that the whole decline in Blue (II) is complete at the recent lows. At this time, we do not favour that with the current data we have.

Intel Elliot Wave 4H View
Intel

Our view is that Intel has declined from the All Time Highs in an impulsive 5 waves move. It is important to realize that Elliot Wave is suggestive. As much as we are expecting another low in the Indices, we will follow the data and price action as it reveals itself. With this said, Intel can be done the decline in Blue (II). However the current data we have suggests to us that another lower low is favoured at the present time. Red b is taking shape as a double correction from the recent lows. Once Red b is complete, it is favoured that Intel head down for red c of Blue (II) to complete the correction from the All Time Highs.
 

Elliottwave-Forecast

Master Trader
Feb 17, 2017
2,426
9
84
www.elliottwave-forecast.com
EURUSD shows an incomplete sequence from Feb 16, 2018 high favoring further downside while below March 9 high (1.1496). Near term, the decline from March 9, 2020 high (1.1496) ended wave ((1)). Bounce in wave ((2)) is unfolding as a zigzag Elliott Wave structure where wave (A) ended at 1.1147. Internal of wave (A) unfolded as a 5 waves impulse. Up from March 23 low (1.063), wave 1 of (A) ended at 1.088 and pullback in wave 2 of (A) ended at 1.074. Pair resumes higher in wave 3 of (A) towards 1.1086, and wave 4 of (A) pullback ended at 1.0952. Final leg wave 5 of (A) ended at 1.1147.

Wave (B) pullback remains in progress as a zigzag where wave A ended at 1.092. as 5 waves. Down from 1.1147, wave ((i)) of A ended at 1.1103, and wave ((ii)) of A ended at 1.114. Wave ((iii)) of A ended at 1.098 and wave ((iv)) of A bounce ended at 1.103. Final leg wave ((v)) of A ended at 1.092. While wave B bounce fails below 1.1147, expect pair to extend lower in wave C of (B) before turning higher again in wave (C). As far as the pullback stays above 1.063, expect pair to extend higher to continue the rally to correct cycle from March 9, 2020 high.

EURUSD 1 Hour Elliott Wave Chart
Elliott Wave View: EURUSD Bounce May Extend
 

Elliottwave-Forecast

Master Trader
Feb 17, 2017
2,426
9
84
www.elliottwave-forecast.com
Expedia is showing a well-defined Elliott Wave pattern across the market place. The Elliott Wave Principle is a form of technical analysis which we use to analyze price action and forecast the future path. Ralph Nelson Elliott proposed that market prices unfold in specific patterns which alternate between impulsive and corrective phase. The most popular structure is the impulsive advance which subdivides into a set of 5 lower-degree waves.

The subdivision alternates between motive and corrective phase. Waves 1, 3, and 5 are impulses, whereas waves 2 and 4 are smaller retraces of waves 1 and 3 and therefore corrective. The idea is that when the price action shows a five waves advance, there will be a follow up advance in the same direction after a 3 waves correction. The following chart shows the pattern with each lower degree subdivision.


As we can see, the three impulses within the primary impulse follow a sequence of 5-9-13-17-21 until it ends at the top. This price action repeats in each time frame or degree. After the cycle ends, then market will start a new cycle, which, most of the time, develops in an ABC. Ideally, after the ABC lower ends, then a new cycle higher will start providing traders with a trading opportunity.

EXPE (EXPEDIA) shows a textbook five waves advance within the Grand Super Cycle. The price action shows three impulses higher in the Blue Degree, i.e. wave (I), wave (III), and wave (V). The entire 5 waves advance ended at 07.2017. Since then, the price is showing an ABC lower, which is in the finals step. Once the pullback is complete, the trend should renew to the upside. The following chart shows the idea:

Expedia Monthly Elliott Wave


Right now, we should be in the wave IV red, within the (c) blue, which is part of the ((II)) Black. As we always do at EWF, we will show the most aggressive view. In this case, it means the entire decline is wave ((II)) and the stock can soon resume to new high. The alternate view is that price will turn higher soon into the $110.00-$120.00 area. Afterwards, it resumes lower again to complete a seven swings correction lower.

We want to make the point that in correctives patterns, market moves in a series of 3-7-11-15-19. As of right now, nothing indicates there will be a seven swing, so this dip is a great chance to buy as soon as there is a confirmation that wave ((II)) has ended. The Elliott Wave Theory is calling Expedia higher, and we believe the world will soon be traveling again after the shutdown due to corona virus.
 

Elliottwave-Forecast

Master Trader
Feb 17, 2017
2,426
9
84
www.elliottwave-forecast.com
EURAUD shows incomplete sequence from March 19, 2020 high, favoring further downside. The internal of the decline from March 19 (1.98) high is unfolding as a double three Elliott Wave structure. Down from 1.98 high, wave ((W)) ended at 1.802 and wave ((X)) bounce ended at 1.875 as a running Flat. Pair has resumed lower in wave ((Y)) which is unfolding as a zigzag.

Down from 1.875, wave 1 ended at 1.782, and wave 2 bounce ended at 1.857. Pair then resumed lower in wave 3 towards 1.772 and wave 4 bounce ended at 1.812. Pair then ended the last leg lower wave 5 at 1.766. The 5 waves move lower ended wave (A) of the zigzag. Wave (B) is now in progress to correct cycle from March 23 high before pair resumes lower again. Internal of wave B is unfolding as a zigzag. Up from 1.766, wave A ended at 1.808. While pullback in wave B stays above 1.766, expect pair to extend higher in wave C of (B) before the decline resumes. Potential target lower is 100% - 123.6% Fibonacci extension from March 19 high which comes at 1.655 - 1.697 area.

EURAUD 1 Hour Elliott Wave Chart
Elliott Wave View: EURAUD Can See More Downside
 

Elliottwave-Forecast

Master Trader
Feb 17, 2017
2,426
9
84
www.elliottwave-forecast.com
In this technical blog, we are going to take a look at the past performance of 1 hour Elliott Wave Charts of Sugar, which we presented to members at elliottwave-forecast. In which, the decline from February 2020 peak, showed the lower low sequence in an impulse structure favored more downside to take place.

But before further digging into the Charts, we need to understand the market nature first. The market always runs between the two sides i.e Buying or Selling. We at Elliott Wave Forecast understand the Market Nature and always recommend trading the no enemy areas. Those areas are reflected as the blue box areas on our charts. They usually give us the reaction in favor of market direction in 3 swings at least. Now, let us take a quick look at the Sugar 1 Hour Charts and structure below:

Sugar 1 Hour Elliott Wave Chart
Sugar Elliott Wave View: Selling The Wave 4 Bounce

Sugar 1 Hour Elliott Wave Chart from 3/27/2020 London update. In which, the instrument is showing an impulse decline where wave (2) ended at $15.20 high. Down from there, wave (3) unfolded in a lesser degree 5 wave structure where wave 1 ended at $13.86 low. Wave 2 ended at $14.40, wave 3 ended at $12.18, wave 4 ended at $12.65 and wave 5 ended at $10.44 low. Up from there, the Sugar made a 3 wave bounce in wave (4). The internals of that bounce unfolded as a zigzag structure where wave A ended at $11.19. Wave B ended at $10.72 low and wave C ended at $11.68 high. After seeing sellers at the blue box area i.e $11.51-$11.99 100%-161.8% Fibonacci extension area of A-B. From there, Sugar was expected to resume lower or to do a 3 wave reaction lower at least.

Sugar Latest 1 Hour Elliott Wave Chart
Sugar Elliott Wave View: Selling The Wave 4 Bounce

Here's the Latest 1 Hour Chart of Sugar from 4/02/2020 Asia update. In which, the instrument is showing reaction lower from the blue box area. Allowed members to create a risk-free position shortly after taking the short positions.
 

Elliottwave-Forecast

Master Trader
Feb 17, 2017
2,426
9
84
www.elliottwave-forecast.com
In this article, we look at the long-term view of IBM which we believe ended an Elliott Wave Grand Super Cycle from all time the low and is currently correcting that cycle. We will look at the preferred structure of the pull back, where we are within the correction, what is the swing sequence suggesting and also highlight an area that could be interest to the long-term investors. Let's start by taking a look at the quarterly chart of IBM below.

IBM Long-Term Elliott Wave Analysis
Chart below shows a complete 5 waves move up from it's all time low when wave (I) ended at 43.97 in 1987, wave (II) completed at 10.16 in 1993, wave (III) completed at 139.19 in 1999 and wave (IV) completed at 54.01 in 2002, wave (V) was extended and completed at 215.90 in 2013. According to Elliott Wave Theory, once a 5 waves move is complete, market should correct the 5 waves move and this corrective move could take different forms.

IBM Weekly Elliott Wave Analysis

IBM Weekly Elliott Wave Analysis - 4.2.2020
Chart below is the weekly chart and provides a closer look at the structure of correction which started way back in 2013. Initial decline from March 2013 peak to February 2016 low was a Zigzag Elliott wave structure. This was followed by a 3 waves bounce to 182.79 (February 2017) after which stock dropped below February 2016 low creating an incomplete sequence against February 2017 peak. Stock then saw another recovery which ended in February 2020 and we have now seen a breach of December 2018 low, if we count the number of swings down from blue (x) peak, we can count 5 swings down and it's not an impulse or a diagonal because the biggest correction is in the middle. This means the swing sequence down from blue (x) peak is incomplete and while below February 2020 peak, stock should ideally make another push lower to complete 7 swings down from blue (x) peak. Ideal target area is between 82.73 - 59.15 which is 100 - 123.6% Fibonacci extension area of blue (w)-(x) cycles. 161.8 Fibonacci extension comes at 21.05 and as it's a corrective decline we would expect it to stay above this level and then stock would have a chance to resume the rally in the next leg of the Grand Super Cycle.

IBM Weekly Elliott Wave Analysis
 

Elliottwave-Forecast

Master Trader
Feb 17, 2017
2,426
9
84
www.elliottwave-forecast.com
Short term Elliott Wave view in EURJPY suggests the decline from January 14, 2020 high is unfolding as a 5 waves impulse structure. Down from Jan 14 high, wave (1) ended at 116.13 and wave (2) bounce ended at 121.15. Pair is proposed to have resumed lower in wave (3), although pair still needs to break below wave (1) at 116.13 to validate the view.

Down from wave (2) high a 121.17, wave ((i)) ended at 118.77 as 5 waves and wave ((ii)) bounce ended at 120.34. Wave ((iii)) remains in progress as 5 waves with extension. Wave (i) of ((iii)) ended at 118.77, and wave (ii) of ((iii)) ended at 119.7. Pair extended lower in wave (iii) of ((iii)) towards 116.31, and wave (iv) of ((iii)) ended at 117.49.

Near term, expect pair to extend lower in wave (v) of ((iii)). Afterwards, it should bounce in wave ((iv)) before the final leg lower in wave ((v)) of 1. As far as the rally fails below 121.17, expect pair to extend lower. Potential target lower is 100% - 123.5% Fibonacci extension from January 14, 2020 high which comes at 112.71 - 114.32.

EURJPY 1 Hour Elliott Wave Chart
Elliott Wave View: EURJPY Resumes Downside
 

Elliottwave-Forecast

Master Trader
Feb 17, 2017
2,426
9
84
www.elliottwave-forecast.com
Hello fellow traders. In this technical blog we’re going to take a look at the Elliott Wave charts of COFFEE Futures ( $KC_F ) published in members area of the website. The Commodity corrected the cycle from the 142.78 peak recently, when recovery unfolded as Regular Elliott Wave Flat structure. In further text we’re going to explain the forecast and Elliott Wave Pattern.
Before we take a look at the real market example of Expanded Flat, let’s explain the pattern in a few words.

Elliott Wave Regular Flat Theory
Elliott Wave Regular Flat is a 3 wave corrective pattern which could often be seen in the market nowadays. Inner subdivision is labeled as A,B,C , with inner 3,3,5 structure. Waves A and B have forms of corrective structures like zigzag, flat, double three or triple three. Third wave C is always 5 waves structure, either motive impulse or ending diagonal pattern. Wave C of completes usually at equal legs -1.618 Fibonacci extension of A related to B, but sometimes it could go up above 1.618 fibs ext.

At the graphic below, we can see what Regular Flat structure looks like.


COFFEE 4 Hour Elliott Wave Analysis 3.25.2020.

Recovery against the 142.78 peak is unfolding as Elliott Wave Flat Structure. Waves (A) and (B) blue have corrective- 3 waves structures. They unfolded as ZIG ZAG patterns with ABC red inner labeling, while wave (C) blue is unfolding as 5 waves rally. As we can see on the chart below COFFEE has already reached the Blue Box : 126.7-142.19. We expect Flat to complete there and sellers to appear for a 3 waves pull back at least .

You can learn more about Elliott Wave FLAT Patterns at our Free Elliott Wave Educational Web Page.


Coffee

COFFEE 4 Hour Elliott Wave Analysis 4.2.2020.
COFFEE found sellers at the blue box area:126.7-142.19. We ended wave ((2)) as Elliott Wave Flat pattern. We got nice decline from the blue box and expect to see further extension down.

Keep in mind not every chart is trading recommendation. Turning Black arrows shows the path we prefer , but highest probability path is not the same as highest probability trade. Best instruments to trade are those having incomplete bullish or bearish swings sequences. We put them in Sequence Report and best among them are shown in the Live Trading Room. You can check most recent charts of COFFEE in the membership area of the site.

COFFEE

Elliott Wave Forecast
 

Elliottwave-Forecast

Master Trader
Feb 17, 2017
2,426
9
84
www.elliottwave-forecast.com
The $UUP Bullish Cycles from May 2011 Lows

Firstly the dollar tracking ETF fund $UUP inception date was 2/20/2007. Interestingly the dollar index has a low in March 2008. The $UUP ETF fund shows a low in May 2011. The dollar index did make a pullback cycle low in May 2011 however it was well above the March 2008 lows. The bullish cycle up from the May 2011 lows in $UUP is the focus of this analysis where it begins on the monthly chart. It should see some further upside before any larger size pullbacks relative to the longer term cycles.

The analysis continues below the $UUP monthly chart.


Secondly the bullish cycle up from the May 2011 lows in $UUP appears to be advancing higher with some overlap in the cycles. This is as per would any diagonal. However price has got above the January 2017 highs giving the dollar representative instrument a bullish sequence. From the May 2011 lows the dollar instrument appears to have at least 4 swings in place to the January 2018 lows. From there according to the momentum indicators used here it ended a cycle up at the October 2019 highs in a 5th swing. The pullback into the March 9 2020 lows was the 6th swing. It was strong enough to suggest it was 6th swing correcting the cycle up from the January 2018 lows.

The analysis continues below the $UUP weekly chart.


Thirdly and in conclusion, the swing and Elliott Wave count suggests further upside in the dollar. March 2020 has seen some fast 6th, 7th & 8th swings. The dollar is bullish while near term dips lower show they will remain above the March 9 2020 lows, more ideally the March 27 2020 lows. It can see further strength higher toward the 30.96 area before a significant turn back lower.
 

Elliottwave-Forecast

Master Trader
Feb 17, 2017
2,426
9
84
www.elliottwave-forecast.com
The $QQQ Nasdaq Tracker Long Term Cycles & Elliott Wave

Firstly the QQQ instrument inception date was in March 1999. That was before it ended a larger cycle up from the all time lows in March 2000. The ETF instrument mirrors the price movement of the Nasdaq which did that. As shown below from the March 2000 highs the instrument experienced a steep correction lower in three swings to the October 2002 lows. From there to the October 2007 highs it ended the first of the current series of impulses in the blue color. This makes up the subdivisions of the wave ((III)) that has ended on February 19 2020. I have identified the next area for buyers in the current steep sell off.

As can be seen, the pullback from the October 2007 highs was in 3 swings that ended in November 2008. This corrected the cycle up from the October 2002 lows. The wave I was extended in the subdivision of wave (III). The wave II low created in August 2015 was strong enough to suggest it was correcting the cycle the November 2008 lows. Equally the same thought applies to the move up from there into the August 2018 wave (III) high.

Additionally it appeared the wave IV was only deep enough to be correcting the cycle from the August 2015 low. Afterward it saw another high in August 2018. The wave (IV) into the December 2018 lows was strong. It suggested it had corrected the cycle from the November 2008 low.

The analysis and commentary continues below the QQQ monthly chart.


Secondly as previously suggested the QQQ instrument mirrors the Nasdaq highs & lows. As already mentioned, the cycle up from the October 2002 lows ended February 19 2020. It is now correcting the cycle up from the October 2002 lows. As known, impulses progress in 5-9 & 13 swings. Corrections against the trend proceed in 3-7 or 11 swings. This current correction is three swings so far however believe there will be three more.

The analysis and conclusion continues below the QQQ weekly and daily chart.


In conclusion the instrument can see a pullback lower of the same magnitude as like in the March 2000 highs to October 2002 lows in the current wave ((IV)) before turning higher again. Although steep this is a three swing pullback correction that has already seen 3 swings lower. It should see three more. As can be seen, the 124.58-107.90 area shown on the daily chart can be reached. This is provided the condition of price remaining below the March 31 2020 highs. Price back above there would suggest it still remained in the blue wave (x) and after completing 3 more swings higher it would require the buying extension area be remeasured.
 

Elliottwave-Forecast

Master Trader
Feb 17, 2017
2,426
9
84
www.elliottwave-forecast.com
S&P 500 E-Mini Futures (ES_F) broke above last week's high at 2635.75 and shows incomplete sequence from 3.23 low, favoring further upside in near term. Short Term Elliott Wave suggests the rally from 3.23 low (2174) is unfolding as Elliott Wave zigzag structure. Up from 3.23 low, wave ((A)) ended at 2634.5.

Internal of wave ((A)) unfolded as 5 waves impulse where wave (1) ended at 2386 and wave (2) ended at 2179.5. Index resumed higher again in wave (3) towards 2560.75, and wave (4) ended at 2402.25. The last leg wave (5) ended at 2634.5 which also completed wave ((A)). Pullback in wave ((B)) unfolded as an Expanded Flat structure. Wave (A) ended at 2445, wave (B) ended at 2635.75, and wave (C) of ((B)) ended at 2426.27.

Wave ((C)) remains in progress as 5 waves impulse where wave (1) ended at 2523, and wave (2) ended at 2449. Near term, while dips stay above 2426.27, expect Index to extend higher within wave (3). It should then pullback in wave (4) then extend higher again in wave (5) of ((C)). Potential target for wave ((C)) is 100% - 123.5% Fibonacci extension from 3.23 low which comes at 2888 - 2997.

S&P 500 Futures (ES_F) 1 Hour Elliott Wave Chart
 

Elliottwave-Forecast

Master Trader
Feb 17, 2017
2,426
9
84
www.elliottwave-forecast.com
Zoom Video Communications Inc (NASDAQ: ZM) is an American remote conferencing services company that combines video conferencing, online meetings, chat, and mobile collaboration.

The stock has gained 90% since February before giving up half of the gains last week , while the majority of stocks has plunged over 20%. That puts ZM as one of the favored stocks during this pandemic as people across the world are stuck indoors with the spreads of Corona virus and they’re turning to video calls to chat with friends, family members, colleagues, classmates and customers. and there are any number of free services. Unlike other Apps, Zoom is available on IOS, Android and on any laptop and anyone can use it because it's free.

The recent popularity of the Zoom made investors jump into the stock to use it as a hedge to their bleeding portfolio, but is still the right time to buy it ?

Looking at the Elliott Wave Structure of the stock from last year, ZM established an impulsive rally since IPO last year which is looking to unfold either as a bullish nest or a simple 5 waves advance. The nest scenario which we'll discuss in this article is the most bullish scenario at this stage suggesting that current correction is wave II of (III) which indicates that Zoom is still in the early stage of a bullish trend.

Looking at the current correction we can define 2 paths:

1- ZM is only ending the first leg ((A)) of a 3 waves zigzag structure to correct the cycle from October 2019 low and short term bounce ((B)) will be expected to fail below $174.9 peak before another leg lower ((C)) takes place to finish wave II which would represent a buying opportunity later on then the stock will turn higher again.

ZM Daily Chart
ZOOM ZM Daily Chart

ZM 1 Hour Chart
ZOOM ZM 1H Chart

2- ZM is already ending the corrective 3 waves Zigzag structure around equal legs area $117- $89 where buyers are expected to show up looking for the stock to resume the rally within the main trend which in this case would represent a trading opportunity even for the short term. However, the stock would need a break above 3/24 peak to confirm the continuation higher within a new bullish cycle.

ZM Alternative Daily Chart
ZOOM ZM Alt Daily Chart

ZM Alternative 1 Hour Chart
ZOOM ZM Alt 1H Chart

Consequently, Zoom current structure is supporting the stock into the future even if it ends up finishing a 5 waves advance just after making new all time highs it would still find buyers during the next correction in 3, 7 or 11 swings based on the initial impulsive rally which the stock established since IPO.