Elliottwave-Forecast

Master Trader
Feb 17, 2017
2,460
9
84
www.elliottwave-forecast.com
The Dow Jones Transportation Average ($TRAN) is a running average of the stock prices of twenty transportation companies with each stock's price-weighted to adjust for stocks and other factors. As a result, it can change at any time the markets are open. The figure mentioned in news reports is usually the figure derived from the prices at the close of the market for the day. Some of the components of the Index like $AAL, $DAL among others have experienced huge declines to the point that $DAL is correcting Grand Super Cycle whereas $AAL is correcting Super Cycle degree as we are showing in the following chart:

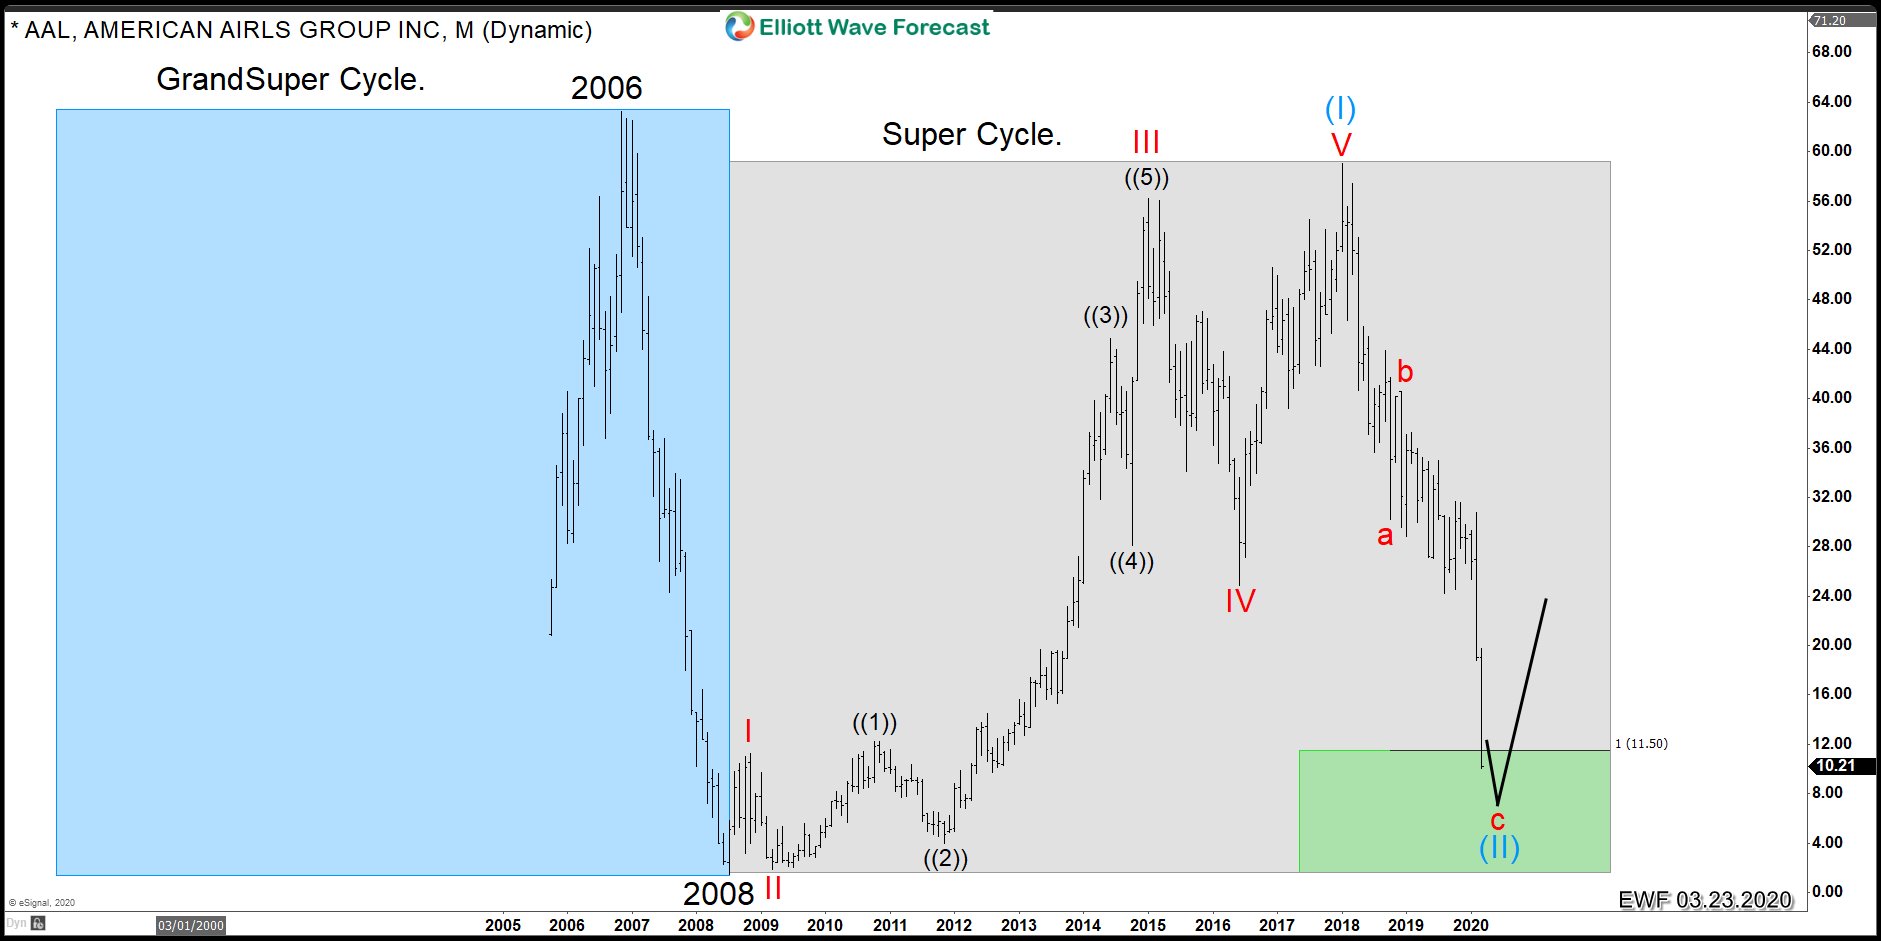
AAL Correcting Super Cycle from 2008 low

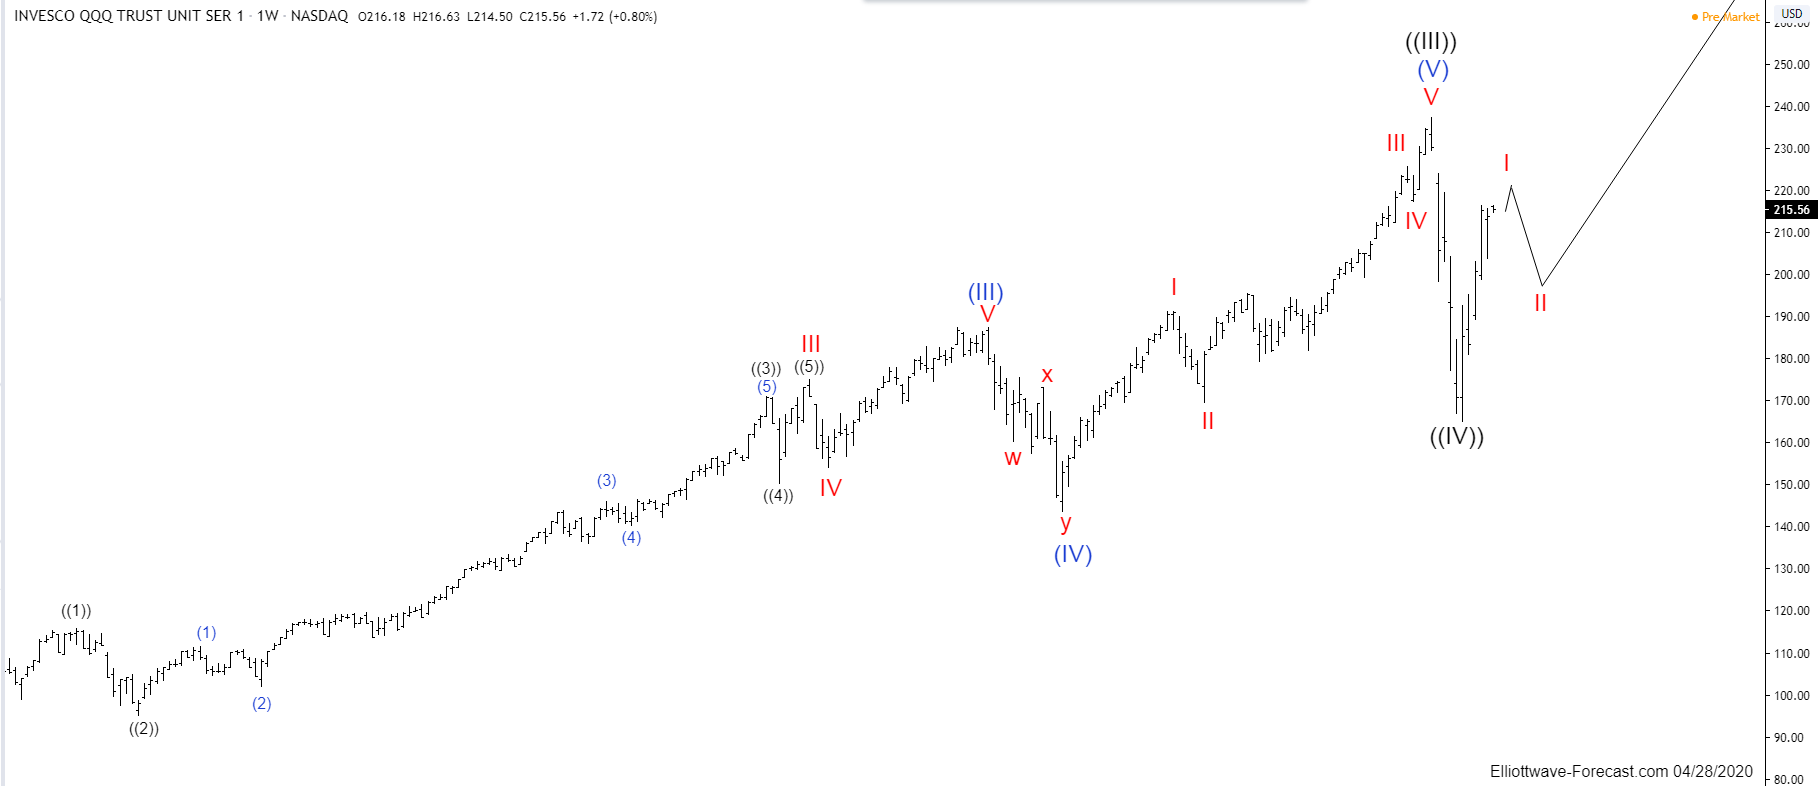
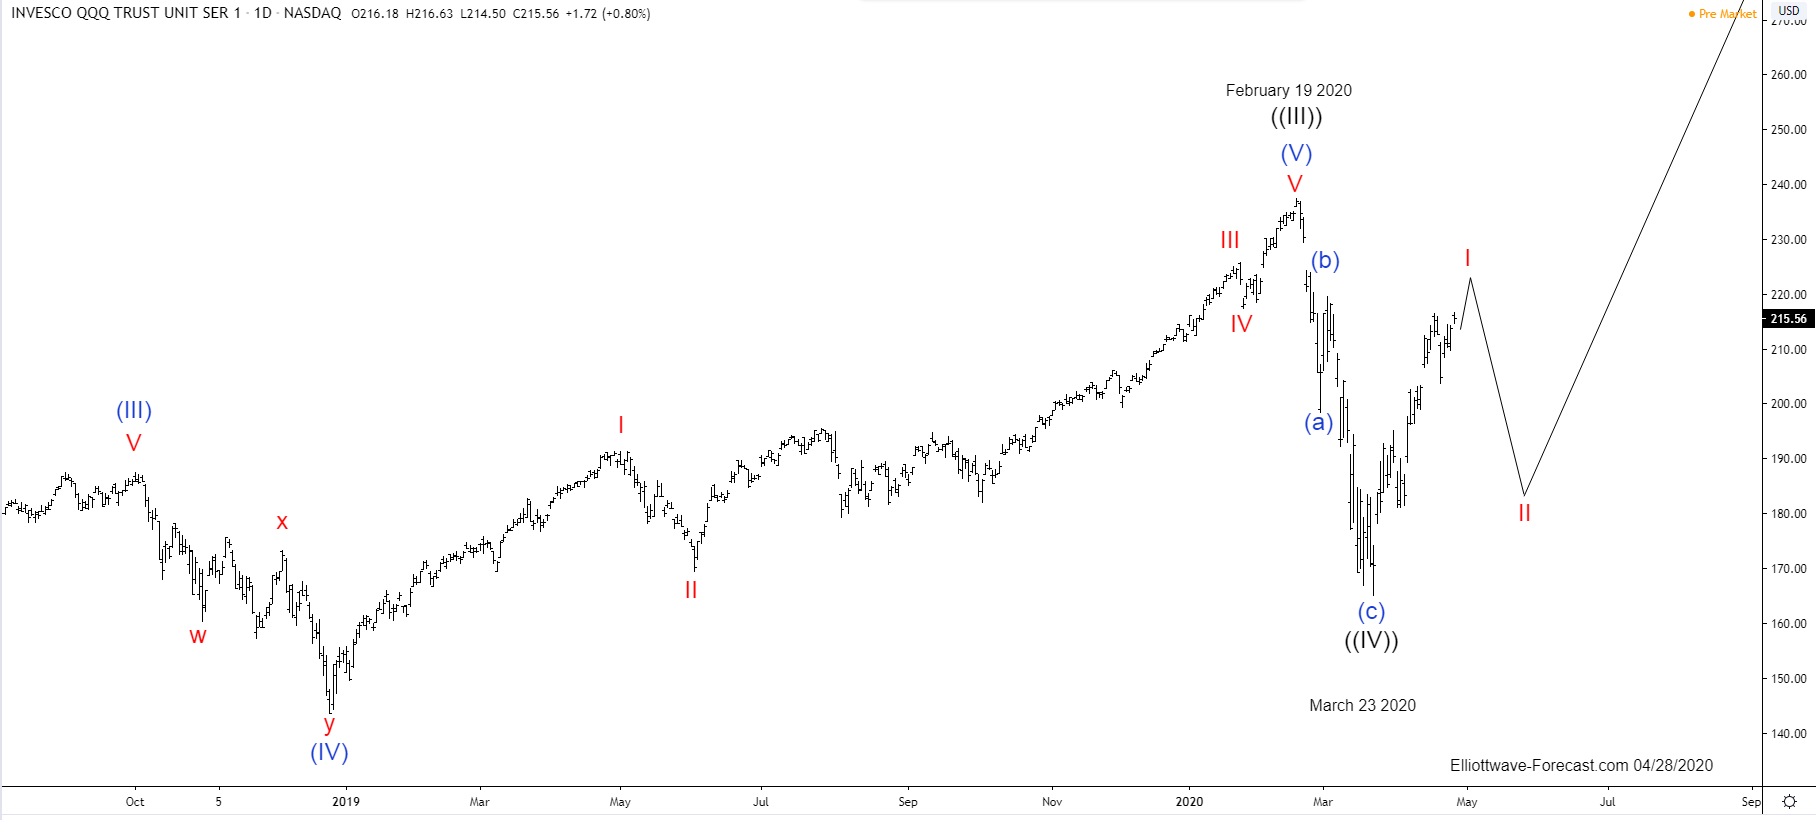
$AAL which is showing the huge dip and running out of space to the downside which means based on the current price, it is very difficult to see the stock make a big bounce and then do another leg lower similar to the one from February 2020 peak. Wave structure of the $TRAN Index is very similar to Indexes like $SPX, $SPY and $DOW, they all have an advance since the all-time lows which relates to a Super Cycle degree ending at 2000 and another Super Cycle starting at 2009 and ending at 2018. The Elliott wave theory proposes that the Market advances in five waves and corrects in three waves. The theory also explains the idea that one of the three advances in five waves within the higher degree five waves should be extended when compared to the other two. Figure below shows this concept:


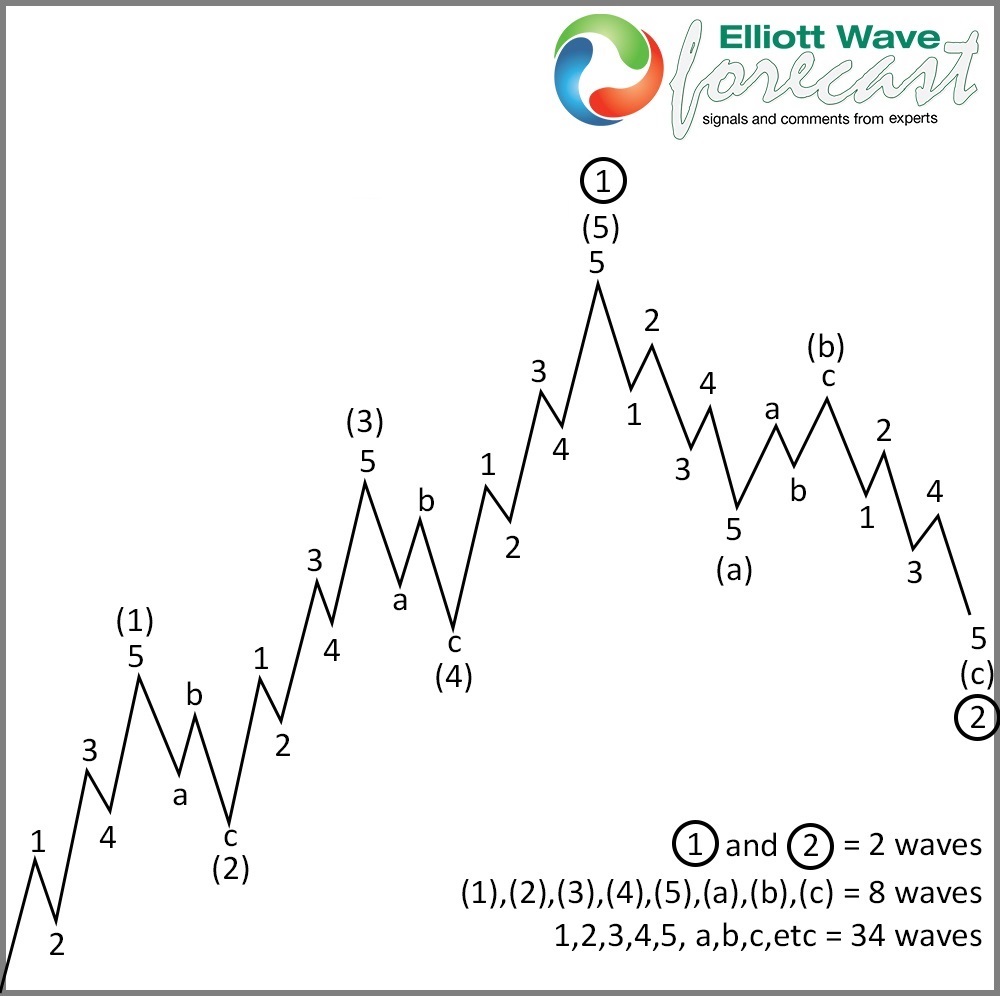
Above figure shows a classic Five waves advance with the subdivisions in which each one is a five waves advance and also shows the two corrective sets in the wave (II) and (IV). Back to the Dow Jones Transportation Index from the all-time lows, the advance is in three waves so far or three cycles, there are two impulses or five waves and one corrective. The cycle from all-time lows into 2000 is a clear five waves, also the advance since 2009 into the 2018 peak, but there is a huge clue which is the extension in wave (III), the way extensions are created is measuring the first leg from all-time lows into 2000 and placing at lows of 2009, we at Elliottwave-Forecast have our own guidelines and one of them is that the moment the extension passes the 161.8% of the previous relationship, we start to favour an impulse. Let's take a look at the chart below.

The Dow Jones Transportation Average ($TRAN) Long-Term Elliott Wave View
$TRAN Dow Transportation Long-term Elliott Wave Analysis


Chart above shows the Grand Super Cycle with labels and also shows the extension relationship between the two cycles. It is very clear this is an impulse in the making and should be another five waves cycles at least to complete the Grand Super Cycle advance. The pullback from 2018 has developed in three waves which has already reached the Blue Box buying area. We believe the pull back ended up being a Flat Elliott wave correction which is a 3-3-5 structure and we believe the cycle ended, at least the one from 01.17.2020 confirming the Flat structure or three waves decline. The Index can not break 3.18.2020 low because then it will become a five waves decline from 2018 peak, which means it would then bounce and do another leg lower. As we mentioned above that scenario would only happen if last month's low is broken. As of right now the Index is holding a Bullish Pattern which is three waves pullback after ending five waves advance since 2009 and more importantly after ending three waves higher with extension from the all time low.
 

Elliottwave-Forecast

Master Trader
Feb 17, 2017
2,460
9
84
www.elliottwave-forecast.com
EURJPY has been under pressure since forming a lower high 121.15 on 25th March. It is yet to break below 10th March low but the bounces look corrective which increase the likelihood of a break lower. Moreover, other Yen pairs like CADJPY and SEKJPY are showing incomplete bearish sequence which also supports the idea of a break lower in EURJPY. However, in this blog we would look at the forecast we presented to members toward the end of March. Let's take a look at the chart below

EURJPY 4 Hour Elliott Wave Analysis 3.26.2020
Chart below shows cycle from 122.86 (1.16.2020) ended at 116.10 (3.9.2020). Then pair started bounce to correct the decline from 122.86 peak in a double three Elliott wave structure when wave W ended at 120.32, wave X ended at 116.86 and wave Y was expected to complete in the blue box between 121.08 - 122.09 area and then we expected the pair to turn lower and resume the decline for a new low below 116.10 or produce a 3 waves reaction lower at least. Blue Boxes are High-Frequency areas which are based in a relationship of sequences, cycles and calculated using extensions, we also call them no-enemy areas because in this area both buyers and sellers agree in the direction of the next move for 3 swings at least.

EURJPY 26 March 4 Hour Elliott Wave Analysis

EURJPY 4 Hour Elliott Wave Analysis 4.15.2020
EURJPY bounce failed in the blue box and it decline in 5 waves which we have labelled as wave 1. Due to the decline from the blue box being impulsive we have tweaked the structure of the previous drop from 122.86 - 116.10 to be a diagonal with a FLAT in wave 2. Wave 1 of (3) completed at 116.31 and recovery in wave 2 is also proposed to be over at 119.07. Now, as bounces fail below 119.07 and more importantly below 121.15, we expect the pair to continue lower. In case pair fails to break below 116.31 and breaks above 119.07, then it could be doing a double correction in wave 2 toward 119.26 - 120.95 area before it turned lower again. Break below 116.10, would confirm extension lower toward 114.37 - 110.17 area.


Elliottwave-Forecast

Master Trader
Feb 17, 2017
2,460
9
84
www.elliottwave-forecast.com
EURJPY Technical Analysis

On April 14/2020 I posted on social media (Stocktwits/Twitter) @AidanFX the SELL trade setup "Sell EURJPY @ 117.67 Stop Loss @ 117.93 Target @ 117.15"

EURJPY 1 Hour Chart April 14.2020 : The chart below was also posted on social media (StockTwits/Twitter) @AidanFX April 14/2020 showing that price hit a clear Support/Resistance Zone (pink) and reacted with a move lower. Support/Resistance patterns should always be used with other technical strategies/techniques and should never be used to trade on it's own. On the 1 hour chart there was a clear bearish trend continuation divergence pattern (purple) that formed after price respected the support/resistance zone and was followed by a bearish engulfing candlestick pattern (green) that also formed. These market patterns was enough confirmation to enter a SELL trade (light blue) and to post the SELL trade setup to the public. I called for traders on April 14/2020 to SELL at 117.67 with stops at 117.93 looking for a 1:2 RR target at 117.15.

EURJPY, forex, trading, elliottwave, market pattern, technical analysis, aidanfx


EURJPY 1 Hour Chart April 15.2020 : Price remained trading below the 50 Moving Average (dark blue) offering more confirmation to continue holding the April 14/2020 SELL trade. On April 15/2020 the pair moves lower and hits the 1:2 RR target. Price moved below the target level and I eventually banked profits at 117.07 for +60 pips which I posted on social media -> "KA-CHING !!! $EURJPY Target HIT @ 117.15 from 117.67 and closed @ 117.07 +60 pips." If you followed me on Twitter/Stocktwits you too could have caught the EURJPY move lower.

EURJPY, forex, trading, elliottwave, market pattern, technical analysis, aidanfx


Of course, like any strategy/technique, there will be times when the strategy/technique fails so proper money/risk management should always be used on every trade. Hope you enjoyed this article and follow me on Twitter for updates and questions> @AidanFX or chat me on Skype > EWF Aidan Chan
 

Elliottwave-Forecast

Master Trader
Feb 17, 2017
2,460
9
84
www.elliottwave-forecast.com
Hello fellow traders. In this technical blog we’re going to take a quick look at the Elliott Wave charts of Apple stock, published in members area of the website. As our members know, Apple has been showing incomplete Higher- High Sequences in the cycle from the March 23rd low, calling for further rally. Consequently we recommend members to avoid selling the stock, while keep favoring more upside toward 284.28-313.72 area. In further text we’re going to explain Elliott Wave Forecast.

Apple 4 Hour Elliott Wave Analysis 4.6.2020
Apple is correcting cycle from the 327.93 peak. The stock has scope to reach 284.28-313.72 area. However, we would like to see break above March 31st peak- (B) blue to confirm next leg up ((C)) black is in progress. Once the stock reaches proposed area, buyers will be taking profit and sellers can appear for pull back in 3 waves at least.

Apple

Apple 1 Hour Elliott Wave Analysis 4.6.2020
As we can see at the chart bellow, Apple completed wave ((B)) pull back as Irregular Flat Pattern at the 236.79 low. Current view suggests rally from the mentioned low is unfolding as impulsive structure. Break above previous peak (B) blue - 03/31 confirmed next leg up ((C)) is in progress. The stock is now targeting 284.28-313.72 area. As far as 236.79 pivot holds we favor the long side. We don’t recommend selling the stock.

You can learn more about Irregular Elliott Wave Flat Patterns at our Free Elliott Wave Educational Web Page.

Apple

Apple 1 Hour Elliott Wave Analysis 4.6.2020
The stock completed short term cycle from the 236.79 low as 5 waves structure- wave (1) blue. We got clear 3 waves ABC pull back in (B) blue, when the price reaches A-B equal legs at 259.26-257.26. Short term pull back (2) blue is counted completed at the 257.19 low. Now we would like to see break above (1) blue peak to confirm next leg up is in progress. We don't recommend selling the stock and favor the long side toward 284.28-313.72 area ( equal legs from the March 23rd low)

Keep in mind not every chart is trading recommendation. Best instruments to trade are those having incomplete bullish or bearish swings sequences. We put them in Sequence Report and best among them are shown in the Live Trading Room. You can check most recent charts in the membership area of the site.

Apple


Elliott Wave Forecast
 

Elliottwave-Forecast

Master Trader
Feb 17, 2017
2,460
9
84
www.elliottwave-forecast.com
$USO United States Oil Fund Elliott Wave & Longer Term Cycles

Firstly the USO instrument inception date was 4/10/2006. CL_F Crude Oil put in an all time high at 147.27 in July 2008. USO put in an all time high at 119.17 in July 2008 noted on the monthly chart. The decline from there into the February 2009 lows was in three swings. An a-b-c in red although it was a very steep pullback.

As can be seen, the bounce from the 2009 lows is a complex double three combination with a triangle “y”. This is w-x-y in red to end the blue wave (x). In either a bullish or bearish market this particular structure always makes a high or low in the initial wave “w”. Structures like this will be followed by a contracting or running triangle. In this case the structure ended in June 2014. The decline from those highs were very sharp again. As can be seen, this was in three swings again a-b-c in red to end the blue wave (y). This completed a three swing correction (w)-(x)-(y) in blue from the July 2008 highs.

The analysis continues below the USO Monthly chart.


Secondly CL_F Crude Oil and the USO instrument as previously mentioned made an all time high back in July 2008 then each of them appears to have declined in three big swings into the February 2016 lows. In the case of USO the price was 7.67. As can be seen, the bounce into the October 2018 highs was three swings again.

The analysis continues below the USO Weekly chart.


In conclusion: The USO mirrors CL_F Crude Oil. As can be seen, the bounce from the February 2016 lows into the October 2018 highs appeared to have been a zig zag and has been labeled as a second (x)(x). The decline from the October 2018 highs to the December 218 lows was five waves and labeled "a". There was a bounce that failed in April 2019 labeled "b". There is very little room left for the current wave "c" to make new lows. The best reading of the cycles suggest a couple more lows for the wave structure to appear right before turning higher again.
 

Elliottwave-Forecast

Master Trader
Feb 17, 2017
2,460
9
84
www.elliottwave-forecast.com
$CPER Copper Index Tracker Elliott Wave & Long Term Cycles

Firstly the CPER Copper Index Tracking instrument has an inception date of 11/15/2011. There is data in the HG_F copper futures before this going back many years. That shows copper made an all time high on February 15th, 2011 at 4.649. Translated into this instrument, it is mentioned on the monthly chart. The decline from there into the January 2016 lows appeared to have been a double three in the commodity HG_F. Thus I will work with that idea in this CPER instrument.

The analysis continues below the CPER monthly chart.


Secondly the CPER Copper Index Tracking instrument from the all time highs made what is favored to be a double three correction lower in the wave (w). This is seen on the daily chart below that ended at the 12.97 lows in January 2016. From the January 2016 lows up into the December 2017 highs appeared to be a double three structure. The bounce was strong enough on momentum indicators to suggest it had ended the cycle lower from the all time highs. This is as reflected in the monthly chart shown above.

The analysis continues below the CPER daily chart.


Thirdly, the CPER Copper Index Tracking instrument decline from the December 2017 highs is very ambiguous. This means it is open to more than one interpretation as is most any chart by an Elliott wave analyst. The key points here are as follows. As can be seen the 12.87 low from March 20th 2020 created a bearish sequence by taking out the lows from January 2016. This means it is in a 5th swing lower from the all time highs. The 5th swing target area is highlighted at 11.82-9.59 on the monthly chart above. From there it should bounce to correct the cycle from the December 2017 highs. This will be the 6th swing. It may be either shallow or a larger bounce relative to the decline from there.

In conclusion: While the 6th swing bounce remains below the December 2017 highs it should see another round of weakness toward the 5.98 area in the 7th swing lower from the all time highs. That is the area where the technicals suggest it can see a turn back higher from.
 

Elliottwave-Forecast

Master Trader
Feb 17, 2017
2,460
9
84
www.elliottwave-forecast.com
Last year, the streaming TV ROKU (NASDAQ:ROKU) ended the entire rally since IPO as an impulsive 5 waves advance which is a bullish structure followed by a Double Three corrective structure. Based on the Elliott Wave Theory, after an instrument ends the correction it will either resume the rally within the main trend or bounce in 3 waves at least.

ROKU did a 7 swings pullback from September 2019 peak toward equal legs area $90 - $41 where it ended the decline on 16 of March 2020 and managed to find buyers around the blue box to start the next leg higher. The key level for the stock is the 2019 peak $176.5 because only a break above that level will open a bullish sequence supporting the daily rally and aim for a minimum target at equal legs area $219 - $257 with a potential extension toward $318.

ROKU Weekly Chart
ROKU Weekly Chart 4.21.2020

The current cycle from $58 low is mature as it reached the target area at $123 - $150 unfolding as 5 waves advance which is suggesting that ROKU will be soon looking to ended it and start a corrective pullback which is expected to remain supported in 3, 7 or 11 swings against March 2020 low before a similar rally takes place within the 4 Hour cycle.

ROKU 4H Chart
ROKU 4H Chart 4.21.2020

ROKU still can’t compete with the giant Netflix or other names like Amazon Prime, Disney Plus, Hulu , ect ... However the steady growth of the company is the key attracting all type of investors and Hedge Funds interested in these type of stock during the current Pandemic situation.
 

Elliottwave-Forecast

Master Trader
Feb 17, 2017
2,460
9
84
www.elliottwave-forecast.com
Continuing along the theme of Corona Virus stocks, this week Novavax Inc. is next up in line. Novavax has gone parabolic with the COVID-19 spreading worldwide as with the other names I have covered. It also remains very technical, and I think there could a few more swings up before a longer term top is realized. Lets take a look at what they do as a company:

“Novavax, Inc. is a clinical-stage biotechnology company committed to delivering novel products to prevent a broad range of infectious diseases. Using innovative proprietary recombinant nanoparticle vaccine technology, we produce vaccine candidates to efficiently and effectively respond to both known and emerging disease threats. Our vaccine candidates are genetically engineered three-dimensional nanostructures that incorporate recombinant proteins critical to disease pathogenesis.”

Novavax has had an impressive rally so far this year. Also, the structure of this stock looks a lot better than many other plays I have covered in the COVID-19 related fields. With that said, the Elliott Wave view seems to be counting technically clean. Let’s take a look below at the 4H view.

Novavax 4H Elliott Wave View
Novavax

Novavax set all time lows in November 2019 at 3.54. From there Novavax had a clean 5 waves advance shown in blue, for a wave ((1)) top at 17.71. From there wave ((2)) is set at 6.77 and a wave ((3)) advance is currently underway. Prices have reached the equal legs extreme area of ((1))-((2)) as shown above, in a blue box. This is an area where sellers may enter for a pullback in 3, 7 or 11 waves. Prices entered the box and found resistance to pullback in a blue (4) of ((3)).

Prices still have a bit more upside in wave ((3)) to complete the sequence before a pullback in wave ((4)) is expected. It's a bit late in the cycle to start chasing new longs, but the target for ((3)) is the 161.8% extension at 30.38. After a wave ((4)) has played out in 3,7 or 11 waves, there is room for a wave ((5)) of Red I to complete the sequence.

Risk Management
Using proper risk management is absolutely essential when trading or investing in a volatile stock such as NVAX. Elliott Wave counts can evolve quickly, be sure to have your stops in and define your risk when trading.
 

Elliottwave-Forecast

Master Trader
Feb 17, 2017
2,460
9
84
www.elliottwave-forecast.com
Elliott Wave view in Bank of America (BAC) suggests the decline from January 15, 2020 high is unfolding as a 5 waves impulse. Down from January 15 high, wave (1) ended at 32.47 and bounce in wave (2) ended at 35.45. Stock has resumed lower in wave (3) which ended at 17.95. Bounce in wave (4) is proposed complete at 25.35 as a zigzag.

Short term 45 minutes chart below shows the stock ended wave (4) bounce at 25.35. This level is now the short term invalidation level for more downside. Internal of wave (4) unfolded as a zigzag where wave A ended at 23, wave B ended at 19.51, and wave C of (4) ended at 25.35. While below 25.35, wave (5) lower is currently in progress as an impulse, but BAC still needs to break below wave (3) at 17.95 to avoid a double correction.

Down from 25.35, wave 1 ended at 21.09 and wave 2 bounce ended at 23.40. Near term, while rally fails below 25.35, expect Bank of America to extend lower within wave (5). Potential target lower is 123.6 - 161.8% external extension of wave (4) which comes at 13.3 - 16.1.

BAC 45 Minutes Elliott Wave Chart
 

Elliottwave-Forecast

Master Trader
Feb 17, 2017
2,460
9
84
www.elliottwave-forecast.com
Hello fellow traders. In this technical blog we’re going to take a quick look at the charts of COPPER ( $HG_F ) published in members area of the website. As our members know, COPPER has given us recovery against the January 16th peak that unfolded as Elliott Wave Double Three Pattern. We advised clients to avoid buying the commodity,while favoring short side and reaction lower from the Blue Box.
In the charts below, we’re going to explain the Elliott Wave structure and forecast.

COPPER Elliott Wave 4 Hour Chart 4.6.2020
Current view suggests The Commodity is correcting the cycle from the 2.6367 peak. Recovery is having form of Elliott Wave Double Three. At this moment correction is incomplete, showing higher high sequences from the low. Consequently we are calling for more short term strength toward 2.2873-2.4516 area. At the Blue Box area we expect sellers to appear for decline toward new lows or 3 waves pull back at least. Invalidation of the sell trade would be break above 1.618 fib extension:2.4516. Once the price reaches 50 fibs against the ((x)) black low, we should make short positions risk free.
As our members know Blue Boxes are no enemy areas , giving us 85% chance to get a bounce.

You can learn more about Elliott Wave Double Three Patterns at our Free Elliott Wave Educational Web Page.

COPPER

COPPER Elliott Wave 4 Hour Chart 4.21.2020
Eventually , COPPER gave us leg up toward blue box. It found sellers right at the blue box area : 2.2873-2.4516 and gave us decline from there . At this stage we see wave (4) recovery completed at the 2.3615 peak. Members who sold the pair should be already risk free. Now, COPPER is correcting short term cycle from the 2.3615 low. As far as the price holds below that high , we could have wave (4) completed there and the commodity can resume trading lower. Otherwise break above 2.3615 would mean we are doing larger bounce that can see 2.52-2.61 area, which is next set of equal legs from the March 19th low.

Keep in mind market is dynamic and presented view could have changed in the mean time. You can check most recent charts in the membership area of the site. Best instruments to trade are those having incomplete bullish or bearish swings sequences.We put them in Sequence Report and best among them are shown in the Live Trading Room.

Copper

Elliott Wave Forecast
 

Elliottwave-Forecast

Master Trader
Feb 17, 2017
2,460
9
84
www.elliottwave-forecast.com
In this blog, we are going to take a look at the Elliottwave chart of GBPJPY. The 4 hour chart update below from 15 April shows that the cycle from December 12, 2019 high unfolded as 5 waves impulsive structure. Wave 1 ended at 141.14 low. The bounce in wave 2 as a flat correction ended at 144.36 high. From there, the pair continued to extend lower and ended wave 3 at 132.51 low. This is followed by a bounce in wave 4, which ended at 137.21 high. The pair then pushed lower to end wave 5 at 123.99 low.

GBPJPY 4.15.2020 4 Hour London Elliott Wave Update
GBPJPY 4.15.2020 4 Hour Chart

Based on Elliottwave theory, a 3 waves bounce should happen before the decline to the downside resume. As long as the high at 147.94 stays intact, the bounce in 3,7, or 11 swings is expected to fail for more downside later. The expected bounce unfolded as a zig-zag. Wave A ended at 132.04 high and wave B ended at 127.26 low. The 100% extension of wave A-B where wave C can potentially end is at 135.30 - 140.27 area. We showed this area with a blue box. The blue box is the area where we expect sellers to appear for 3 waves pullback at least or an extension lower.

GBPJPY 4.22.2020 4 Hour London Elliott Wave Update
GBPJPY 4.22.2020 4 Hour Chart

The 4 hour chart update from 22 April shows that the pair reached the equal leg area. Wave C ended at 135.75 high, which is in the blue box area. From there, the pair has extended lower. Wave ((i)) ended at 133.61 low and wave ((ii) bounce has ended at 134.96 high. The pair still needs to break below the previous low at 123.99 to confirm that the next leg lower is in progress and to avoid doing a double correction.
 

Elliottwave-Forecast

Master Trader
Feb 17, 2017
2,460
9
84
www.elliottwave-forecast.com
IMF (International Monetary Fund) projects the European nations will experience a 7.5% GDP contraction this year. EU nations have been some of the hardest hit by Covid-19. Even before the pandemic, the European economy is already sluggish. The NIRP (Negative Interest Rate Policy) and ZIRP (Zero Interest Rate Policy) have not produced better results. These policies may have in fact weakened the condition of the European banking sector.

To soften the impact of the pandemic, European Central Bank (ECB) introduced new measures. The central bank promises to buy 750 billion euros ($815 billion USD) in sovereign bonds this year. The data however suggests that this measure can reach the limit by October this year assuming constant purchasing pace.

ECB might use another powerful tool such as helicopter money if current policy is inadequate. Helicopter money refers to a policy where central banks print additional money and gives it directly to the citizens. The goal is to boost consumer spending, speeding up economic recovery and preventing recession. This idea goes back to Milton Friedman who wrote about it in 1969. Ben Bernanke then revived the idea in 2002. The idea of helicopter money can potentially lead to inflationary consequences. If ECB really takes this step, Gold should find strong bids as a hedge against inflation.

Gold against Euro (XAUEUR) Elliott Wave Chart


Gold against the Euro dollar (XAUEUR) continues to make all-time high after breaking above October 2012 prior high at $1386.5. Structure of the rally from December 2013 low is unfolding as a 5 waves impulsive structure, favoring more upside. We prefer to continue buying any dips in 3, 7, or 11 swing against $1300.9 in the first degree.
 

Elliottwave-Forecast

Master Trader
Feb 17, 2017
2,460
9
84
www.elliottwave-forecast.com
Elliott Wave view in Gold Miners ETF (GDX) suggests the rally from March 16, 2020 low is unfolding as a 5 waves impulsive structure. Up from March 16 low, wave (1) ended at 27.21 and pullback in wave (2) ended at 23. The ETF then extends higher in wave (3) towards 32.27 and wave (4) pullback ended at 29.37. The 45 minutes chart below shows the internal of wave (3) which unfolded as another impulse of lesser degree.

Wave (4) correction ended as a triangle. Wave A ended at 29.37, wave B at 31.12, wave C at 29.45, wave D at 31.13, and wave E of (4) ended at 29.45. The instrument then extends higher again in wave (5) with potential to end at 32.61 - 33.87 (blue box). This move will also complete wave ((1)) and thus ends cycle from March 16, 2020 low. Afterwards, the instrument can see larger pullback within wave ((2)) to correct cycle from March 16, 2020 low in 3, 7, or 11 swing before turning higher again.

We don't like selling the instrument and GDX can always extend higher as the structure is in 5 waves. Furthermore, the sequence from January 2016 low appears incomplete with 100% - 123.6% Fibonacci target towards 36 - 40.6.

GDX 45 Minutes Elliott Wave Chart
Elliott Wave View: GDX Extends Higher to 7 Year High
 

Elliottwave-Forecast

Master Trader
Feb 17, 2017
2,460
9
84
www.elliottwave-forecast.com
The next entry in the theme of Corona Virus stocks is Moderna Inc. Moderna has had a more steady advance during the COVID-19 spreading worldwide. As such, it is a bit more stable than other names I have covered. That's not to say that it hasn't had astounding returns, which it has, but it is in more of a steady reliable rally. It also remains very technical as with all other stocks. Lets take a look at what they do as a company:

“Moderna, Inc. is a Cambridge, Massachusetts-based biotechnology company that is focused on drug discovery and drug development based on messenger RNA. The company creates synthetic mRNA that can be injected into patients to help them create their own therapies.”

Moderna has had an impressive rally so far this year. Also, the structure of this stock looks very constructive compared to others covered in the COVID-19 related field that I've done. With that said, the Elliott Wave view seems to be counting technically clean. Let’s take a look below at the Daily view.

Moderna Inc Daily Elliott Wave
Moderna


Moderna set all time lows in August 2019 at 11.54. From there a wave ((1)) top was set at 36.00 on Feb 27/2020. From there wave ((2)) is set at 19.31 on Mar 13/2020 and a wave ((3)) advance is currently underway. The count is getting stretched on the wave ((3)) but the sequence allows for another high for Blue (5) of ((3)). Prices have reached the equal legs extreme area of ((1))-((2)) as shown above, in a blue box. This is an area where sellers may enter for a pullback in 3, 7 or 11 waves. Prices entered the box and found resistance to pullback in a blue (4) of ((3)).

Prices still have a bit more upside in wave ((3)) to complete the sequence before a pullback in wave ((4)) is expected. It's a bit late in the cycle to start chasing new longs, but the target for ((3)) is the 161.8% extension at 58.85. After a wave ((3)) is complete, a wave ((4)) pullback in 3,7 or 11 swings is expected to take place. From there, there is room for a wave ((5)) of Red I to complete the sequence from the all time lows.

Risk Management
Using proper risk management is absolutely essential when trading or investing in a volatile stock such as MRNA. Elliott Wave counts can evolve quickly, be sure to have your stops in and define your risk when trading.
 

Elliottwave-Forecast

Master Trader
Feb 17, 2017
2,460
9
84
www.elliottwave-forecast.com
BMW is one of the biggest german car manufacturers excelling in quality and technical characteristics. From march 2015, the performance of the stock price $BMW being part of DAX is, however, in a steady decline. As a matter of fact, this price development may be a real headake for company leaders. And still, disregarding all the fundamentals, one can explain the fall in the stock price in terms of pure technial analysis.

BMW Monthly Elliott Wave Analysis 04.24.2020
The monthly chart below shows the BMW stock $BMW traded at XETRA. From all-time lows, the stock price has developed an Elliott wave motive wave pattern. The cycle up in blue wave (I) being of super cycle degree has ended by printing its top at all-time highs on March 2015 at 123.80. Within the super cycle (I), the red waves I, III and V of cycle degree are also motive waves. Moreover, wave III shows an extension. Between wave V and wave III, one can see a divergence in RSI. All these characteristics support the maturity of the super cycle in wave (I). After 5 waves up, according to Elliott wave principle, the price needs to retrace in 3 waves lower. Only then another advance higher can start.

BMW Elliott Wave Monthly

BMW Weekly Elliott Wave Analysis 04.24.2020
The correction of the super cycle in wave (I) from the 03.2015 highs in blue wave (II) lower can be better seen in detail in the weekly chart below. The decline has unfolded so far as a double three correction pattern, i.e., a 7 swings structure. The red wave w (3 swings) has ended on 07.2016. A connector in red wave x (swing #4) has printed its top on 01.2018. From there, the 5th swing lower in black wave ((A)) has ended on 08.2019 opening up a bearish sequence. After a bounce as a swing #6 in wave ((B)), the 7th swing in black wave ((C)) has extended lower. The red wave y has already reached the extension area towards 36.80-22.83. From the 03.2020 lows, we saw a strong reaction to the upside.

BMW Elliott Wave Weekly

BMW Daily Elliott Wave Analysis 04.24.2020 and Outlook
The daily chart below shows that even within the wave y of cycle degree the waves ((A)) and ((C)) have reached the equal legs extension area towards 37.40-28.29. The price may have, therefore, printed an important bottom in wave (II) on 03.2020 at 36.47. While above, where daily, weekly and monthly are turning up, the stock is expected to resume the rally in wave (III) towards 123.80 and higher or bounce in 3 waves at least.

BMW Elliott Wave Daily
 

Elliottwave-Forecast

Master Trader
Feb 17, 2017
2,460
9
84
www.elliottwave-forecast.com
Bayer Ag is one of the largest pharmaceutical companies in the world. Founded in 1863 and headquartered in Leverkusen, Germany, Bayer's most famous product was aspirin. Today, the company is a part of DAX30 and of SX5E indices. In recent weeks, as all major pharmaceutical companies, Bayer contributes also actively in the fight against COVID-19. If that action will help the stock price to recover?

Bayer Monthly Elliott Wave Analysis 04.26.2020
The monthly chart below shows the Bayer stock $BAYN traded at XETRA. From all-time lows, the stock price has developed an Elliott wave motive wave pattern. The cycle up in blue wave (I) being of super cycle degree has ended by printing its top at all-time highs on April 2015 at 144.13. Within the super cycle in wave (I), the red waves I, III and V of cycle degree are also motive waves. Wave II is an expanded flat and wave IV is an Elliott Wave triangle pattern. Even though the internals of wave IV are falling below 43.55, hence, an overlap occurs with the price territory of the wave I. Nevertheless, the end of the wave IV in subwave ((E)) is proposed ended at 46.95, therefore, no crossing of waves I and IV takes place.

The triangle in wave IV has resolved in a thrust higher in wave V. Within the super cycle, it is the 5th wave extension which we can see in the monthly chart. Finally, RSI divergence between wave V and wave III is a sign of the cycle maturity. As a general rule, 5 waves up require a correction in 3 waves lower. Once the consolidation is over, only then the trend up can resume.

Bayer Elliott Wave Monthly

Bayer Weekly Elliott Wave Analysis 04.26.2020
The correction of the super cycle higher in wave (I) from the 04.2015 highs in blue wave (II) lower is shown in detail in the weekly chart below. The decline has unfolded so far as a zigzag pattern, i.e., a 5-3-5 structure. The cycle in red wave a has ended on 05.2016. The decline shows five subwaves with the overlapping waves ((1)) and ((4)) which might be a leading diagonal. The correction higher in red wave b has printed its top on 06.2017. From there, another leg lower in red wave c is demonstrating an impulsive character. The wave ((3)) shows an extension which in turn has an extended 3rd subwave, i.e., blue (3).

Now, the wave ((3)) of c has ended at 52.00 reaching the equal legs extension area of 1.0-1.618 multiple of the length of the wave a (s. blue box area). The bounce from the blue box to the 78.25 level is sharp and broke the RSI channel to the upside. However, the price has retraced less than 50% of the wave ((3)) and has respected the price action resistance line. These features together with incomplete look of the decline from the 06,2017 highs favor counting the rise and the subsequent fall to new lows as the waves ((4)) and ((5)) of the cycle lower in wave c.

Bayer Elliott Wave Weekly

Bayer Daily Elliott Wave Analysis 04.26.2020 and Outlook
The daily chart below shows in more detail the sharp fall towards 44.72 on March 2020. There, the stock price has found a bottom within the weekly blue box extension area. Moreover, it has reached the 1.23-1.618 inverse extension of the wave ((4)). From the March lows, the price has bounced breaking both price and RSI channels of the decline in wave ((5)) of c. Therefore, the correction in wave (II) from the 04.2015 highs might be over. While above 44.72, the price of $BAYN should find support. The stock price could be starting right now to a new multi-year rally in the wave ((III)) towards 144.13 and higher or should bounce in 3 waves at least.

Bayer Elliott Wave Daily
 

Elliottwave-Forecast

Master Trader
Feb 17, 2017
2,460
9
84
www.elliottwave-forecast.com
In this technical blog we’re going to take a quick look at the charts of Bank Of America (BAC) published in members area of the website. As our members know BAC made 5 waves down from the 36.04 peak ( 01/15). Proposed January cycle completed on March 23th date and the Stock made recovery. BAC made 3 waves against the 36.04 peak when the stock found sellers at Blue Box Area: 24.61-27.76 as we were expecting.
In the charts below, we’re going to explain the Elliott Wave structure and forecast.

BAC Elliott Wave 4 Hour Chart 4.8.2020
Current view suggests The Stock is correcting the cycle from the 36.04 peak. At this moment correction looks incomplete. The price is showing higher high sequences from the March 23th low, missing equal legs at the moment. Consequently, we expect more short term strength toward 24.61-27.76 area. At the Blue Box area we expect sellers to appear for further decline toward new lows or 3 waves pull back at least. As our members know Blue Boxes are no enemy areas , giving us 85% chance to get a bounce. We get the Blue Box levels by using Fibonacci Expansion Tool and measuring Equal Legs - 1.618 Fib Extension .

BAC

BAC Elliott Wave 4 Hour Chart 4.23.2020
BAC made proposed leg up toward blue box. The stock found sellers right at the blue box area : 24.61-27.76 and gave us decline from there as we were expecting. BAC ended clear 3 waves up from the March 23th lows. If the price breaks above 04.09 peak ( marked C red on the chart), it will open possibility of 7 swings up in the correction against the 35.97 peak. Otherwise it would need to break March 23th low in order to confirm next leg down is in progress.

Note: some labels have been removed in order to protect client's privileges. You can check most recent charts in the membership area of the site. Best instruments to trade are those having incomplete bullish or bearish swings sequences.We put them in Sequence Report and best among them are shown in the Live Trading Room.

BAC

Elliott Wave Forecast
 

Elliottwave-Forecast

Master Trader
Feb 17, 2017
2,460
9
84
www.elliottwave-forecast.com
The $QQQ Nasdaq Tracker Long Term Cycles & Elliott Wave

Firstly the QQQ instrument inception date was in March 1999. That was before it ended a larger cycle up from the all time lows in March 2000. The ETF instrument mirrors the price movement of the Nasdaq which did that. As shown below from the March 2000 highs the instrument experienced a steep correction lower in three swings to the October 2002 lows. From there to the October 2007 highs it ended the first of the current series of impulses in the blue color. This makes up the subdivisions of the wave ((III)) that has ended on February 19 2020. It appears possible the correction of the cycle up from the October 2002 lows ended on 3/23/20.

As can be seen, the pullback from the October 2007 highs was in 3 swings that ended in November 2008. This corrected the cycle up from the October 2002 lows. The wave I was extended in the subdivision of wave (III). The wave II low created in August 2015 was strong enough to suggest it was correcting the cycle the November 2008 lows.

Additionally it appeared the wave IV was only deep enough to be correcting the cycle from the August 2015 low. Afterward it saw another high in August 2018. The wave (IV) into the December 2018 lows was strong. It suggested it had corrected the cycle from the November 2008 low.

The analysis and commentary continues below the QQQ monthly chart.


Secondly as previously suggested the QQQ instrument mirrors the Nasdaq highs & lows. As already mentioned, the cycle up from the October 2002 lows ended February 19 2020. It is now favored ended correcting the cycle up from the October 2002 lows on 3/23/20. As known, impulses progress in 5-9 & 13 swings. Corrections against the trend proceed in 3-7 or 11 swings. That correction is three swings so far however it remains possible there will be three more to make 7 swings.

The analysis and conclusion continues below the QQQ weekly and daily chart.


In conclusion the instrument can see a pullback lower of the same magnitude as like in the March 2000 highs to October 2002 lows in the wave ((IV)) before turning higher again. This in not the favored view. After another high in the near term it should look like five waves up from the 3/23/20 lows. Afterward, it should see three swings lower to correct the cycle up from the 3/23/20 lows. Since this daily pullback lower has not began I can not measure an extension area until there is some further data to give the area. Do expect the instrument to remain above the 3/23/20 lows for the turn higher.
 

Elliottwave-Forecast

Master Trader
Feb 17, 2017
2,460
9
84
www.elliottwave-forecast.com
Southwest Airlines Corporation like every Airline took a deep during the first quarter of 2020. The stock ended a Five waves advance within the Grand Super Cycle degree. And now, it is correcting lower in an ABC structure. The idea represents the classic pattern of the Elliott wave theory, which is nothing more than five waves with the trend and three waves pullback against the main trend. As we all know that the Transportation sector has suffered due to the lack of traveling lately. But the wave structure at LUV is showing that soon traveling will start to pick up. Here is the Quarterly chart of the stock:

LUV Quarterly Elliott Wave Chart
LUV (Southwest Airlines CO): An Ending Diagonal In Process.

In the above chart of LUV, the stock is showing the Five waves rally and a three waves pullback is taking place. An ABC is nothing more than a two-cycle of five waves each. The impulses need to follow every single rule of the Theory. And have an impulse sequence which always is 5-9-13 area. If we take a look at the structure since the peak at 12.18.2017, at this moment, we can see how (a) Blue was a clear five waves. Then the instrument did three waves back in (b) and now we are in the process of finishing the third leg in also five waves. An ABC does not come with an extension which is the main difference with an impulse. So the ABC always ends above the 1.618%. The relationship between (a)-(b)- (c) is reflected in the following chart (Weekly) with the Blue Box area.

LUV Weekly Elliott Wave Chart
LUV (Southwest Airlines CO): An Ending Diagonal In Process.

Blue boxes on our charts are high-frequency areas and are expected to produce 3 waves reaction at least or the renew of the higher degree trend. Many do not believe in the idea that the everyday market is more and more related to computers. Consequently, for years, we have added it to our forecast at Elliott wave forecast. We used the Boxes to enter or exit the Market knowing the Market Nature related to the Boxes. Downgrading the charts, we are reaching a very interesting stage. Because trading within the Box means a turn has an 85% chance to happen. As far as to stay above $21.76 area which is the 1.618% between (a)/(b)/(c) or the bottom of the Blue Box. The following chart is the Daily Time frame view of the instrument:

LUV Daily Elliott Wave Chart
LUV (Southwest Airlines CO): An Ending Diagonal In Process.

As we have said previously an ABC is two impulses in one direction. But also needs to have a corrective sequence, which should unfold in 3, 7 or 11 sequences. At this moment, we already have five waves (red) in (a)=5 +plus (b) blue 1 wave =6+five waves in red within (c) blue give us a grand total of 11 swings since the peak at 12.18.2017. The number of swings is there, but we need the closer which is the perfect number within the last leg in this case (c) blue.

As we have been saying an Impulse is 5-9-13 and each impulse within the cycle should be in five waves. Since the peak at 02.05.2019, the decline is in five waves in red, but the last decline which started at 03.26.2020 the decline is in three waves, with no extension. We believe the instrument is doing an Ending Diagonal which guidelines

  • • Special type of motive wave which appears as a subdivision of wave 5 in an impulse or subdivision of wave C in a zigzag
  • • The ending diagonal is a subdivision of wave 5 in an impulse, either in wave 1 or 5.
  • • Ending diagonal is usually characterized by overlapping waves 1 and 4 and also by the wedge shape.
  • • The subdivision of an ending diagonal is 3-3-3-3-3 or 5-3-5-3-5.
The following chart represented how the diagonal looks in Subdivision of 3-3-3-3-3.
LUV (Southwest Airlines CO): An Ending Diagonal In Process.

The following chart represented how the diagonal looks in Subdivision of 5-3-5-3-5.

LUV (Southwest Airlines CO): An Ending Diagonal In Process.

The ending diagonal is a very great tool to locate the turn because of the terminal nature of the structure and the wedge look. Seeing the Ending Diagonal and the Blue Box it is a nice area to anticipate a turn higher soon and the possible renew of the higher degree trend.
 

Elliottwave-Forecast

Master Trader
Feb 17, 2017
2,460
9
84
www.elliottwave-forecast.com
The rally in $DAX from March 16 low is unfolding as a 5 waves impulsive Elliott Wave structure. Up from 3.16.2020 low, wave (1) ended at 9145.93 and pullback in wave (2) ended at 8257.53. Wave (3) shows an extension and the rally ended at 10820.17 as the chart below shows. Up from wave (2), wave 1 ended at 9201.07, wave 2 ended at 8480.28, wave 3 ended at 10137.62, wave 4 ended at 9337.02, and wave 5 pf (3) ended at 10820.17.

Index then pullback in wave (4) which ended at 10257.27. Wave (5) is currently in progress as another 5 waves impulse. Up from wave (4), wave 1 ended at 10608.39, and wave 2 pullback ended at 10299.31. Index resumes higher in wave 3 towards 10897.82, and wave 4 pullback is proposed complete at 10721.42.

Near term, while dips stay above 10264.68, expect Index to extend 1 more leg higher in wave 5 of (5) towards 10959.71 - 11178.42. This should also complete wave ((1)) in larger degree and end cycle from March 16 low. Afterwards, Index should pullback in wave ((2)) to correct cycle from March 16 in 3, 7, or 11 swing before turning higher again.

DAX 30 Minutes Elliott Wave Chart
Elliott Wave View: Impulsive Rally in DAX From March Low