Medical Properties Trust is a real estate investment trust that invests in healthcare facilities subject to NNN leases. Founded in 2003 and headquartered in Birmingham, Alabama, USA, it is a part of S&P400 mid-cap index. Investors can trade it under the ticker $MPW at NYSE. The company owns 438 properties in the United States, Germany, Switzerland, Italy, Spain, Portugal, United Kingdom, Australia, Finland and Colombia. Also, trust owns equity interest in several healthcare providers.
Therefore, investors looking to invest both in real eastate and healthcare, obtain a great deal when buying $MPW.
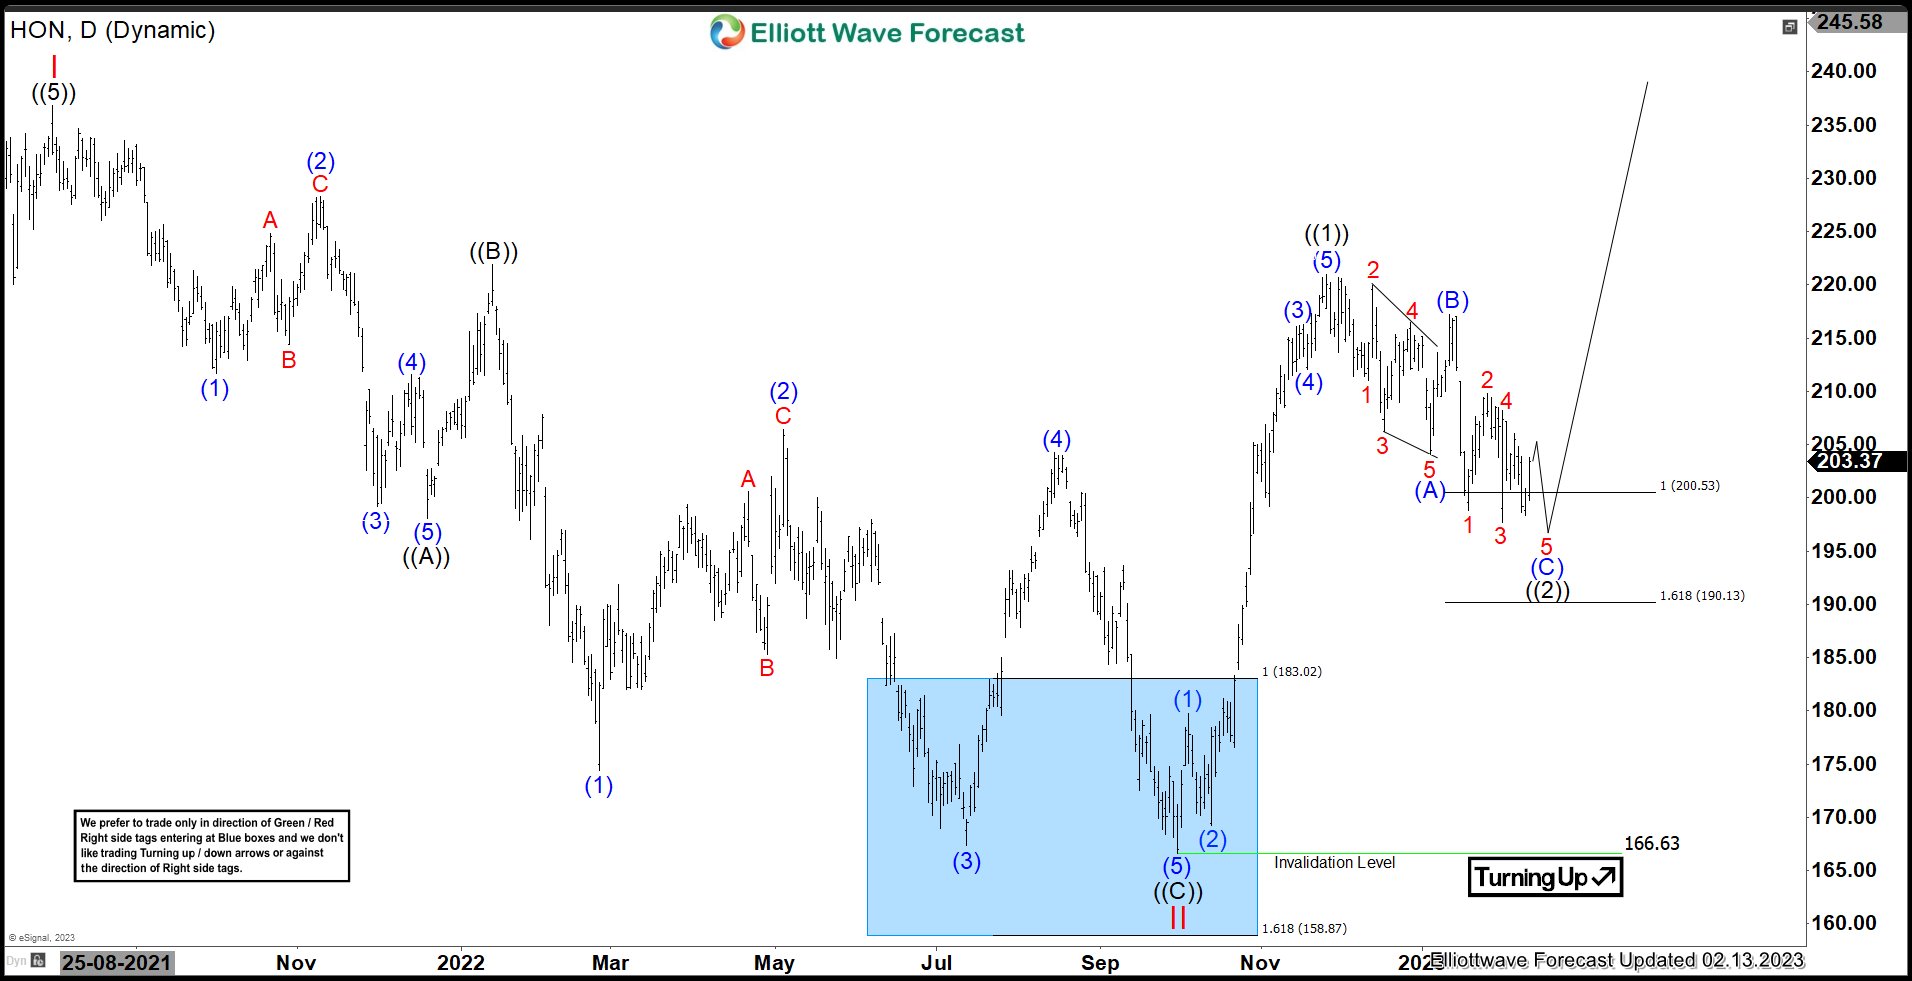
Investors and traders should stay long from 12.17-9.36 blue box area targeting 34.17-49.17 and even higher in the long-term.

Source: https://elliottwave-forecast.com/stock-market/medical-properties-trust-reacts-monthly/
Therefore, investors looking to invest both in real eastate and healthcare, obtain a great deal when buying $MPW.
Medical Properties Trust Monthly Elliott Wave Analysis 02.06.2023
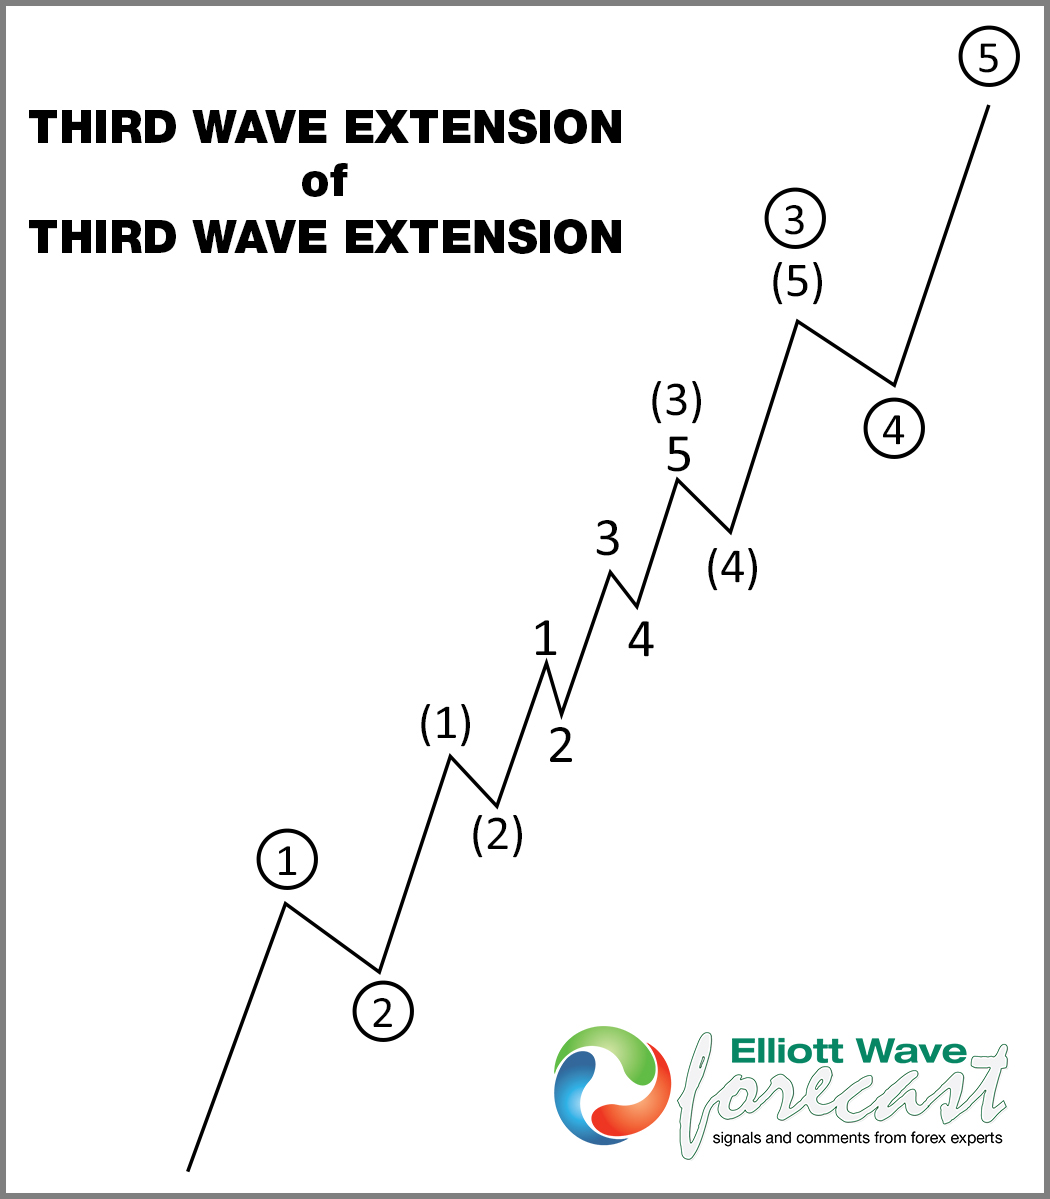
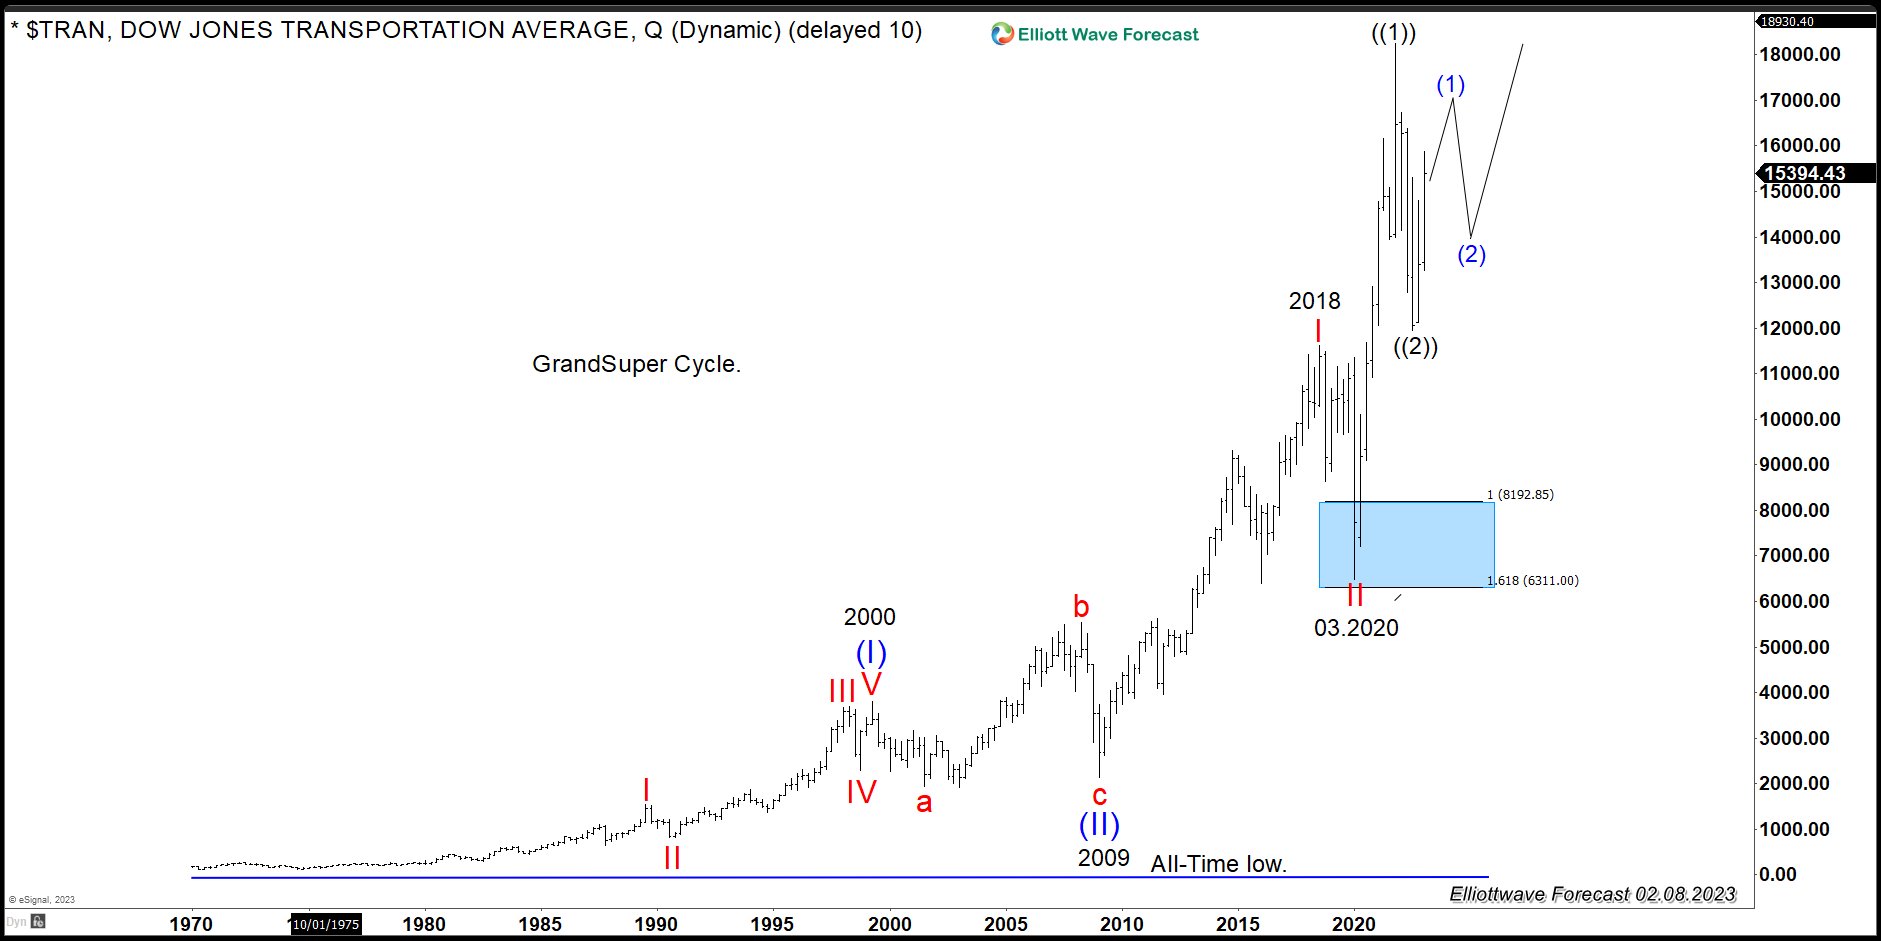
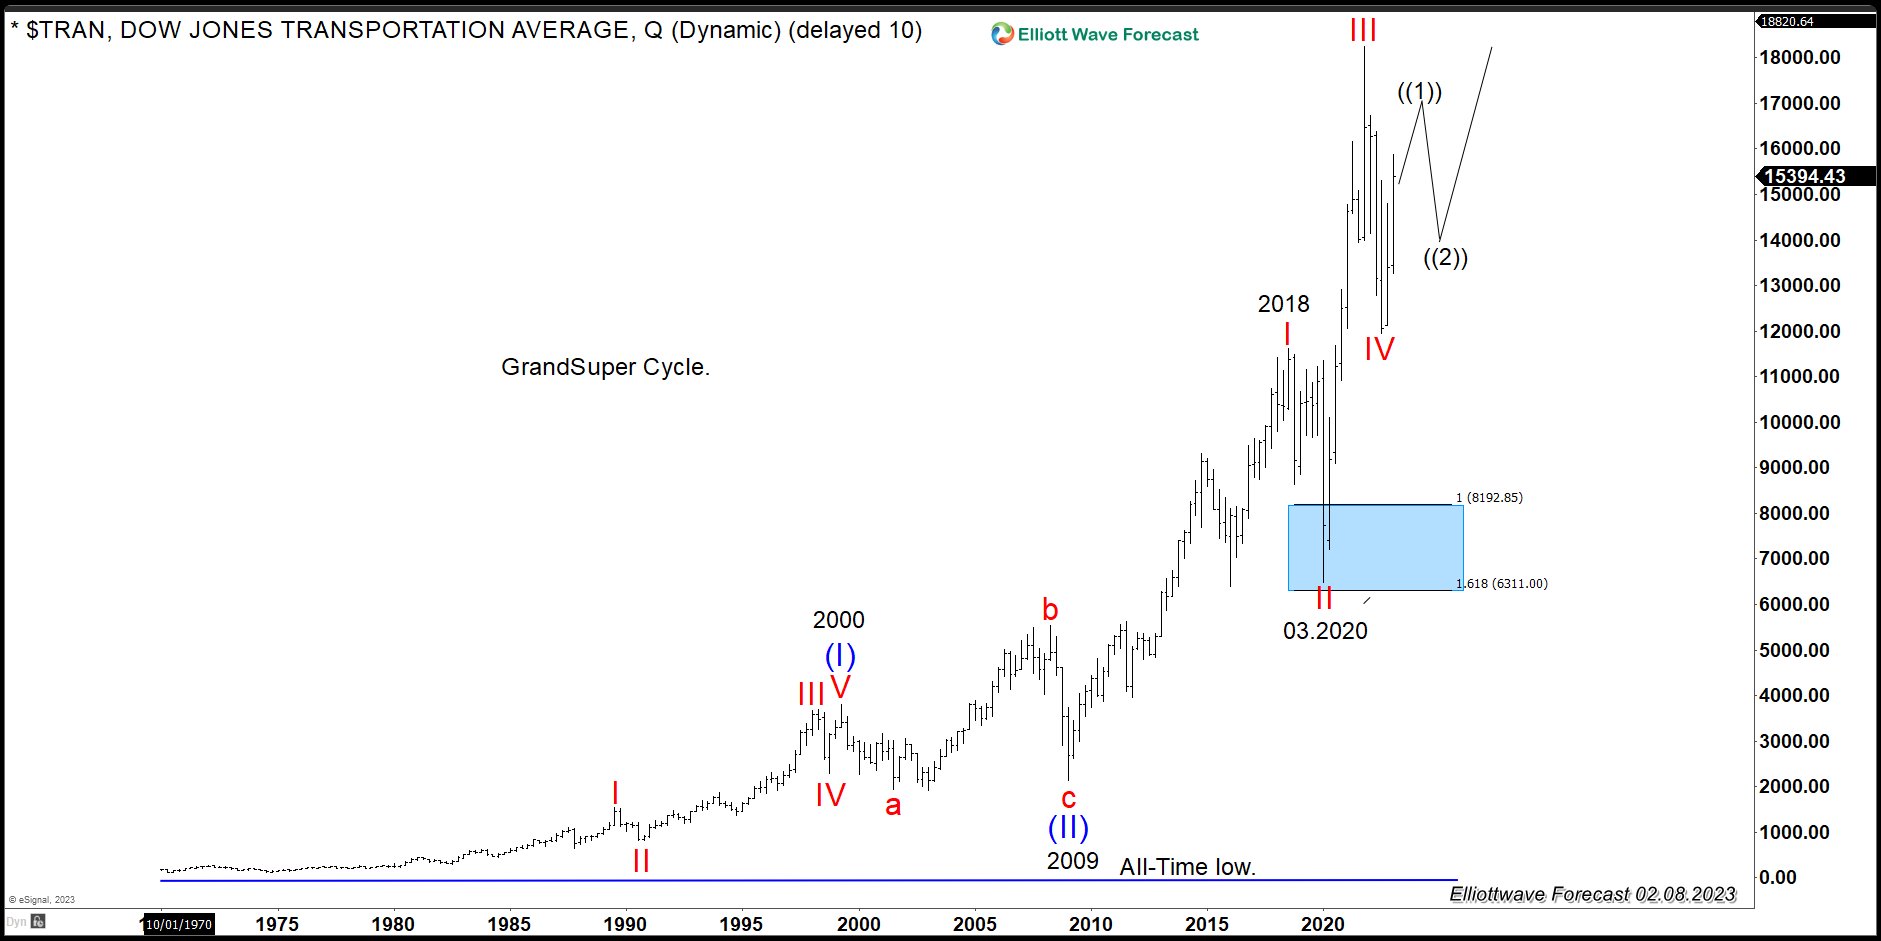
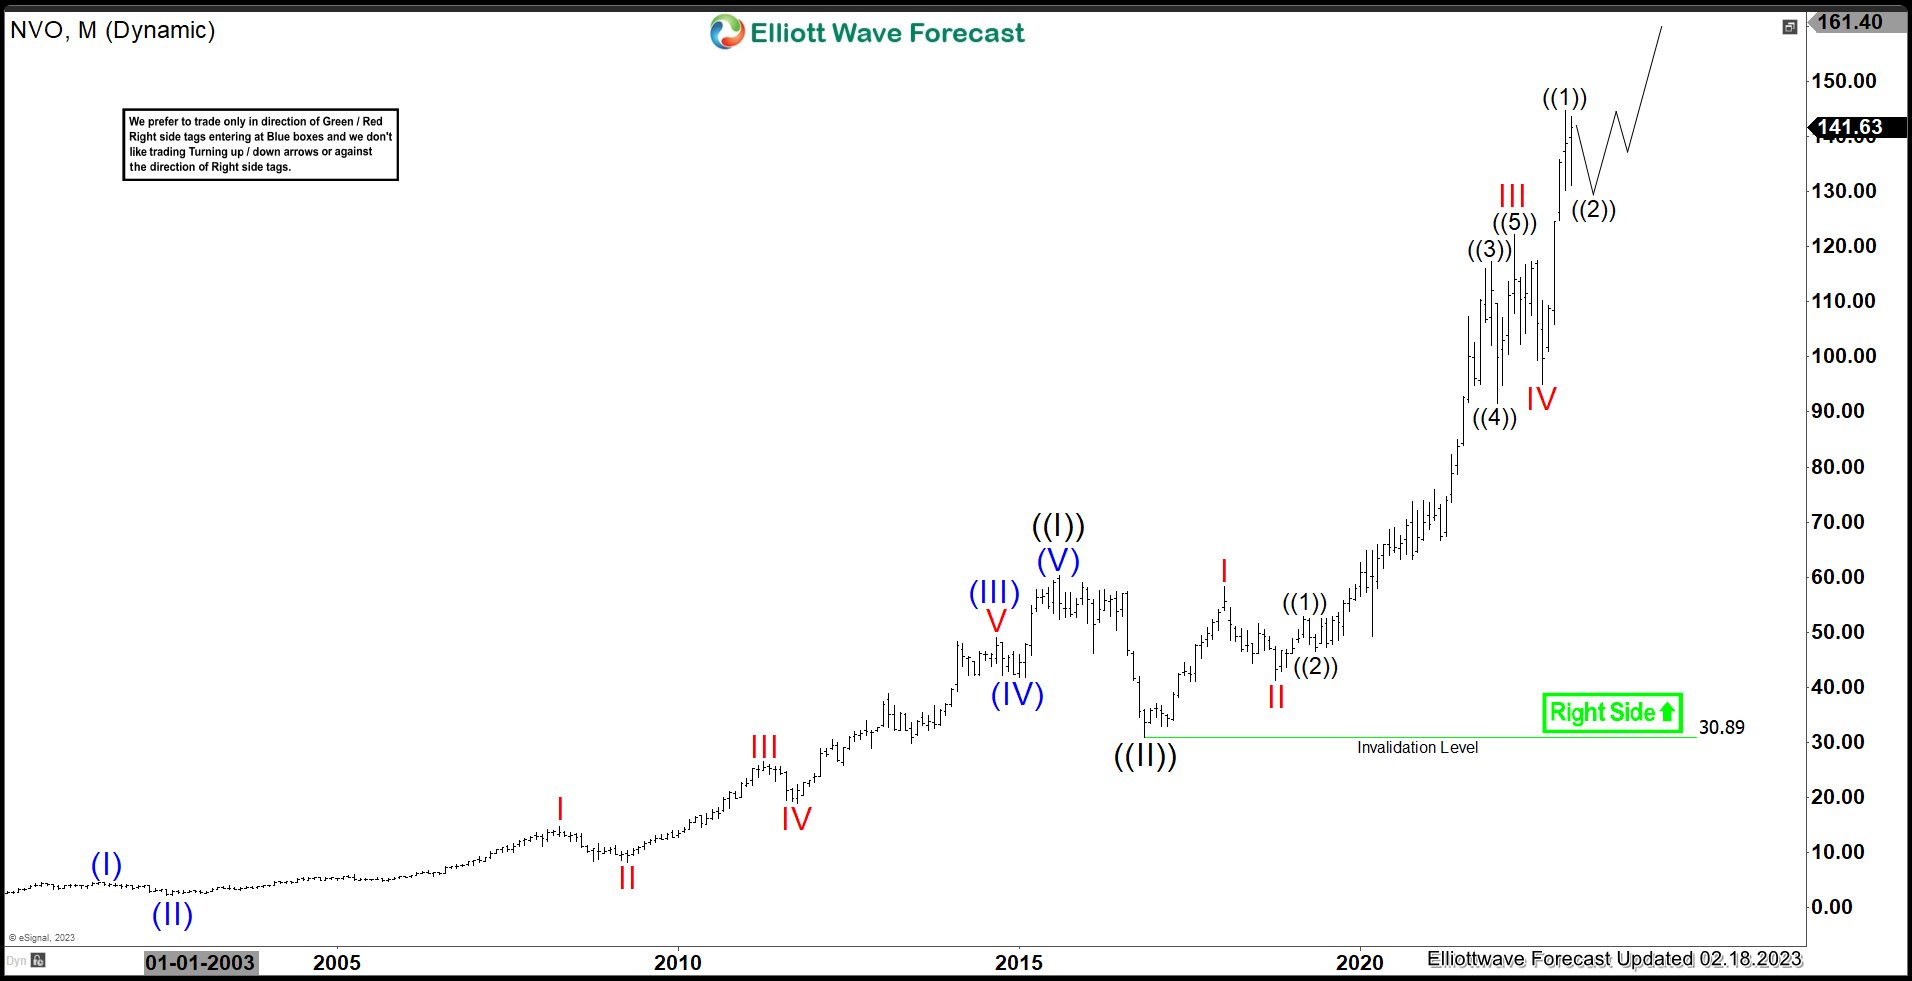
The monthly chart below shows the Medical Properties Trust stock $MPW traded at NYSE. From the all-time lows, the stock price has developed a cycle up in blue wave (I) of super cycle degree. It has unfolded as an Elliott wave leading diagonal pattern being 3-3-3-3-3 structure. Blue wave (I) has printed the all-time high in February 2020 at 24.29. After 5 waves higher in wave (I), the correction lower in wave (II) has developped a zigzag structure. Hereby, 3rd swing of the zigzag has reached 12.17-4.79 blue box area and the reaction is taking place. While above October 2022 lows at 9.90, $MPW might be in the initial stages of the the cycle in blue wave (III). The target for wave (III) will be 34.17-49.17 and even higher.

Medical Properties Trust Weekly Elliott Wave Analysis 02.06.2023
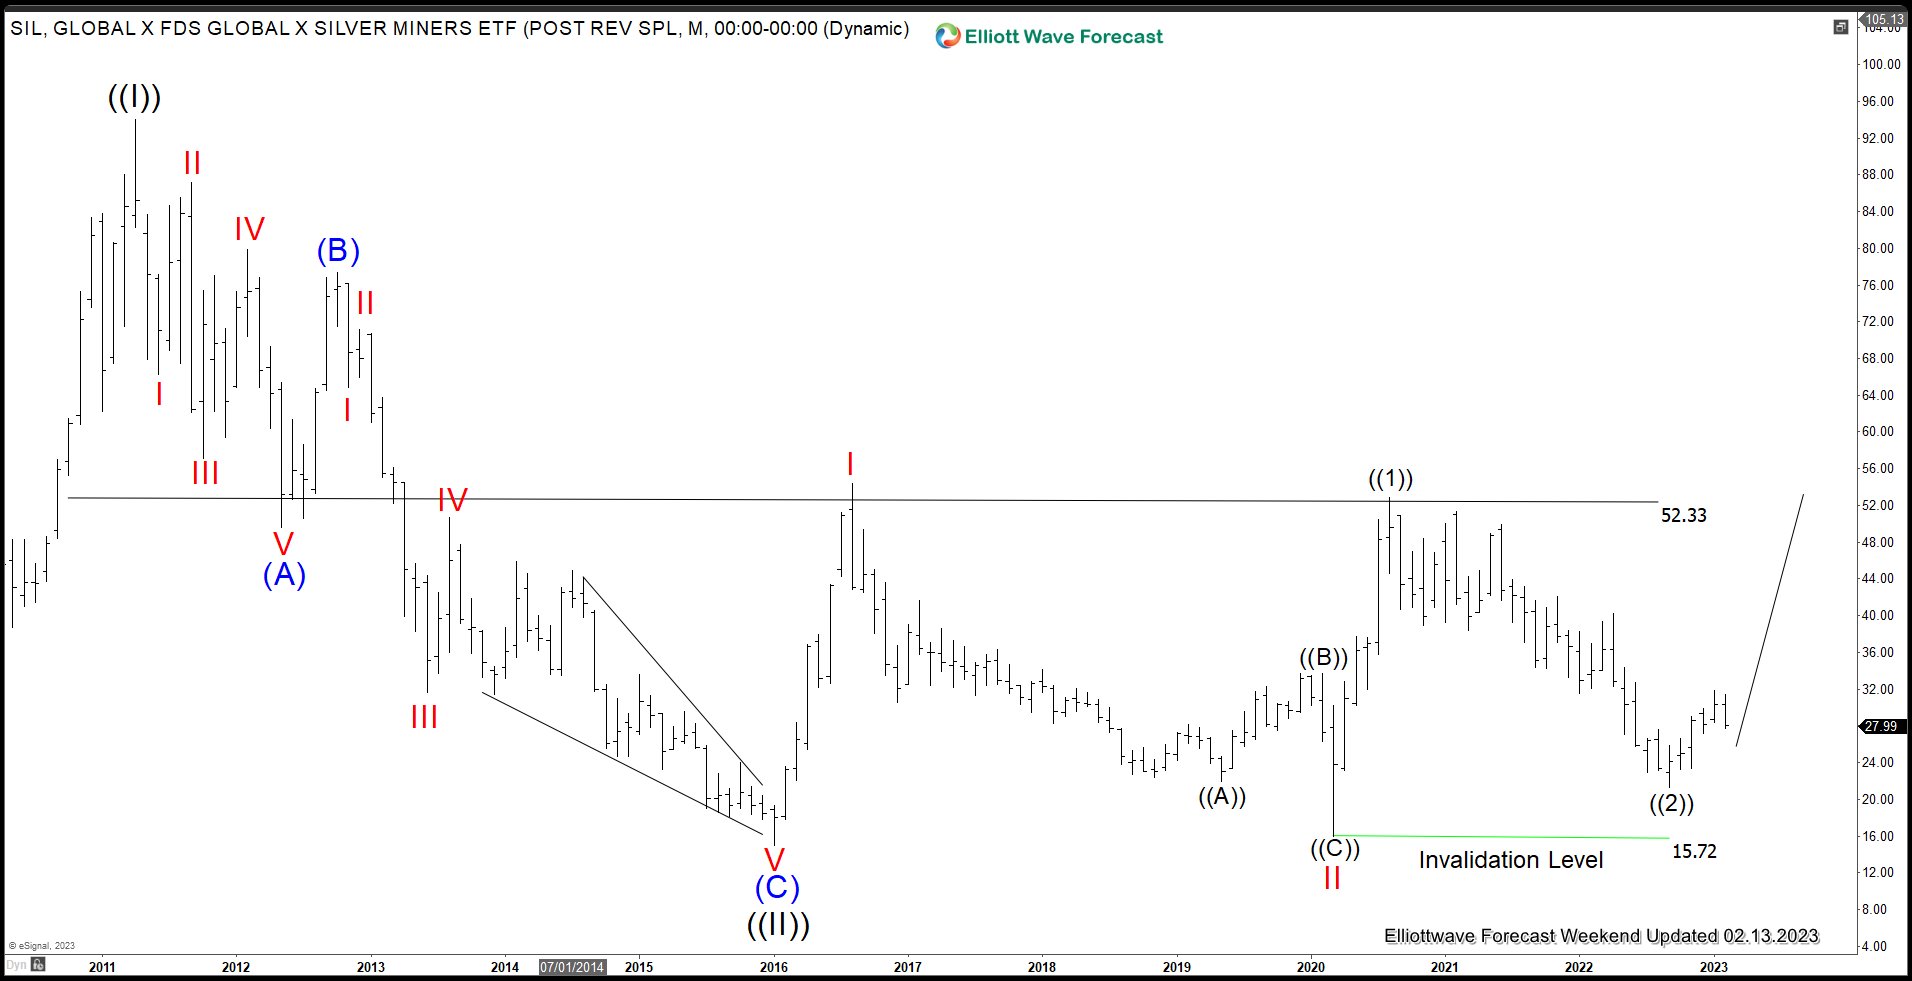
The weekly chart below shows in more detail the correction in blue wave (II) from the all-time highs towards the October 2022. First, red wave a has ended in March 2020 at 12.35 lows. Then, a connector in red wave b has printed a lower high in January 2022 at 24.13. From there, wave b has broken 12.35 lows opening up a bearish sequence. Finally, it has reached the 12.17-9.36 blue box area. There, reaction higher is taking place. Hereby, the descending trendline from January 2022 has been broken.Investors and traders should stay long from 12.17-9.36 blue box area targeting 34.17-49.17 and even higher in the long-term.

Source: https://elliottwave-forecast.com/stock-market/medical-properties-trust-reacts-monthly/