Elliottwave-Forecast

Master Trader
Feb 17, 2017
2,463
9
84
www.elliottwave-forecast.com
Mattel, Inc. (MAT), a children’s entertainment company, designs & produces toys & consumer products worldwide. The company operates through North America, International & American Girl segments. It is based in El Segundo, CA, comes under Consumer Cyclical sector & trades as “MAT” ticket at Nasdaq.

In the previous article, MAT ended wave I at $26.99 high as impulse sequence. Below there, it expected to correct lower in ((C)) of wave II between $18.23 - $14.54 area in zigzag correction before turning higher. It appears ended ((C)) leg at $16.21 low as II correction. Above there, it should either resumes higher in III red, which confirms above daily high or at least can see 3 swing bounce as the part of larger double correction.

MAT - Elliott Wave View from 9/27/2022 :​

It placed ((1)) at $9.44 high & ((2)) at $7.54 low. ((2)) was a flat correction retraced 0.618 Fibonacci level against ((1)). While above there, it extended higher in third wave extension. It ended ((3)) at $23.31 high on 4/23/2021. Below there, it favored ended ((4)) at $17.95 low on 10/04/2021. ((4)) was ended slightly above 0.382 Fibonacci retracement of ((3)). Finally, it ended ((5)) at $26.99 high on 5/04/2022 as wave I red.

MAT - Elliott Wave Latest Weekly View :​

Below wave I high, it placed ((A)) at $21.07 low on 5/24/2022 & ((B)) at $24.20 high as triangle on 9/12/2022. Finally, it ended ((C)) at $16.21 low as II as zigzag correction. Above there, it favors higher in (1) of ((1)) and expect short term upside before starts correcting in (2) 3, 7 or 11 swings. From $16.21 low, it either extend higher in III red or a connector higher in larger double correction in wave II.

MAT - Elliott Wave Latest Daily View :​

Source: https://elliottwave-forecast.com/stock-market/mat-expect-upside-to-continue/
 

Elliottwave-Forecast

Master Trader
Feb 17, 2017
2,463
9
84
www.elliottwave-forecast.com
Roblox (RBLX) is an online game platform and game creation system developed by Roblox Corporation that allows users to program games and play games created by other users. Created by David Baszucki and Erik Cassel in 2004 and released in 2006, the platform hosts user-created games of multiple genres coded in the programming language Lua.

RBLX January 2023 Daily Chart

RBLX January 2023 Daily Chart

Roblox (RBLX) finished a bullish movement in December 2021. We called that peak wave (I). Then a downtrend started, which developed a Elliott Wave double correction structure ending in May 2022 at $21.59. (If you want to learn more about Elliott Wave Theory, please follow these links: Elliott Wave Education and Elliott Wave Theory).

RBLX has remained sideways from this point to current prices. The bounce took the form of a leading diagonal ending at $53.99 and again started to move lower. This high we called wave I. Another double correction was formed again. The first 3 waves ended wave ((W)) at $33.08. Then the rally failed at $47.93, so it was the connector ((X)). From there we can see 3 more waves to the downside that completed the double correction and wave ((Y)) of II and wave II at $25.38. As price stays above this last level, stock should continue higher to complete a wave ((1)). Then we should have a nice opportunity to buy in the pullback after see 3 or 7 swings lower in wave ((2)).

Source: https://elliottwave-forecast.com/stock-market/roblox-rblx-opportunity-long-term-trade/
 

Elliottwave-Forecast

Master Trader
Feb 17, 2017
2,463
9
84
www.elliottwave-forecast.com
Hello fellow traders. In this technical article we’re going to take a quick look at the Elliott Wave charts of NETFLIX ($NFLX) stock. As our members know, we have been calling for the rally in the stock due to impulsive bullish sequences in the cycles from the May 12th low. We recommended members to avoid selling Netflix, while keep favoring the long side in near term. In the further text we are going to explain the Elliott Wave Forecast.

NETFLIX Elliott Wave 4 Hour Chart 1.18.2023​

Break of 12.13. peak made the stock bullish against the 273.13 low. Currently the stock is giving us short term pull back (2) which is correcting the cycle from the mentioned December's low. The stock is expected to find buyers in 3,7,11 swings. Decline from the peak looks like 5 waves , which suggests we got only first leg so far A of (2). We expect to see 3 waves bounce in B , and then another leg down, before further rally takes place.

Netflix

NETFLIX Elliott Wave 1 Hour Chart 1.20.2023​

We got short term bounce - wave B red, and another leg down C red as expected. The stock completed 3 waves pull back at 313.3 low and we got good rally toward new highs. Structure from the 313.3 low looks impulsive. We expect to stock to keep trading higher as far as the price stays above 313.3 low and as far as 273.2 pivot holds.

Keep in mind that market is dynamic and presented view could have changed in the mean time. You can check most recent charts in the membership area of the site. Best instruments to trade are those having incomplete bullish or bearish swings sequences. We put them in Sequence Report and best among them are shown in the Live Trading Room

Netflix

Source: https://elliottwave-forecast.com/stock-market/netflix-nflx-elliott-wave-bullish/
 

Elliottwave-Forecast

Master Trader
Feb 17, 2017
2,463
9
84
www.elliottwave-forecast.com
Hello Traders in this article we will see how we were forecasting XAU/USD to make the next leg higher within wave ((v)).
Gold since it found support back from 09.28.2022 it has been in a bullish cycle. Since then it has been creating incomplete bullish sequences. Here at Elliott Wave Forecast we use incomplete sequences to trade the right side. This way we separate clear tradable sequences from choppy structures. By doing that we take the highest probability trade setups. With the USDX selling off since the 09.28.2022 peak Gold had to follow as everyone knows that mainly it is inversely correlated with it.

First let's look at Gold when we saw the pullback in wave ((iv)).

XAU 1 Hour London Update 01.18.2023​


As we can see Gold made the pullback in wave ((iv)). It made a double in a-b-c (w)-(x)-(y) lower to complete wave ((iv)). From there we were anticipating the next leg higher in ((v)) to start.
Then let's see how it had developed next.

XAU 1 Hour New York Update 01.20.2023​


As we can see XAU/USD made the push higher and completing the first 3 waves of wave ((v)) and now pulling back in (iv) of ((v)) with one more high expected to end the 5 waves move in the minor degree of ((v)).

Source: https://elliottwave-forecast.com/commodities/xau-usd-forecasting-the-wave-v-higher/
 

Elliottwave-Forecast

Master Trader
Feb 17, 2017
2,463
9
84
www.elliottwave-forecast.com
In this technical blog, we will look at the past performance of 1-hour Elliott Wave Charts of Ali Baba ticker symbol: $BABA. We presented to members at the elliottwave-forecast. In which, the rally from the 23 December 2022 low unfolded as an impulse structure. And showed a higher high sequence favored more upside extension to take place. Therefore, we advised members not to sell the stock & buy the dips in 3, 7, or 11 swings at the blue box areas. We will explain the structure & forecast below:

BABA 1 Hour Elliott Wave Chart​

BABA Showing Perfect Reaction Higher From The Blue Box Area

Here’s 1hr Elliott wave chart from the 1/18/2023 Midday update. In which, the cycle from the 12/23/2022 low ended in wave 3 as an impulse structure at $118.10 high. Down from there, the stock made a pullback in wave 4 to correct that cycle. The internals of that pullback unfolded as Elliott wave zigzag structure where wave ((a)) at $114.34 low. Wave ((b)) ended at $116.93 high and wave ((c)) managed to reach the blue box area at $113.12- $110.78 area. From there, buyers were expected to appear looking for the next leg higher or for a 3 wave bounce minimum.

BABA 1 Hour Elliott Wave Chart​

BABA Showing Perfect Reaction Higher From The Blue Box Area

This is the 1hr Elliott wave Chart from the 1/20/2023 Midday update. In which the stock is showing a strong reaction higher taking place, right after ending the zigzag correction within the blue box area. Allowed members to create a risk-free position shortly after taking the long position at the blue box area.

Source: https://elliottwave-forecast.com/stock-market/baba-showing-perfect-reaction-higher-blue-box-area/
 

Elliottwave-Forecast

Master Trader
Feb 17, 2017
2,463
9
84
www.elliottwave-forecast.com
In the present article, we are going to take a look on the weekly chart of EURCHF: Euro Swiss forex pair. In a quiet natural way, this cross is a ratio of two pairs: EURUSD and USDCHF. Even though, both dollar linked pairs are by far more liquid instruments, the EURCHF shows its own character. Indeed, from January 2015 lows it develops a clean double three structure and follows hereby Fibonacci extension levels.

In our initial article from March 2020, we have forecasted another bullish cycle after 7 swings lower. As a matter of fact, the market has provided a short term bounce and correction continued as a larger 7 swings structure. Here, we take a view on EURCHF pattern in the past 8 years and provide an outlook with targets for coming 3-5 years.

EURCHF Weekly Elliott Wave Analysis 01.24.2023​

The weekly chart below shows the price behavior of the cross ratio EURCHF. From the lows of January 2015, the pair has developed a cycle higher in red wave x of a cycle degree. It has printed the highs in April 2018 at 1.2005. The advance is an Elliott wave zigzag pattern being a 3 swings corrective structure. Generally speaking, the correction might be over after 3 swings already. However, in contrast to stocks, forex is a range bound market. Therefore, the latter can trend also in corrective sequences.

From April 2018 highs, a correction lower in wave x has unfolded as a double three pattern being 3-3-3 structure. First, wave ((W)) has ended in May 2020 at 1.0492 lows. Then, a connector in wave ((X)) has printed a lower high in March 2021 at 1.1151. From there, wave ((Y)) has developed another 3 swings to the downside. Hereby, blue wave (A) of black wave ((Y)) has reached 1.0208-0.9952 intermediary range being 0.618-0.786 extension area. After a bounce in wave (B), the final swing in blue wave (C) of black wave ((Y)) has reached 0.9626-0.8684 full extension area. From that area, a strong reaction higher can be seen. Now, the bottom at 0.9407 lows is favored to be the end the entire correction of cycle from January 2015 lows.

From the September 2022 lows, EURCHF might be in the first stages of a new cycle in red wave y. While above 0.9407 lows, pair can reach in 3 swings 1.2811-1.4914 area. Hereby, intermediary area 1.1512-1.2083 should provide medium term resistance.

EURCHF Elliott Wave Weekly

Source: https://elliottwave-forecast.com/forex/eurchf-euro-swiss-weekly-bluebox/
 

Elliottwave-Forecast

Master Trader
Feb 17, 2017
2,463
9
84
www.elliottwave-forecast.com
Albemarle Corporation (ALB) develops, manufactures & markets engineered specialty chemicals worldwide. It operates through three segments, Lithium, Bromine & Catalysts. It is based in Charlotte, NC, comes under Basic Materials sector & trades under “ALB” ticker at NYSE.

ALB showing higher high sequence from March-2020 low, expecting more upside to continue. It ended impulse wave I at $291.48 low & II as zigzag correction at 169.93 low. While above there, it expects more upside in wave III as it already breaks above wave I high.

ALB - Elliott Wave Latest Weekly View :​

It ended the larger correction at $48.89 against 2017 high during global sell off in March-2020. Then, it favored ended ((1)) at $101 high & ((2)) at 79.06 low as shallow correction. Above there, it placed ((3)) at $188.35 high. While it favored ended ((4)) at $133.82 low. Finally, it ended ((5)) at $291.48 high in November-2021 as wave I. Below there, it corrected in zigzag structure & placed II at $169.93 low in February-2022.

ALB - Elliott Wave Latest Daily View:​

Above wave II low, it showing diagonal in ((1)). It placed (1) at $273.68 high & (2) at 189.25 low. It favored ended (3) at $308.24 high & (4) at $231.67 low. Above there, it placed (5) at $334.55 high as wave ((1)). It breaks above wave I high, calling for more upside to continue, while dips remain above February-2022 low of wave II. It proposed ended ((2)) at $208.57 low & above there, it favors higher in (1), expecting more upside to continue. It needs to breaks above ((1)) high to confirm the upside in ((3)) of III to avoid a double correction in ((2)).

Source: https://elliottwave-forecast.com/stock-market/alb-should-expect-continue-rally/
 

Elliottwave-Forecast

Master Trader
Feb 17, 2017
2,463
9
84
www.elliottwave-forecast.com
Hello Traders. In today’s article, we will look at the past performance of Uber Technologies Inc. ($UBER). In our last update we explained that the stock can find buyers from the equal legs are at $20.31 but it looks like the market has different plans for $UBER.

$Uber Elliottwave 1.01.2023 Older View (Daily):​

$UBER

$Uber Elliottwave Latest View (Daily):​

$UBER

The pullback did not manage to break below the October lows. However, buyers appeared on December 27th and is now retesting the peak on November 15th 2022 at $31.82. The pivot at 11.15.2022 gave up in our system which runs ahead of price action indicating that more upside is expected to happen. The structure looks like a nest and a break above blue (1) at $34.33 will cause acceleration higher. We at Elliott Wave Forecast use market cycles and correlation in our analysis so when we correlate $UBER to other Stocks and ETFs, we expect price to reach $42.00 -47.00 once a breakout takes place. We like buying dips in 3, 7 or 11 swings against $19.90.

Source: https://elliottwave-forecast.com/stock-market/elliott-wave-suggests-uber-remain-supported/
 

Elliottwave-Forecast

Master Trader
Feb 17, 2017
2,463
9
84
www.elliottwave-forecast.com
JPMorgan Chase & Co. (JPM) is an American multinational investment bank and financial services holding company headquartered in New York City and incorporated in Delaware. As of December 31, 2021, JPMorgan Chase is the largest bank in the United States, the world's largest bank by market capitalization, and the fifth-largest bank in the world in terms of total assets, with total assets totaling to US$3.831 trillion.

JPM Daily Chart September 2022

JPM Daily Chart September 2022

September last year, we gave a triple correction as an option to complete wave ((2)) in JPM. That was if the stock broke the blue box area in 109.08 - 106.13. The triple correction has a (W), (X), (Y), (XX), (Z) structure. Wave (XX) ended at 133.24 and from there we needed 3 swings down to complete wave (Z). Wave A of (Z) ended at 106.06 low. The 3 swings bounce ended at 124.24 as wave B. Then, we had to see a movement down towards 96.92 – 80.04 to complete wave C of (Z) and wave ((2)) before market continue with a rally.

JPM Daily Chart January 2023

JPM Daily Chart January 2023

JPM went down building an impulse to complete wave C of (Z) and wave ((2)). Unfortunately, the dip did not reach the minimum target of the blue box and bounced from 101.22. Since here, the stock has gained 40% of its value and should continue to move higher. We think we must be in the middle of a new impulse. Wave 1 ended at 138.75 and corrective wave 2 at 128.24. Currently, as long as we are above 128.24, JPM should continue higher to complete wave 3.

JPM Daily Chart January 2023 Alternative

JPM Daily Chart January 2023 Alternative

Another alternative to this new impulse, it is building a leading diagonal from 101.22 low. In this case, wave 1 would not yet be finished and with a further high it would complete wave 1. We should see this in the next month of February. If we make one more high and then break the low of the wave ((iv)), most likely it would be doing this structure shown. This would remain valid as long as wave 2 is above 101.22.

Source: https://elliottwave-forecast.com/stock-market/jpm-missed-blue-box-rally-expected/
 

Elliottwave-Forecast

Master Trader
Feb 17, 2017
2,463
9
84
www.elliottwave-forecast.com
Hello fellow traders. In this technical blog we’re going to take a quick look at the Elliott Wave charts of SPY published in membership area of the website. As our members know, SPY is showing incomplete bullish sequences in the cycle from the 12.22.2022 low . That makes the ETF bullish against the 387.22 pivot. Recently SPY has given us short term correction. We got 3 waves pull back which found buyers right at equal legs area as we expected. In the further text we are going to explain the Elliott Wave Forecast and trading setup.

SPY 1h Elliott Wave Analysis 1.25.2023​

SPY made 5 waves up in the cycle from the December 22nd low. Break of 1 red peak ( 01.17) made the ETF bullish against the 387.22 low. Currently we are getting 3 waves pull back which is correcting the cycle from the mentioned low. Equal legs area is already reached at 396.75-393.63 and from there we expect to see turn higher. As the ETF is currently in bullish cycle, we expect buyers to appear at the marked area for further rally toward new highs ideally.

Reminder: You can learn about Elliott Wave Rules and Patterns at our Free Elliott Wave Educational Web Page.

SPY

SPY 1h Elliott Wave Analysis 1.26.2023​

SPY found buyers at the equal legs area :396.75-393.63 as expected. Pull back ((ii)) black ended at 393.6 low. We got nice rally toward new highs. As a result, members who took short trades mad positions risk free. ( Put SL at BE) and took partial profits.

Keep in mind market is dynamic and presented view could have changed in the mean time. You can check most recent charts in the membership area of the site. Best instruments to trade are those having incomplete bullish or bearish swings sequences.We put them in Sequence Report and best among them are shown in the Live Trading Room.


Source: https://elliottwave-forecast.com/trading/spy-calling-rally-buying-dips-blue-box/
 

Elliottwave-Forecast

Master Trader
Feb 17, 2017
2,463
9
84
www.elliottwave-forecast.com
ASML Holding N.V., (ASML) develops, produces, markets, sells & services advanced semiconductor equipment systems consisting of lithography, metrology & inspection related systems for memory & logic chipmakers. It operates in Japan, South Korea, Singapore, Taiwan, China, Netherlands, Europe, US & others Asian countries. It is based in Veldhoven, Netherlands, comes under Technology sector & trades as ‘ASML’ ticker at Nasdaq.

ASML ended weekly sequence as impulse wave (I) at $895.93 high & proposed ended (II) at $363.15 low. The correction in wave (II) was the largest correction ever as double three lower ended at $363.15 low. Above there, it favors higher either in (III) or at least a larger 3 swing bounce.

ASML - Elliott Wave Latest Weekly Chart :​

Since 1995, it is showing higher high sequence, which ended at $895.93 high as wave (I). It placed wave I at $319.22 high & II at $191.25 low. Wave II was 0.382 Fibonacci retracement of previous degree. Above there, it favors ended III at $710.97 high & IV at $664.83 low. Wave IV was shallow correction & resume higher in V. It ended V as (I) at $895.93 high as impulse sequence.

ASML - Elliott Wave Latest Daily View :​

Below there, it corrected in wave (II) at $363.15 low in double three correction within blue box areas. It was 0.618 Fibonacci retracement of (I). While above there, it placed (1) at $643.36 & (2) at $529.01 low. Currently, it favors higher in 3 of (3) & expect short term upside to continue as the part of ((1)). It should remain supported in 3, 7 or 11 swings at extreme areas against (2) low in short term sequence.

Source: https://elliottwave-forecast.com/stock-market/asml-ready-next-rally/
 

Elliottwave-Forecast

Master Trader
Feb 17, 2017
2,463
9
84
www.elliottwave-forecast.com
Siemens SE is a German multinational conglomerate company and by revenue the largest industrial manufacturing enterprise in Europe. Company’s principal business divisions are Industry, Energy, Healthcare, Infrastructure & Cities. Founded in 1847 and headquartered in Munich, Germany, the company employs approx. 385’ooo people worldwide. Siemens is a part of both DAX40 and of SX5E indices. One can note that the economic success of the company is truly accompanied by a strong performance of the Siemens stock.

In the initial article from February 2021, we have forecasted a rally to the new highs. We were right. The price has printed the new all-time highs in January 2022 at 157.96. Then, we saw the stock price pulling back from the all-time highs. In the last article from June 2022, we have expected to take place after doing zigzag lower lower. However, March 2022 lows have broken and the market has decided to do a double correction before turning higher. In the current blog, we analyze the structure of the price movement and provide the targets.

Siemens Monthly Elliott Wave Analysis 01.30.2023​

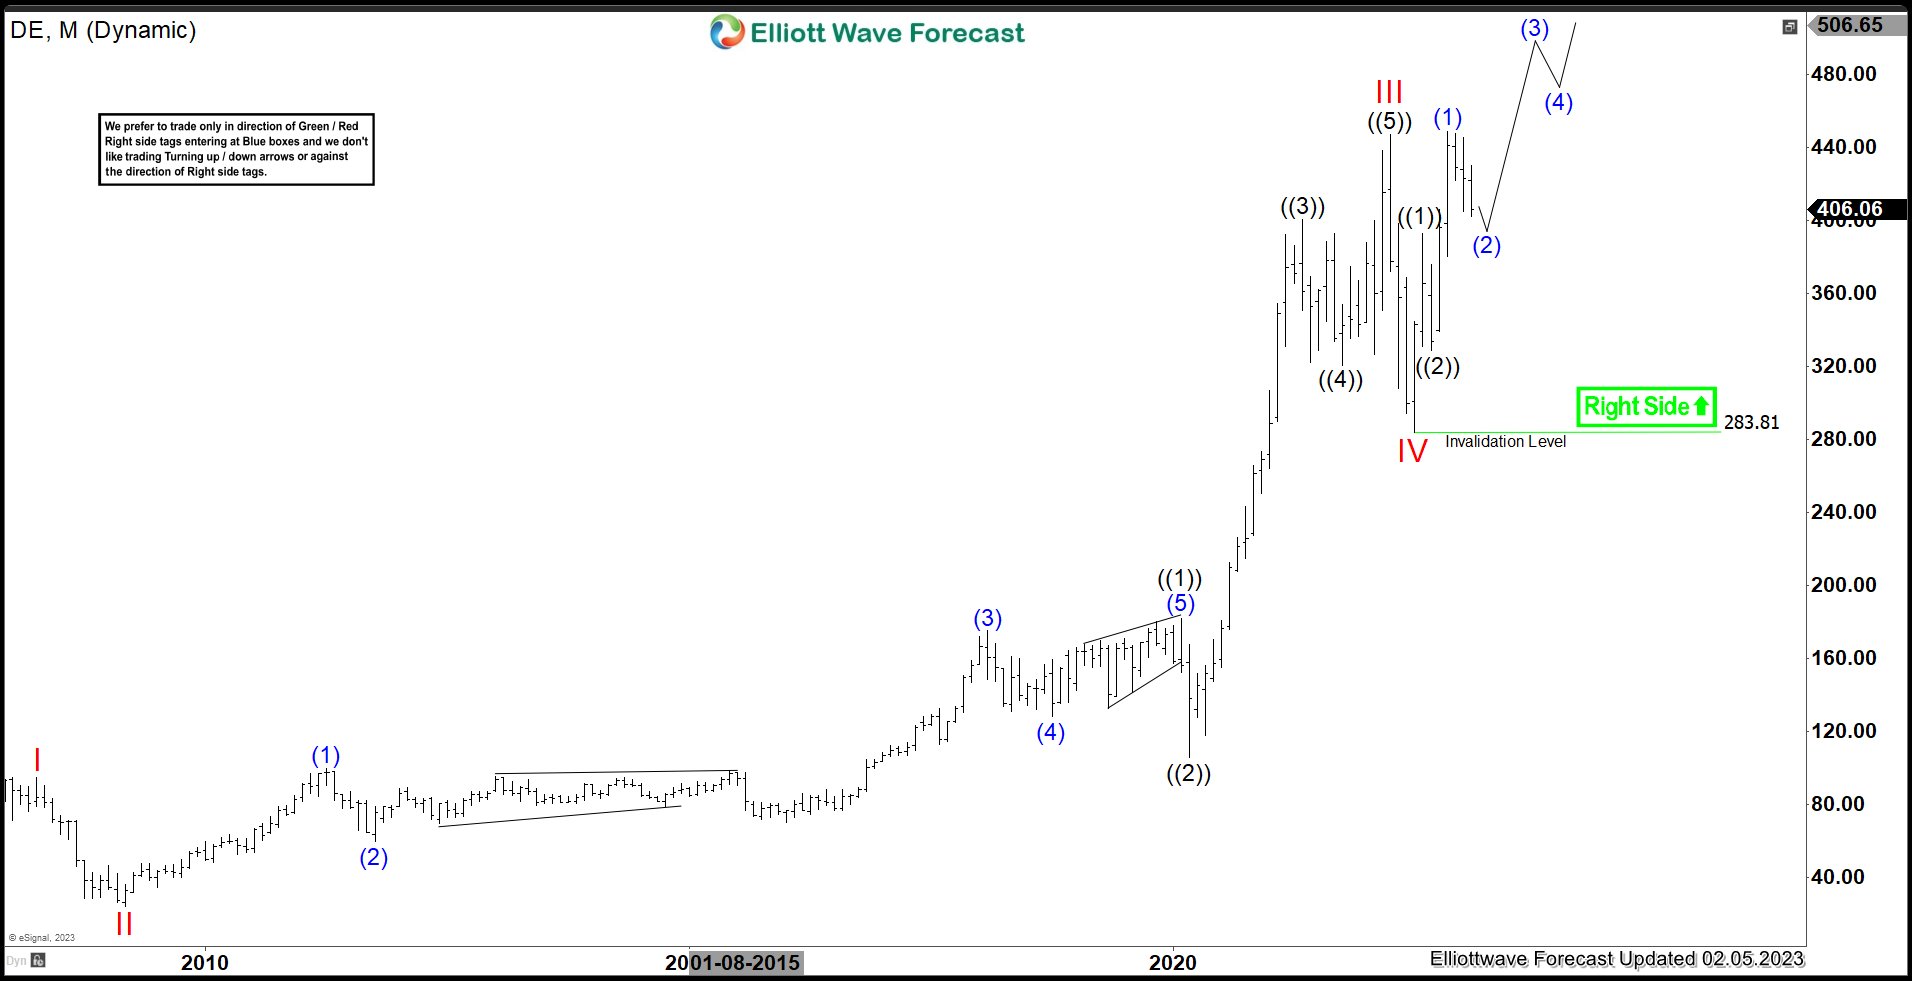
The monthly chart below shows the Siemens stock $SIE traded at XETRA. From the all-time lows, the stock price has developed a cycle higher in black wave ((I)) of grand super cycle degree towards May 2001 highs at 89.75. From there, a correction lower in black wave ((II)) has unfolded as an Elliott wave expanded flat pattern. It has printed an important bottom on October 2008 at 32.07. From October 2008 lows, a new cycle in wave ((III)) has been already confirmed by breaking above 89.75 highs.

A closer look on the price action from 2008 lows unveils the development of another nest being blue wave (I) of black wave ((III)). The 2008 cycle has reached towards 133.50 on May 2017. From there, a correction has unfolded as a zigzag structure in wave (II). The consolidation has ended in March 2020 at 58.77. While above there, Siemens is already within blue wave (III). Break above the 133.50 high has confirmed that. A target for wave (III) will be 159.95-222.60 area and beyond. Within larger wave (III), one can distinguish already a first nest comprising red waves I and II. While above July 2022 lows, red wave III is in progress.

Siemens Elliott Wave Monthly

Siemens Daily Elliott Wave Analysis 01.30.2023​

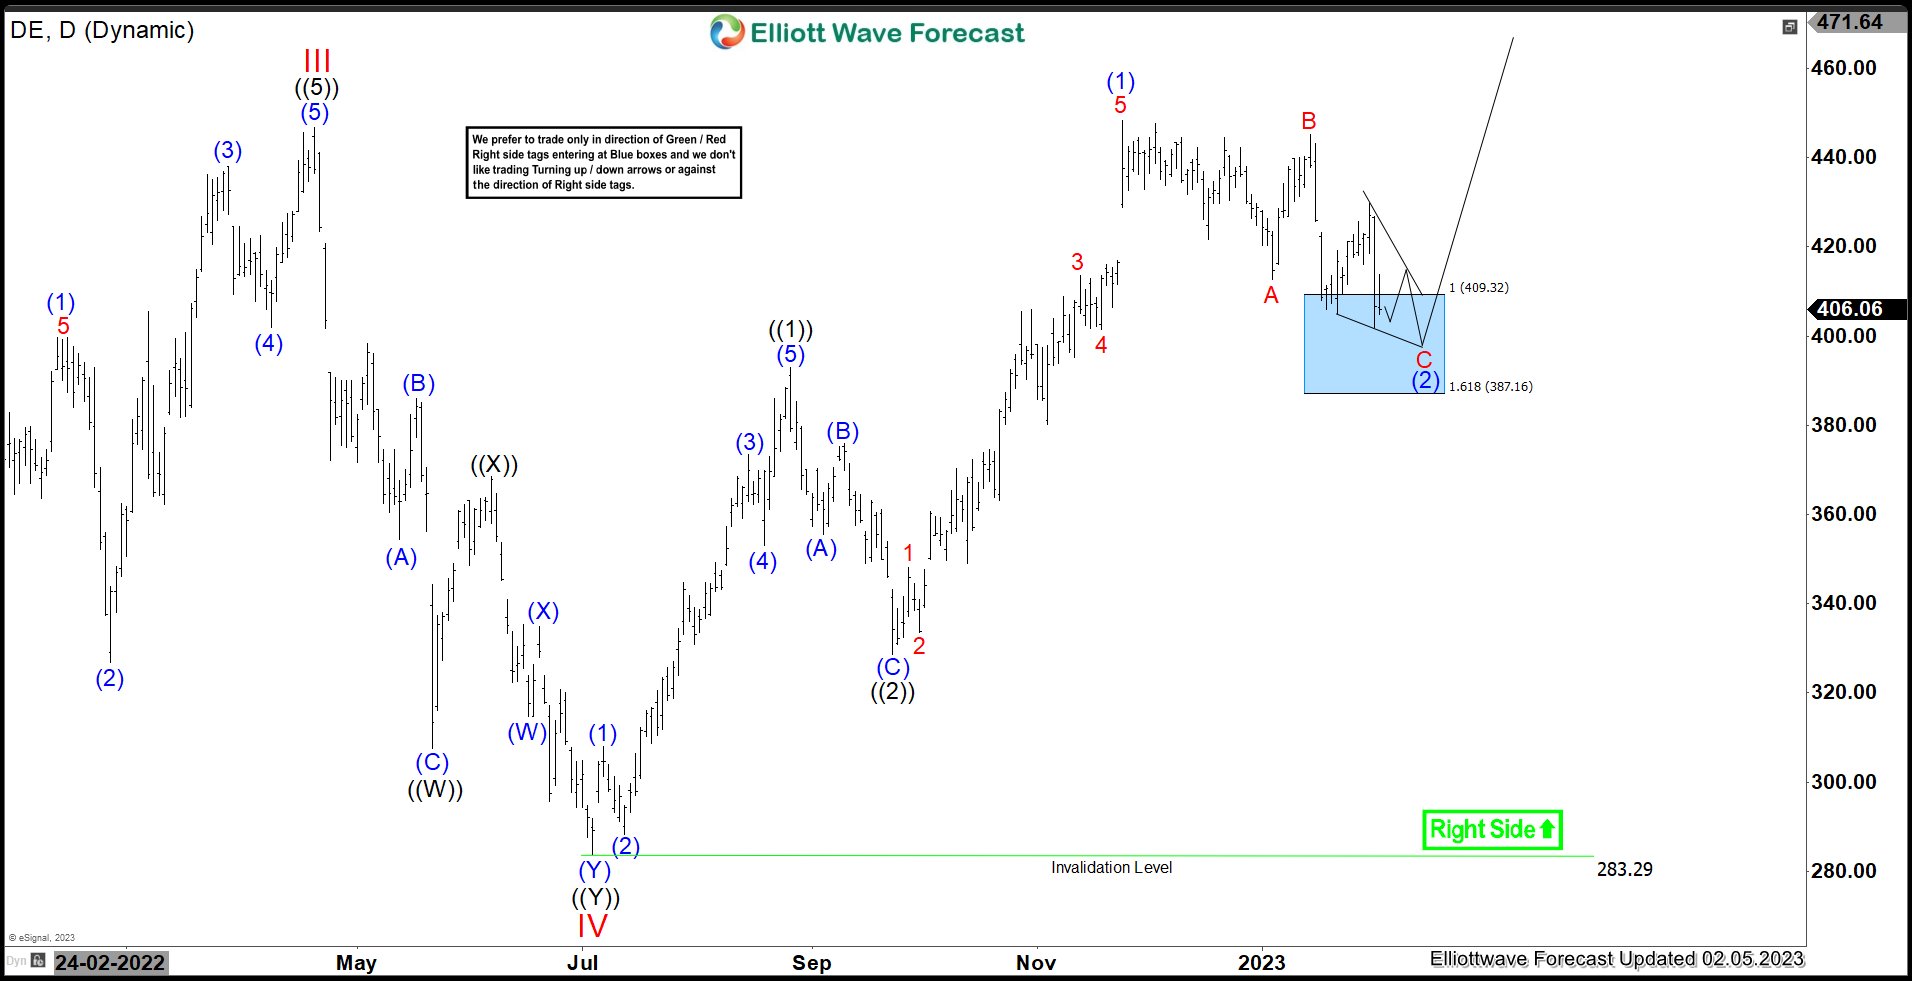
The daily chart below shows in more detail the decline lower from all-time highs in red wave II and first stages of the advance higher in red wave III. After a cycle in red wave I towards January 2022 highs at 157.96, a pullback in wave II shows a double three structure. Firstly, an Elliott wave zigzag lower in black wave ((W)) has printed a medium-term bottom in March 2022 at 111.38 lows. Secondly, a bounce in wave ((X)) has set a connector at 138.08 highs. Finally, another zigzag in black wave ((Y)) has reached towards 93.67 lows in July 2022. It is the preferred view that the correction in red wave II has ended. Now, red wave III is in progress. The target for it will be 192.92-254.30 area and even higher.

A closer look on the relation between waves ((W)) and ((Y)) within red wave II unveils a truncation. As a matter of fact, the price extension of black wave ((Y)) has reached 0.618-0.786 extension being 105.84-97.08 area but has missed to reach full extension being 85.92-58.77 area. However, RSI divergence has been erased and the rally in the cycle from July 2022 lows has broken the descending channel. Therefore, the correction in wave II is complete. Break above the January 2022 highs will confirm that.

Within red wave III, one can see already 3 swings which give an idea of an impulsive move higher. Firstly, blue wave (1) has set a high at 112.70 in September 2022. Secondly, blue wave (2) has set a short-term bottom at 95.07 lows. Then, swing in blue wave (3) has reached towards 1.618 extension. It has surpassed it confirming being wave (3) of an impulse with an extension in the 3rd wave. Now, wave (3) has reached 2.618x of the wave (1) being 144.72. It can still extend higher. Then, pullback in wave (4) should find support in 3, 7, 11 swings and another leg higher in blue wave (5) should finish the umpulsive move in black wave ((1)). Investors and traders can be looking to buy pullback in black wave ((2)) for an acceleration higher.

Siemens Elliott Wave Daily

Source: https://elliottwave-forecast.com/stock-market/siemens-impulsive-move/
 

Elliottwave-Forecast

Master Trader
Feb 17, 2017
2,463
9
84
www.elliottwave-forecast.com
Hello Traders, in this blog we will see how we were able to forecast in advance the wave ((iii)) higher in NQ_F. Nasdaq has been one of the weakest Indices within 2022 and has been seeing a relief bounce rally as of recent. We will see below how here at Elliott Wave Forecast were able to forecast in advance the upcoming wave ((iii)) of C in NQ_F.

Let have a look on how we saw Nasdaq during 01.16.23. It had ended B leg at 10754.28 and since then has been showing 5 waves off these lows. Thus confirming C leg in progress. In the 1 hour cycle it is within wave i of (v) of ((i)).

NQ_F 01.16.23 1 hour London Update chart​

NQ_F Short-term Elliott Wave Analysis 1.16.2023

Now let's check out our latest chart from 01.27.23. As seen it is within wave iii of (iii) of ((iii)). As we can see Nasdaq completed the pullback in wave ((ii)) and accelerated higher in wave ((iii)). With wave (i) and (ii) completed now it is trading within iii of (iii) of ((iii)). Near term, after it ends (iii) and pullback in (iv) it is expected higher in (v) of ((iii)).

NQ_F 01.27.2023 1 hour Midday Update​

NQ_F Short-term Elliott Wave Analysis 1.27.2023

Source: https://elliottwave-forecast.com/st...ng-the-wave-iii-higher-in-the-nasdaq-futures/
 

Elliottwave-Forecast

Master Trader
Feb 17, 2017
2,463
9
84
www.elliottwave-forecast.com
In this article we’re going to take a quick look at the Elliott Wave charts of GOLD, published in members area of the website. As our members know, we have been favoring the long side in the commodity since the September of 2022. We recommended members to avoid selling , while keep favoring the long side. Recently we got 3 waves pull back that has reached our buying zone. In the further text we are going to explain the Elliott Wave Forecast and trading strategy.

GOLD Elliott Wave 1 Hour Chart 1.28.2023​

Current view suggests cycle from the 1726.4 low is still in progress as 5 waves structure. Currently, GOLD is doing wave ((iv)) pull back . The price structure of the pull back looks incomplete, it shows lower low sequences. So far we can count only 5 swings down from the peak. If we assume 6th swing is completed, we could be doing now last push down - 7th swing toward marked zone. Consequently we expect to get more short term weakness toward 1903.98-1884.74 area which would be our next buying zone. We don’t recommend selling the commodity against the main bullish trend. Strategy is waiting for the price to reach blue box- equal legs zone, before entering the long trades again. Once bounce reaches 50 Fibs against the (x) blue high , we will make long position risk free ( put SL at BE) and take partial profits. Invalidation for the long trades is break of 1.618 fib ext : 1884.7

Quick reminder:

Our charts are easy to trade and understand:
Red bearish stamp+ blue box = Selling Setup
Green bullish stamp+ blue box = Buying Setup
Charts with Black stamps are not tradable.

You can learn more about Elliott Wave Patterns at our Free Elliott Wave Educational Web Page.

GOLD

GOLD Elliott Wave 1 Hour Chart 1.31.2023​

GOLD made 7th swing down and reached buying zone at 1903.98-1884.74 ( blue box) as expected. The commodity found buyers at the Blue Box zone and we are getting good reaction from there. The price reached and exceeded 50 fibs against the (x) blue connector. So, members who took the long trade are enjoying profits now in a risk free positions. We would like to see break above ((iii)) black peak to confirm next leg up is in progress.

Keep in mind that market is dynamic and presented view could have changed in the mean time. You can check most recent charts in the membership area of the site. Best instruments to trade are those having incomplete bullish or bearish swings sequences. We put them in Sequence Report and best among them are shown in the Live Trading Room

GOLD

Source: https://elliottwave-forecast.com/trading/gold-xauusd-forecasting-path-buying/
 

Elliottwave-Forecast

Master Trader
Feb 17, 2017
2,463
9
84
www.elliottwave-forecast.com
In this technical blog, we will look at the past performance of 1-hour Elliott Wave Charts of AMD. We presented to members at the elliottwave-forecast. In which, the rally from the 06 January 2023 low unfolded as an impulse structure. And showed a higher high sequence favored more upside extension to take place. Therefore, we advised members not to sell the stock & buy the dips in 3, 7, or 11 swings at the blue box areas. We will explain the structure & forecast below:

AMD 1-Hour Elliott Wave Chart​

AMD Starting To Turn Higher From The Blue Box Area

Here’s the 1hr Elliott wave chart from the 1/29/2023 Weekend update. In which, the short-term cycle from the 1/19/2023 low ended in wave ((i)) as an impulse structure at $77.12 high. Down from there, the stock made a pullback in wave ((ii)) to correct that cycle. The internals of that pullback unfolded as Elliott wave double three structure where wave (w) at $72.09 low. Wave (x) ended at $77.08 high and wave (y) managed to reach the blue box area at $71.96- $68.81 area. From there, buyers were expected to appear looking for the next leg higher or for a 3 wave bounce minimum.

AMD Latest 1-Hour Elliott Wave Chart​

AMD Starting To Turn Higher From The Blue Box Area

This is the 1hr Latest Elliott wave Chart from the 1/31/2023 Midday update. In which the stock is showing a strong reaction higher taking place, right after ending the double correction within the blue box area. Allowed members to create a risk-free position shortly after taking the long position at the blue box area. However, a break above $77.12 high is still needed to confirm the next extension higher.

Source: https://elliottwave-forecast.com/stock-market/amd-starting-turn-higher-blue-box-area/
 

Elliottwave-Forecast

Master Trader
Feb 17, 2017
2,463
9
84
www.elliottwave-forecast.com
Hello fellow traders. In this technical blog we’re going to take a quick look at the Elliott Wave charts of EURUSD, published in members area of the website. As our members know, recently EURUSD made a pull back that has had a form of Elliott Wave Zig Zag pattern. We expected the pair to find buyers at the extreme zone from the 01/26 peak. In the further text we are going to explain the Elliott Wave Pattern and the forecast

Before we take a look at the real market example, let’s explain Elliott Wave Zigzag.

Elliott Wave Zigzag is the most popular corrective pattern in Elliott Wave theory . It’s made of 3 swings which have 5-3-5 inner structure. Inner swings are labeled as A,B,C where A =5 waves, B=3 waves and C=5 waves. That means A and C can be either impulsive waves or diagonals. (Leading Diagonal in case of wave A or Ending in case of wave C) . Waves A and C must meet all conditions of being 5 wave structure, such as: having RSI divergency between wave subdivisions, ideal Fibonacci extensions and ideal retracements.

If you are new to Elliott Wave we recommend you to check out our Free Elliott Wave Educational Web Page and download our Free Elliott Wave Book.

EURUSD

At the chart below we can see what Elliott Wave Zig Zag pattern looks like in real market.

EURUSD H1 London Update 01.31.2023​

EURUSD is giving us pull back against the 1.048 low. Correction looks incomplete at the moment. First leg has a form of 5 waves, so we assume pull back is unfolding as Elliott Wave Zig Zag Pattern. That means both ((a)) and ((c)) legs should have a form of 5 waves structure. At this stage ((c)) leg is still missing another wave down . We are calling for another marginal push lower toward marked reversal area: 1.0820-1.0763 ( buyers zone). That area we got by measuring extreme zone with Fibo Extension tool ((a)) - ((b)). At that zone sellers will be taking profits and we expect buyers to appear for further upside toward new highs ideally.

Reminder : You can learn more about Zig Zag and other Elliott Wave Patterns at our Free Elliott Wave Educational Web Page.

EURUSD

EURUSD H1 London Update 02.01.2023​

The pair is giving us nice reaction from the marked zone and we count 2 red red pull back completed at 1.0799 low. Now, as far as the price holds above that low we expect to see further extension higher and break above 1 red high : 01/26 to confirm next leg up is in progress.

EURUSD

EURUSD H1 London Update 02.02.2023​

The pair made further rally as expected. We got break of 1 red ( 01/26) peak, confirming next leg up is in progress. EURUSD can remain supported in near term as far as 1.0800 pivot holds. It should ideally keep finding buyers in 3,7,11 swings.

Keep in mind that market is dynamic and presented view could have changed in the mean time. You can check most recent updates in the membership area of the website. Remember that not every chart is trading recommendation. Best instruments to trade are those having incomplete bullish or bearish swings sequences. We put them in Sequence Report and best among them are shown in the Live Trading Room. You can check most recent charts in the membership area of the site.

EURUSD

Source: https://elliottwave-forecast.com/elliottwave/eurusd-elliott-wave-zig-zag/
 

Elliottwave-Forecast

Master Trader
Feb 17, 2017
2,463
9
84
www.elliottwave-forecast.com
Good Day Traders, In this technical blog, we are going to take a look at the Elliott Wave path in Chevron ($CVX).

Chevron Corporation is an American multinational energy corporation predominantly in oil and gas. It is the second-largest direct descendant of Standard Oil, and originally known as the Standard Oil Company of California, it is headquartered in San Ramon, California, and active in more than 180 countries. Within oil and gas, Chevron is vertical integrated and is involved in hydrocarbon exploration, production, refining, marketing and transport, chemicals manufacturing and sales, and power generation.

$CVX 4H Elliott Wave Analysis Feb 5th 2023:​

$CVX

The 4H Chart above shows the cycle from 9.28.2022 low unfold in a 5 wave impulsive structure that ended red III on 11.14.2022 at $189.68. The stock then started a pullback to correct the cycle against 9.28 low in a Double Three structure (WXY). The correction is still unfolding and so far has completed the first and second leg. As long as price remains below ((X)) at $189.00, $CVX is expected to remain weak. Bounces should find sellers and continue lower towards the Blue Box area at $166.35 – 152.32. We like buying the blue box area as long as the pivot at $139.96 remains intact.

Source: https://elliottwave-forecast.com/stock-market/chevron-cvx-provides-blue-box-opportunity/
 

Elliottwave-Forecast

Master Trader
Feb 17, 2017
2,463
9
84
www.elliottwave-forecast.com
Deere & Company (DE) manufactures & distributes various equipment worldwide. The company operates through four segments: Production & Precision Agriculture, small Agriculture & Turf, Construction & Forestry, & Financial services. The company is based in Illinois, US, comes under Industrials sector & trades as “DE” ticker at NYSE.

DE is showing higher high sequence as the part of Impulse wave. It placed IV at $283.81 low on 7/06/2022 & above there, it favors higher in wave V of (I). It favors upside to continue & should remain supported in 3, 7 or 11 swings.

DE - Elliott Wave Latest Monthly View:​

In monthly sequence, it placed I at $94.89 high & II at $24.51 low. Above there, it extended higher in wave III as third wave extension, which finished at $446.76 high. In wave III, it placed ((1)) at $181.99 high & ((2)) at $106.14 low. It favored ended ((3)) at $400.34 high as extended wave & ((4)) at $320.50 low as 0.236 Fibonacci retracement correction. Finally, it ended ((5)) at $446.76 high as wave III. Below there, it placed IV at $283.81 low in double correction at 0.382 Fibonacci retracement level against I.

DE - Elliott Wave Latest Daily View:​

Above wave IV low, it favors higher in wave V of (I). It placed ((1)) at $392.93 high & ((2)) at $328.62 low on 9/23/2022. It favors higher in ((3)) of V & should remain supported in 3, 7 or 11 swings pullback at extreme areas. It placed (1) of ((3)) at $448.40 high & favors pullback in C of (2) towards $409.32-$387.16 area, where it should find support & resumes higher. Alternatively, the current move can be pullback in (4) of ((1)) & later expect new high to be (5), which ends ((1)) sequence before a larger pullback in ((2)) correction against 7/06/2022 low. In either the case, it expects to continue higher, while dips remain above 7/06/2022 low of wave IV.

DE - Elliott Wave Monthly Alternate View:​

Source: https://elliottwave-forecast.com/stock-market/de-impulsive-rally-favors-upside/
 

Elliottwave-Forecast

Master Trader
Feb 17, 2017
2,463
9
84
www.elliottwave-forecast.com
Hello fellow traders. In this article we’re going to take a quick look at the Elliott Wave charts of RTY_F, published in members area of the website. As our members know Russell has been showing incomplete bullish sequences in the short term cycles from the 1730.3 and 1645 lows. Consequently we were calling for a further extension toward new highs. Recently Russell made a short term pull back that has reached its target area and found buyers. In the further text we are going to explain the Elliott Wave Forecast.

Russell Elliott Wave 1 Hour Chart 01.31.2023​

Russell futures is giving us correction against the 1831.7 low. Break of 01/18 high made RTY_F bullish against the 1831.7 pivot in near term and we expect it to keep finding buyers in 3,7,11 swings. Currently we are getting intraday (ii) blue correction. Pull back already reached Equal legs zone at 1890.3-1871.8 area and we are expecting to see turn higher any moment. We don't recommend selling it and expect buyers to ideally appear at the marked zone for the further rally toward new high ideally or for a 3 waves bounce at least.

You can learn more about Elliott Wave Patterns at our Free Elliott Wave Educational Web Page.

Russell

Russell Elliott Wave 1 Hour Chart 02.01.2023​

Pull back completed right at equal legs zone at 1890.3-1871.8 . Russell found buyers at the marked zone and we are getting good reaction from there. Rally from the buyers zone made break of previous peak confirming next leg up is in progress. Wave (ii) is done and we should be ideally keep trading higher within wave (iii).

Keep in mind that market is dynamic and presented view could have changed in the mean time. You can check most recent charts with target levels in the membership area of the site. Best instruments to trade are those having incomplete bullish or bearish swings sequences. We put them in Sequence Report and best among them are shown in the Live Trading Room


Russell

Source: https://elliottwave-forecast.com/trading/russell-rty_f-found-buyers-equal-legs/
 

Elliottwave-Forecast

Master Trader
Feb 17, 2017
2,463
9
84
www.elliottwave-forecast.com
Cisco Systems, Inc., commonly known as Cisco (CSCO), is an American-based multinational digital communications technology conglomerate corporation headquartered in San Jose, California. Cisco develops, manufactures, and sells networking hardware, software, telecommunications equipment and other high-technology services and products. Cisco specializes in specific tech markets such as: the Internet of Things (IoT), domain security, videoconferencing, and energy management with leading products including Webex, OpenDNS, Jabber, Duo Security, and Jasper.

CSCO Daily Chart February 2023

CSCO Daily Chart February 2023

At the end of 2021, Cisco finished an impulsive structure at 64.33 which we called wave (I). From this high, CSCO has been down nearly a year. We can see a zig zag 5-3-5 structure. The first bearish impulse ended at 40.81 as wave a. Wave b bounced and ended at 50.05. To complete the corrective structure, we had another push that fell to 38.73 to complete wave c and wave (II).

In October 2022, CSCO had a strong bullish reaction even breaking above 50.05. Therefore, this rupture of wave b makes us to think that the cycle that began at the high of 2021 ended as wave (II). Up from 38.73, we can see 5 waves which ended at 50.74 and we label it as wave ((1)). Here, we see 3 swings down which form wave (A) at 45.65. From this level, CSCO can continue the rally without any problem. However, market conditions should keep the stock lower, so we are calling a flat 3-3-5 correction. The flat correction should end wave ((2)) above 38.73 and continue the bullish move.

Source: https://elliottwave-forecast.com/stock-market/csco-ended-bearish-cycle-continue-rally/