Elliottwave-Forecast

Master Trader
Feb 17, 2017
2,453
9
84
www.elliottwave-forecast.com
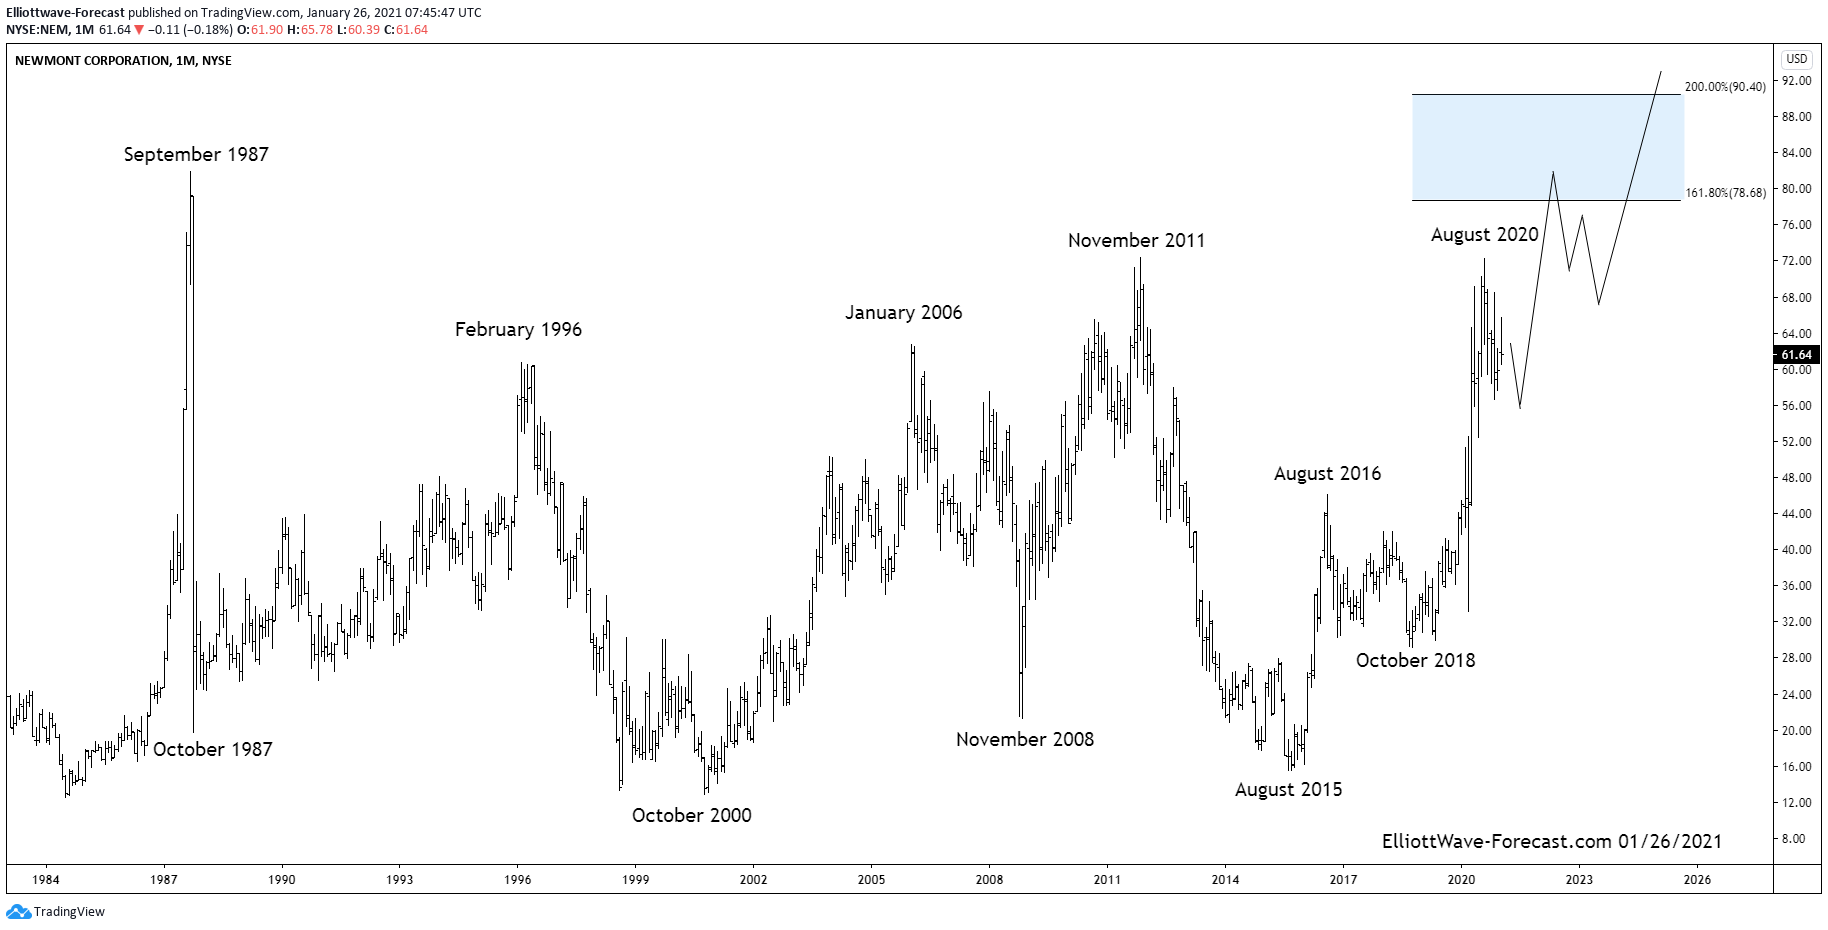
Pfizer Long Term Bullish Trend and Elliott Wave Cycles $PFE

The Pfizer Long Term Bullish Trend and Elliott Wave Cycles suggest the stock price will be trending higher. The cycles project it should continue toward the April 1999 highs while it is above the March 2020 lows. From the beginning of the stock trading it had a couple decades long uptrend cycle to the April 1999 peak. This is where the analysis begins on the chart at the larger degree blue wave (I).

Firstly I will mention that is roughly a 10 year decline in the blue wave (II) to the March 2009 lows. This was certainly long enough in time and price to correct the previously mentioned decades long up trend cycle. The pullback was a basic seven swing double three correction. You can see the subdivisions of the larger degree red w and y subdivided into three swings each as well. The connector wave red x appeared to have been a triple three although it is not of any significance now. It served the purpose at the time of being the connector wave.

Secondly I will talk about the impulsive bounce from the March 2009 larger degree blue wave (II) lows. I would also like to mention you can see the guidelines for reading Elliott Wave structures at our website. From the March 2009 lows the larger degree red I subdivided into a clear five waves. There was enough room on the chart to show the subdivision the wave ((2)) lows to the wave ((3)) highs into five waves of smaller degree in blue. The analysis and conclusion continues below the chart.

PFIZER Monthly Chart $PFE​


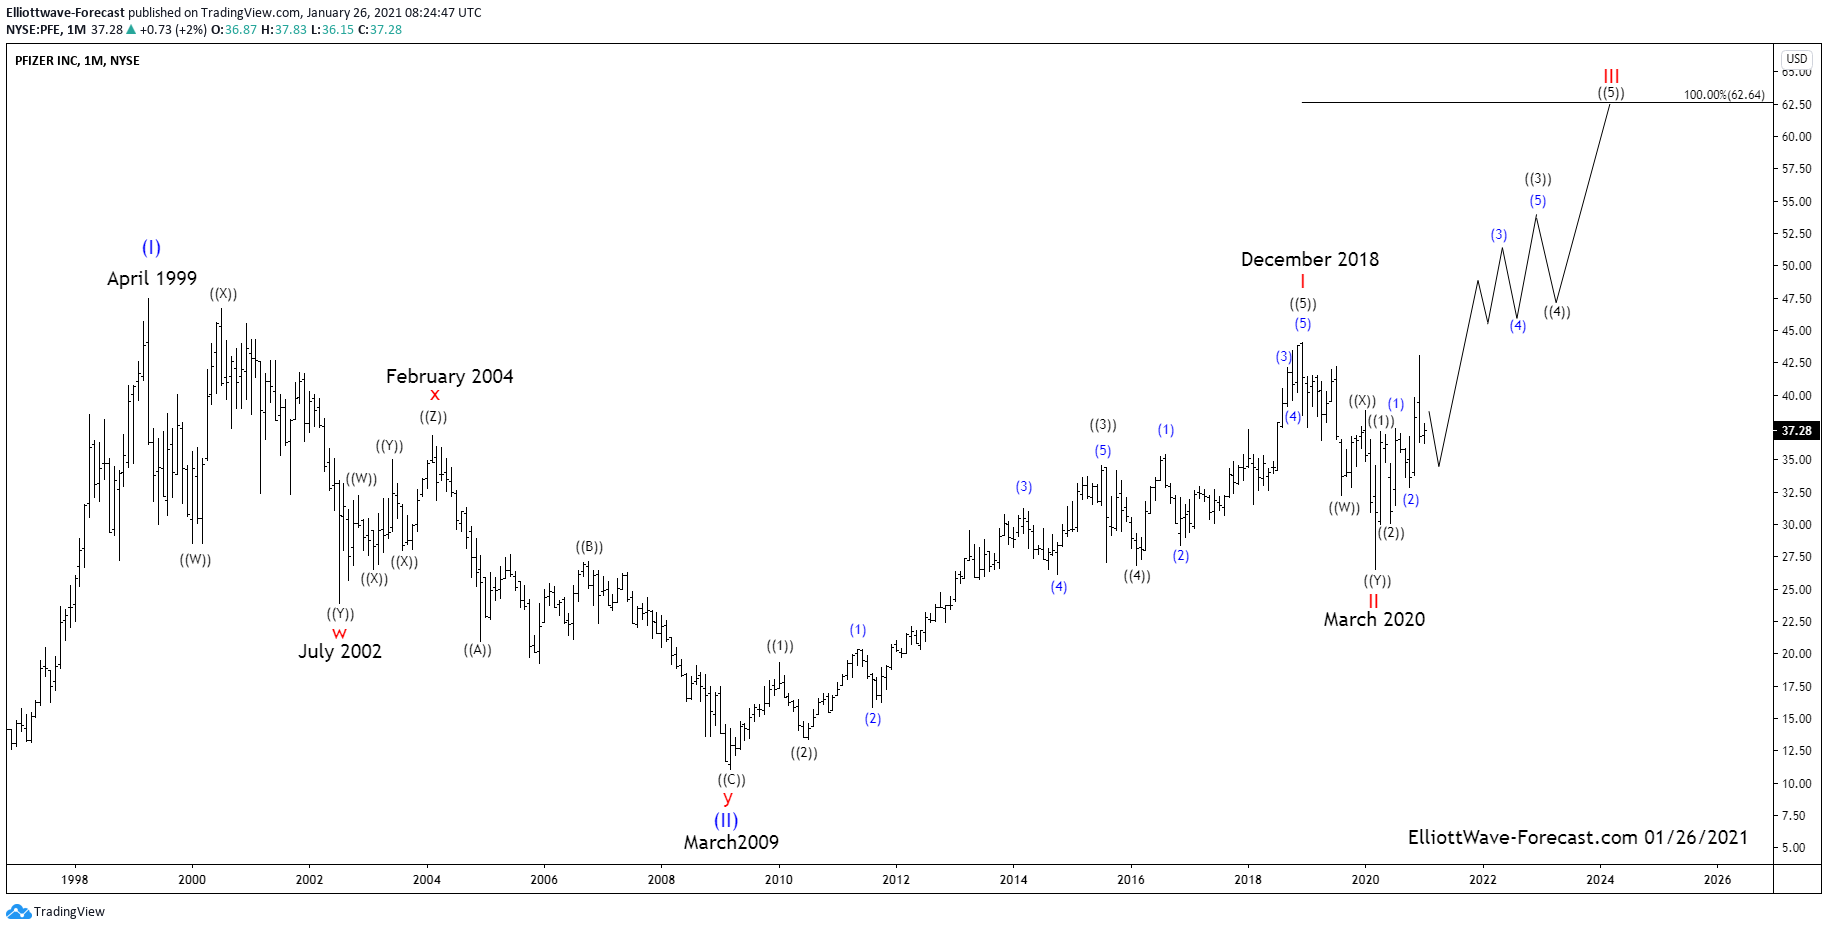
Thirdly as you can see the wave ((4)) lows in February 2016 to the December 2018 highs was also extended enough to show the subdivision of the wave ((5)) cycle. I also will mention some of the technical aspects of why the red I and II is favored in place to give that target area.

The stock clearly shows a five waves impulse from the 2009 lows. The read on the momentum indicators like rsi suggested the dip to the March 2020 lows corrected the whole cycle from the March 2009 lows.

In conclusion, ideally the stock will go higher while above the March 2020 lows. To get the longer term target area beginning at 62.64 is as follows. Take the Fibonacci extension tool on your chart platform and begin at the point of the March 2009 lows. From there go up to the point of the red I peak then back down to the red wave II low. That will give a target extension area where the current red wave III is equal to the red wave I at 62.64.

As mentioned that is where the target area begins. Higher would be more preferable as we sometimes see a wave III reach the 161.8 Fibonacci extension or greater. Once it ends it will only be expected to correct the cycle up from the March 2020 lows. This should be in a relatively shallow .236 to .382 Fibonacci retracement of the wave III cycle. Afterward it will be expected to be turning higher again.

Source: https://elliottwave-forecast.com/st...rm-bullish-trend-and-elliott-wave-cycles-pfe/
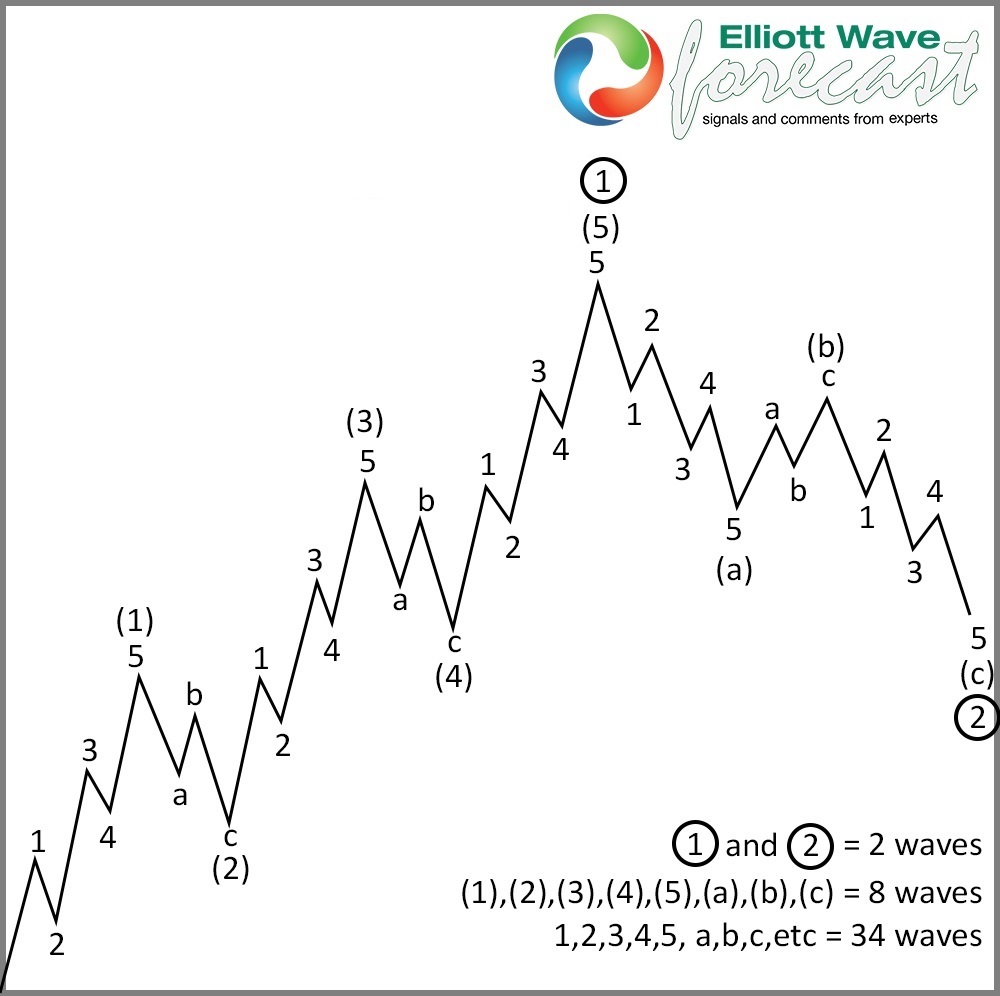
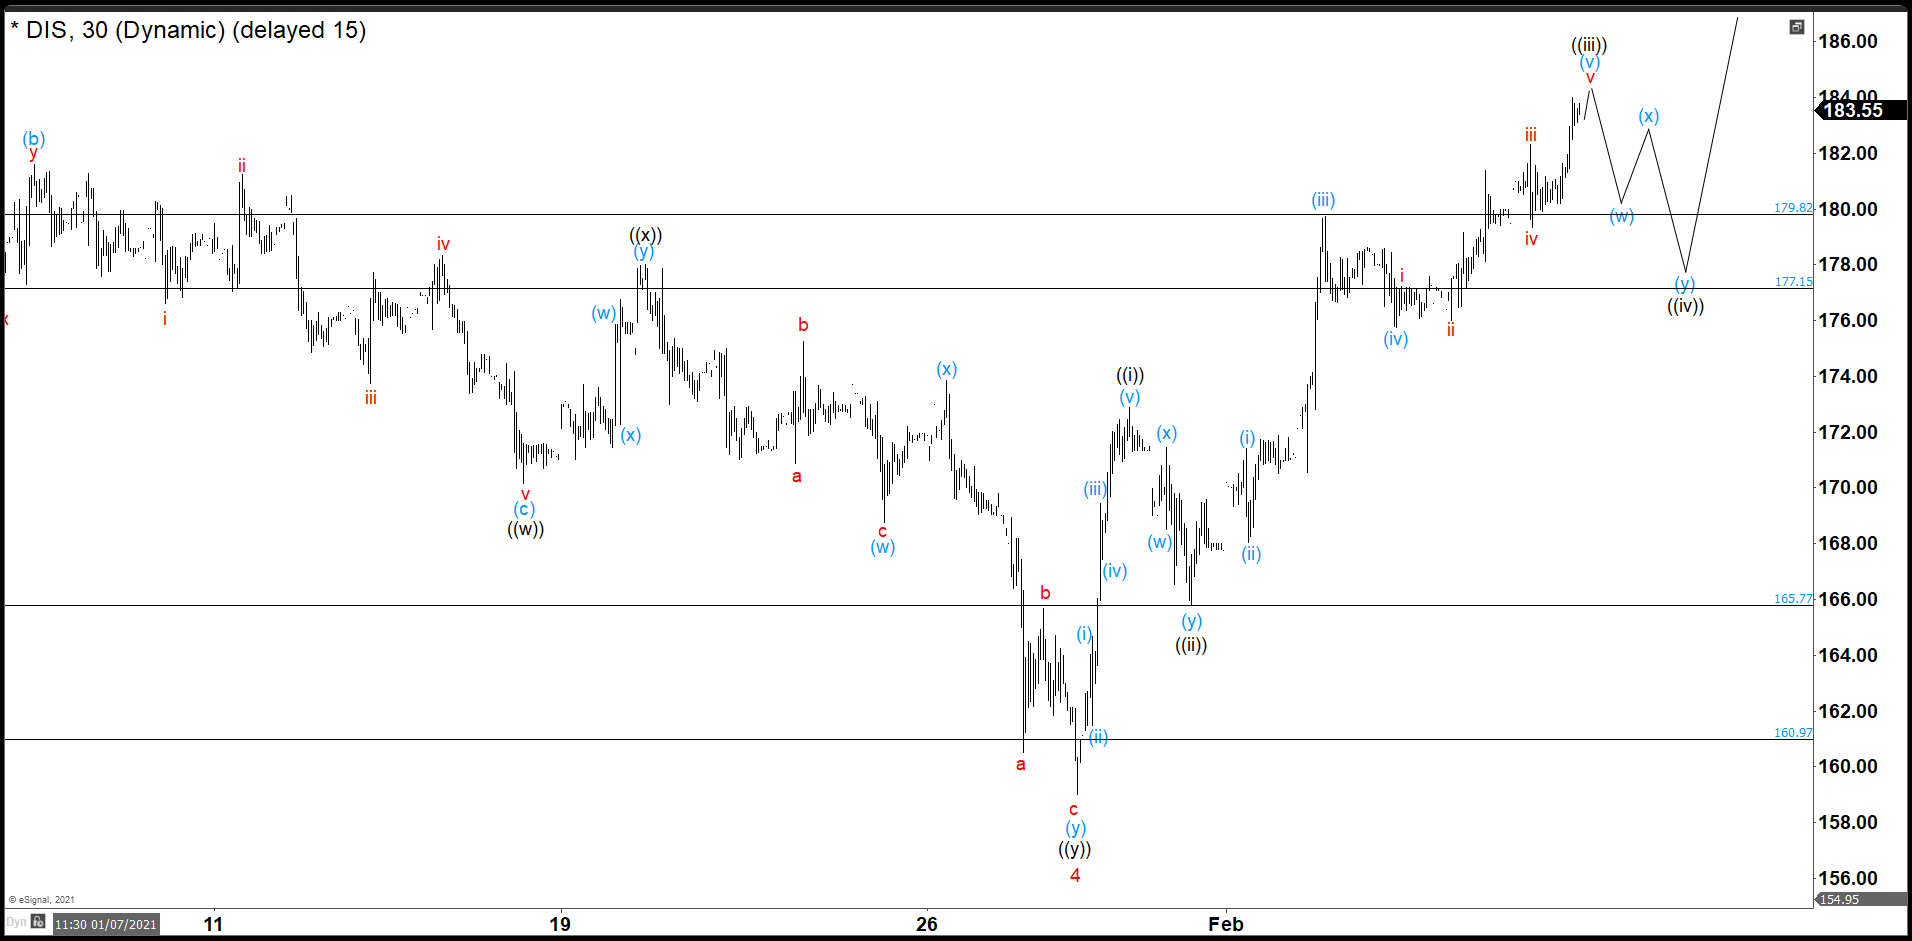
 

Elliottwave-Forecast

Master Trader
Feb 17, 2017
2,453
9
84
www.elliottwave-forecast.com
The Newmont Corporation Longer Term Bullish Cycles $NEM

Firstly from the beginning of price data from back in the 1970’s not shown on the chart, the price trend was obviously up. It ended that bullish cycle in September 1987 and pulled back really hard during the October 1987 crash. Price stabilized from there several years into the 1996 highs before another cycle lower into the October 2000 lows. That swing lower finished a correction of the cycle up from the all time lows. Those lows are still intact. The bounce that developed from the October 2000 lows into the January 2006 highs appears to have been an Elliott Wave impulse of five waves.

Secondly the three large swings from the January 2006 highs down to November 2008 lows appears to be the beginning of a large flat 3-3-5 structure. From the November 2008 lows back up to the November 2011 highs was likely a zig-zag structure by itself. The decline from the November 2011 highs down to the August 2015 lows appeared to be five waves. This completed a 3-3-5 flat structure. Of note, the lows from October 2000 remained intact again suggesting the August 2015 lows finished correcting that cycle up from there.

The analysis continues below the chart.


Thirdly in conclusion the aforementioned lows from August 2015 & now as well as the October 2018 lows should remain intact during future pullbacks for a long time to come. The bounce from those lows definitely ended the cycle lower. The bounce to the August 2016 high appeared to be five waves up. This was similar to the October 2000 to January 2006 bounce although of smaller degree. The pullback lower from the August 2016 high to the October 2018 low was obviously three swings. Price has bounced real hard from there suggesting it is within a larger degree wave three. Pullbacks should remain relatively shallow such as .236 to .382 of the October 2018 cycle. While doing that, the possibility remains that current cycle will take out the old highs from September 1987 in the not too distant future.

Source: https://elliottwave-forecast.com/st...t-corporation-longer-term-bullish-cycles-nem/
 

Elliottwave-Forecast

Master Trader
Feb 17, 2017
2,453
9
84
www.elliottwave-forecast.com
Palladium market continues to be in short supply for 9 straight years. The gap between mine supply and consumption in 2020 was around 1 million ounce of palladium. The chart below shows the deficit from 2011-2019


Palladium is used by automakers in catalytic converter manufacturing to clean greenhouse exhaust fumes. COVID-19 pandemic in 2020 further exacerbated the deficit as it caused the mining output to drop by 13%. While mining supply should rebound this year, limited new supply should still cause the deficit. The new Biden administration will also put focus on green energy technology, which may mean tighter regulation on car emissions. This could in turn increase the demand for the metal in catalytic converter in years to come.

Palladium (PA_F) 4 Hour Elliott Wave Chart​

Palladium Elliott Wave Chart

Palladium still remains in correction after forming the high on January 5, 2020 at $2536.5. Structure of the decline from there looks corrective and the internal subdivision is unfolding as a double three Elliott Wave structure. Down from January 5 high, wave ((W)) ended at $2341 with internal as another double three in lesser degree and bounce in wave ((X)) ended at $2465.5. The metal has scope to extend lower in wave ((Y)) to reach 100% - 161.8% Fibonacci extension of ((W))-((X)) towards $2127 - $2268. This area, if reached, can see buyers for 3 waves bounce reaction at least.

Source: https://elliottwave-forecast.com/commodities/supply-deficit-palladium-may-continue-support-price/
 

Elliottwave-Forecast

Master Trader
Feb 17, 2017
2,453
9
84
www.elliottwave-forecast.com
$GME (Game Stop) has been in a tremendous rally since it reached the blue box buying around the $8.20 area. The market has changed, and there is no question computers have taken over the market. We have done a series of articles explaining this idea. The market is always a fight between buyers and sellers. Knowing the areas where to enter is key. We are trading in 2021, which means computers play a role. Consequently, we present the blue boxes to members in each time frame.

It is impossible to trade within the fighting area between buyers and sellers. It's much better to trade the blue boxes. Game Stop is a clear example of a Blue Box working and how the moment the Box has been reached a reaction higher started. Please read the following article to understand how we look at the Market. We mention the blue box and Game Stop because many people are looking at fundametal reasons to explain this tremendous rally. However, what's interesting is the move happens from the blue box. The Rally is clear in Three waves, which we label in Blue, but another low was made around $60.00, which we label as a wave (IV). Wave (V) minimum target is the 123.6 - 161.8% external Fibonacci retracement of wave (IV), which comes at $182.68-$220.30. The Following chart illustrates the move

GME Monthly Elliott Wave Chart​

Gamestop (GME) Elliott Wave chart

The chart above reflect the idea explained earlier of the five waves advance since the all-time lows. The chart also shows the blue box area and the reaction from the blue box, which proves the reaction's technical aspect.

The Elliott Wave Theory is clear in what a number five means overall. A break in GME above 159.18 will mean fives or swings, and buyers are in full control. The Five waves look like the following chart:


After Gamestop reaches $182.62 - $220.30 target, it should do a big three waves pullback which will provide another great opportunity to buy. The Five waves is the more conservative view and the classic pattern in the Theory.

Another meaning of the five swing is a nest's possibility, a series of five waves into a huge acceleration. A nest in the Elliott Wave Theory is reflected in the following chart:


As we can see, a series of five waves happened, and then the extension and separation into the five waves' direction.

In a nesting scenario, GME Elliott Wave count will be different than the one presented earlier, which is ending all-time cycle and doing the biggest 3 waves pullback. The nest makes the previous wave (IV) to be a wave II and now begins wave III into a higher level and huge acceleration. The following chart shows the nesting count:

GME Monthly Elliott Wave Chart - A Nesting Scenario​


The nest is the most aggressive view. One of the two scenarios above is likely to play out, but a break above 159.18 will place the buy the dips trade in control.

Source: https://elliottwave-forecast.com/stock-market/gme-a-wave-v-might-happening-minimum-target-182-00/
 

Elliottwave-Forecast

Master Trader
Feb 17, 2017
2,453
9
84
www.elliottwave-forecast.com
As we always do at Elliottwave-Forecast, we look at the market as a whole. We track over hundreds of instrument around the world to get a more complete forecast. There is a degree of correlation among different instrument and we have developed a system to identify them. We group together correlated instrument and create different subdivisions.

Many wavers make the mistake of just forecasting a single instrument and not looking at others. The Elliott wave Theory is a great tool but the technique cannot be used only by itself. It requires further refinement. Correlation is a great tool to forecast the market and when it is used the right way, it provides an amazing value. We are going to make a point in this article about why EEM (Emergency Market) can tell wavers something very important about the state of world indices.

The Index shows five swings since the lows at 11.2008 and the idea of five waves into new highs above the peak at 10.2007 opens a bullish sequence since the all-time lows. The Bullish sequence is a warning to sellers because more upside should be happening minimum until it reaches the $72.47-$85.44 area. The extension in EEM, if seen, will support World Indices into much higher levels.

We have mentioned a few times in previous articles about the probability that a nest can happen among World Indices. We did a seminar last year in the middle of the Covid 19 selloff, and we explained the possibility of the nest. Here is the recording of the Seminar. Watch it to understand the possibility of the nest among World Indices. A nest is a sequence of five waves which happens before a huge move happens in the powerful wave 3 of (3). The following chart is an example of a nest in the Elliott Wave Theory:

A Nest Example​


From the chart above, if we look at the start of the move higher, there is a series of five waves in three different degrees before the separation takes place.

Getting back to EEM, we can see from the chart below that since the lows at 11.2008, there are five swings. The third swing however has the shortest length. Since Elliott Wave Theory stipulates wave 3 can not be the shortest wave, that means it's not a five wave from 11.2008 low. The Index then can be nesting in three different degrees and now into wave ((3)) in a second-degree nest. The idea that EEM is nesting will deny the idea that five waves from all-time lows is happening in world indices and it denies the idea we will soon see a huge decline. The Idea of nesting in EEM makes the scenario we presented in last year's seminar a real possibility, resulting in unthinkable levels across World Indices.

EEM Monthly Elliott Wave Chart​


In the chart above, the cycle from wave ((2)) low might end soon but buying the next three waves pullback is a must. We always track these types of events across the market to keep our members on the right side. Some Indices like $SPY can show five waves, as shown in the following chart:

SPY Monthly Elliott Wave Chart​


From the chart above, SPY can soon end 5 waves from all-time low and see a big pullback. However, EME is saying a nest can take place and the March 2020 drop was in fact only wave II of a second nest and now entering the powerful wave III. The following chart illustrates the next idea:

SPY Quarterly Elliottwave Chart - Nesting Structure​


The chart above shows how the nest looks at $SPY. Consequently, although there will soon be a correction to the cycle which started from March 2020 low, after the correction is complete, a huge acceleration can happen across World Indices. Without correlation, a waver may conclude that a big crash can happen in world indices. However, we have added correlation and other tools to make the Theory better.

Source: https://elliottwave-forecast.com/stock-market/eem-can-be-nesting-supporting-world-indices/
 

Elliottwave-Forecast

Master Trader
Feb 17, 2017
2,453
9
84
www.elliottwave-forecast.com
Hello fellow traders. Another instrument that we have been trading lately is Wheat ( $ZW_F) . In this technical blog we’re going to take a quick look at the Elliott Wave charts of Wheat ( $ZW_F) , published in members area of the website. As our members know, ZW_F is showing impulsive sequences in the cycle from the 469'5 low which makes Wheat bullish against the 565'6 low. We advised members to avoid selling $ZW_F and keep on buying the dips in the sequences of 3,7,or 11 swings whenever get chance. Recently the commodity made pull back that has given us nice opportunities to enter the long side. In further text we’re going to explain Elliott Wave Forecast and Trading strategy.

Wheat ( $ZW_F) 1h Hour Elliott Wave Analysis 1.24.2021​

The commodity is bullish against the 565'6 low.in first degree. We got short term ((ii)) black that has form of Elliott Wave Zig Zag pattern. The price has already reached equal legs from the peak at 639'0-616'2 ( buying zone). However we see possibility that pull back still can extend within the blue box zone. We don’t recommend selling the commodity and favor the long side from the blue box area. As the main trend is bullish, we should get 3 wave bounce at least from the Blue Box buyers zone. Invalidation level for the trade would be break below 1.6148 fib extension (616'2)

As our members know, Blue Boxes are no enemy areas , giving us 85% chance to get a bounce.

You can learn more about Elliott Wave Patterns at our Free Elliott Wave Educational Web Page.

Wheat

Wheat ( $ZW_F) 1h Hour Elliott Wave Analysis 1.25.2021​

Invalidation level 616'2 held well and we call ((ii)) pull back completed at the 624'0 low. However we would like to see further separation from the current short term low. We don’t recommend selling Wheat in any proposed pull back and favor the long side from the blue box. As the main trend is bullish, we should get 3 wave bounce at least from the Blue Box buyers zone. As soon as the bounce reaches 50 Fibs against the (b) blue peak we should make long positions risk free.

Wheat

Wheat ( $ZW_F) 1h Hour Elliott Wave Analysis 1.26.2021​

Wheat made further separation from the 616'2 low as expected. We got decent rally which has exceeded 50 fibs against the (b) blue peak. So , members who took long trades at the blue box are now enjoying profits in a risk free trades. We expect to see further rally as far as 624'0 low holds, however would like to see break above 01/15 peak to confirm next leg up is in progress.

Keep in mind market is dynamic and presented view could have changed in the mean time. You can check most recent charts in the membership area of the site. Best instruments to trade are those having incomplete bullish or bearish swings sequences.We put them in Sequence Report and best among them are shown in the Live Trading Room

Wheat

Source: https://elliottwave-forecast.com/trading/wheat-zw_f-buying-dips-blue-box-area-2/
 

Elliottwave-Forecast

Master Trader
Feb 17, 2017
2,453
9
84
www.elliottwave-forecast.com
Short Term Elliott Wave View in USDJPY suggests the rally from January 6 low is unfolding as a zigzag Elliott Wave structure. Up from January 6 low, wave A ended at 104.39 and wave B pullback ended at 103.3. The 1 hour chart below shows the wave B pullback. The internal subdivision of wave B unfolded as a double three Elliott Wave structure. Down from wave A, wave ((w)) ended at 103.49 and bounce in wave ((x)) ended at 104.198. Pair then ended wave ((y)) of B at 103.3.

The pair has turned higher in wave C. It has broken above wave A at 104.39 suggesting the next leg higher has started. Up from wave B, wave ((i)) ended at 103.937, and wave ((ii)) pullback ended at 103.52. Pair then resumes higher in wave ((iii)) as a nest. Expect pair to end wave (i) of ((iii)) soon, then it should pullback in wave (ii) to correct cycle from January 26 low before the rally resumes. As far as pivot at 103.3 low remains intact, expect dips to find support in 3, 7, or 11 swing for further upside. Potential target higher is 100% - 123.6% Fibonacci extension from January 6 low which comes at 105.1 - 106.2.

USDJPY 60 Minutes Elliott Wave Chart​

USDJPY Elliott Wave Chart

Source: https://elliottwave-forecast.com/news/elliott-wave-view-upside-usdjpy/
 

Elliottwave-Forecast

Master Trader
Feb 17, 2017
2,453
9
84
www.elliottwave-forecast.com
Since the crash of March 2020, all stocks have tried to recover what they lost and Disney was no exception. Disney did not only recover the lost, but It also reached historic highs. Now, we are going to try to build an impulse from the March 2020 lows with a target around $230. Target measured from 0 to 2019’s high projected from March’s low, equal legs.

Disney Daily Chart​

Disney Daily Chart 1

Last week we expected to complete a wave 4 in the 160.97 – 165.89 and then continue higher to complete the structure of the wave (3). On Monday the market opened strong lower and at the end of the week we believe 158.95 was the end of the wave 4.

Disney Daily Chart 2

As we see in the daily chart, the waves ((1)) and ((2)) of the impulse have completed and currently we are building the wave ((3)). We believe that wave (3) of ((3)) is still developing and we need one more high to complete an impulse 1, 2, 3, 4, 5 in red. We expect that the wave 5 in red reaches 190.88, ideally, to end the structure of wave (3) of ((3)).

Disney 30 minutes Chart​

Disney 30 min Chart 1

In this chart wave 4 of (3) finished. Disney built 3 waves to the downside ((w)), ((x)), and ((y)), as a double correction. (If you want to learn more about Elliott Wave Theory, please follow this link: Elliott Wave Theory). Last week, Disney broke the low of wave ((w)) as we expected, but did a more complex structure than an a, b, c, correction. We can see 3 waves down to complete (w) at 168.78, then the bounce to 173.87 was wave (x) and 3 more swings down to 158.95 to end the structure and wave 4.

Disney 30 min Chart 2

We rallied strong from 158.95 to 172.89 and that is the wave ((i)) of 5 for us. Besides, we have seen a double correction down to 165.77 and that should be the wave ((ii)) of 5 in red. I cannot rule out a new low to complete wave ((ii)), but right now it is better to look to the upside. Thus, in this week we should see a continuation higher trying to do a (i), (ii), (iii), (iv), (v) structure that breaks wave 3 in red high.

Source: https://elliottwave-forecast.com/stock-market/disney-completed-wave-4-looking-impulse/
 

Elliottwave-Forecast

Master Trader
Feb 17, 2017
2,453
9
84
www.elliottwave-forecast.com
In this technical blog, we are going to take a look at the past performance of Daily Elliott Wave Charts of BABA, which we presented to members. In which, the BABA completed an impulse structure from December 2018 low & made a bigger pullback. Also, the right side tag pointed higher & favored more strength. Therefore, we advised our members to buy the dips in BABA in 3, 7, or 11 swings at the blue box areas. We will explain the structure & forecast below:

BABA Daily Elliott Wave Chart From 12.20.2020​

BABA Forecasting The Bounce After Double Correction Lower

Here's the Daily Elliott wave Chart of BABA from the 12/20/2020 Weekend update. In which, the stock ended the cycle from December 2018 low in an impulse structure & made a bigger pullback. The internals of that pullback unfolded as Elliott wave double three structure where first leg lower ended in wave (W) at $252.55 low. While wave (X) bounce ended at $280.61 high and wave (Y) was expected to reach $214.11- $172.79 100%-161.8% Fibonacci extension area of (W)-(X). Before providing a buying opportunity looking for more upside or for 3 wave reaction higher at least.

BABA Daily Elliott Wave Chart From 1.24.2021​

BABA Forecasting The Bounce After Double Correction Lower

Here's another Daily Chart of BABA from the 1/24/2021 update. In which the BABA managed to reach the blue box area at $214.11- $172.79 & showing reaction higher taking place from the blue box area. Allowed members to create a risk-free position shortly after taking the longs at the blue box area. However, a break above $319.32 high still needs to be seen to confirm the next extension higher & avoid double correction lower.

Source: https://elliottwave-forecast.com/stock-market/baba-forecasting-bounce-double-correction/
 

Elliottwave-Forecast

Master Trader
Feb 17, 2017
2,453
9
84
www.elliottwave-forecast.com
Siemens SE is a German multinational conglomerate company and by revenue the largest industrial manufacturing enterprise in Europe. Company's principal business divisions are Industry, Energy, Healthcare, Infrastructure & Cities. Founded in 1847 and headquartered in Munich, Germany, the company employs approx. 385'ooo people worldwide. Siemens is a part of both DAX30 and of SX5E indices. One can note that the economic success of the company is truly accompanied by a strong performance of the Siemens stock. Currently, we see the stock price close to the all-time highs. And still, we remain bullish expecting the rally to continue.

Siemens Monthly Elliott Wave Analysis 01.31.2021​

The monthly chart below shows the Siemens stock $SIE traded at XETRA. From the all-time lows, the stock price has developed a cycle higher in black wave ((I)) of grand super cycle degree towards May 2001 highs at 89.75. From there, a correction lower in black wave ((II)) has unfolded as an Elliott wave expanded flat pattern. It has printed an important bottom on October 2008 at 32.07. From October 2008 lows, a new cycle in wave ((III)) has been already confirmed by breaking above 89.75 highs.

A closer look on the price action from 2008 lows unveals the development of another nest being blue wave (I) of black wave ((III)). The 2008 cycle has reached towards the all-time highs on May 2017 at 133.50. From there, a correction has unfolded as a zigzag structure in wave (II). The consolidation has ended in March 2020 at 58.77. While above there, Siemens should be already within wave (III) towards 133.50 highs and even higher. A target fo wave (III) will be 159.95-222.60 area and beyond.

Siemens Elliott Wave Monthly

Siemens Daily Elliott Wave Analysis 01.31.2021​

The daily chart below shows in more detail the first stages of the advance higher in wave (III). From the March 2020 lows at 58.77, we see the cycle in wave I to be currently within the black subwave ((3)). Once accomplished, the pullback in wave ((4)) is expected to find support above 98.50 lows for an extension higher in wave ((5)). Then, expect a correction in red wave II to take place before an acceleration higher in wave III of (III) should follow.

While traders can be looking to buy pullbacks against 98.50 lows for more upside, long-term traders and investors see even better opportunities. As a matter of fact, investors can be looking to buy the red wave II pullback in 3, 7, 11 swings against 58.77 lows for a rally towards 159.95-222.60 area and even higher.

Siemens Elliott Wave Daily

Source: https://elliottwave-forecast.com/stock-market/siemens-stock-continue-rally/
 

Elliottwave-Forecast

Master Trader
Feb 17, 2017
2,453
9
84
www.elliottwave-forecast.com
Hello fellow traders. As our members know Soybean Futures ($ZS_F) has been giving us nice trading setups recently. ( refer to blogs : $ZS_F 1.4 and $ZS_F 1.11) In this blog, we’re going to take a quick look again at the Elliott Wave charts of Soybeans ZS_F and explain trading strategy we have had recently . Soybeans Futures is showing impulsive sequences in the cycle from the April 808’0 low. We’ve been calling rally in the commodity and recommending members to keep buying the dips in 3,7,11 swings whenever chances occur .

Soybeans ZS_F 1h Hour Elliott Wave Analysis 1.22.2021​

The commodity is doing wave 4 red pull back. Correction is unfolding as Elliott Wave Double Three Pattern. Correction is showing incomplete sequences at the moment, suggesting another leg down potentially toward 1302'3 -1250'2 ( buying zone). We don’t like selling in any proposed leg down and favor the long side from the blue box area as far as the price stays above 1.618 fib ext 1250'2. As soon as the bounce reach 50 Fibs against the middle pivot ((x)) black we will make long positions risk free( put SL at BE)

As our members know, Blue Boxes are no enemy areas , giving us 85% chance to get a bounce. You can learn more about Elliott Wave Patterns at our Free Elliott Wave Educational Web Page.

Soybeans

Soybeans ZS_F 1h Hour Elliott Wave Analysis 1.25.2021​

Soybeans Futures made proposed extension down and reached buyers zone at 1302'3 -1250'2. At this moment we can count clear 7 swings down from the peak, when pull back 4 red ended at 1298'2 low as Elliott Wave Double Three Pattern. The commodity found buyers at blue box area as we were expecting . The bounce is close to reach 50 fibs against the ((x)) high, when we should make long positions risk free. As far as the price stays above latest 1298'2 low, we expect further rally.

Soybeans

Soybeans ZS_F 1h Hour Elliott Wave Analysis 1.28.2021​

1298'2 low held nicely and we got separation higher as expected. Short term cycle from the mentioned low ended as 5 waves rally ((i)) . Now Futures is doing ((ii)) pull back that can see approximately 50-61.8 fibs zone : 1346'2-1335'2. At that area we expect pull back to complete and buyers to appear for further rally ideally.

Keep in mind that market is dynamic and presented view could have changed in the mean time. Best instruments to trade are those having incomplete bullish or bearish swings sequences. We put them in Sequence Report and best among them are shown in the Live Trading Room. You can check most recent charts in the membership area of the site.

Soybeans

Source: https://elliottwave-forecast.com/trading/another-trading-soybeans-futures/
 

Elliottwave-Forecast

Master Trader
Feb 17, 2017
2,453
9
84
www.elliottwave-forecast.com
Gold-to-Silver Ratio is simply gold price divided by silver price. After spiking to all-time high at 126.4 on March last year to 126.4 due to the fear of Covid-19 pandemic, it has turned lower considerably. The average ratio in 300 years history is around 30 as the chart below shows:


The natural ratio in the earth's crust, according to some mining producers, is around 8 to 1. That means every 1 ounce of Gold mined, there is 8 ounces of silver. If one just simply uses the average ratio of 30 to 1 and apply to the current price gold, that suggests the price of silver should be $1820 (per February 4, 2021) / 30 = $60. Yet, the price of silver today is only $26 which suggests the metal is undervalued.

This week, due to the rumor of the Reddit community trying to target Silver, the metal has spiked 10% over the weekend and take out last year's high of $29.8. It has since completely reversed the spike, but nonetheless the break above last year's high carries significant technical implication. Gold-to-Silver ratio has also broken lower creating a bearish sequence since last year as the chart below shows

Gold-to-Silver (GSR) Ratio Elliott Wave Chart​

Gold-to-Silver ratio

The chart above suggests the decline from 3.18.2020 high is unfolding as an impulsive 5 waves and ended wave a at 68.90 on September 2020. The ratio since then has been consolidating and ended wave b at 85.14. It has broken below wave a again this week suggesting the next leg lower has started. This ratio is inversely correlated with the underlying physical gold and silver. In other words, when the ratio breaks lower, the price of Gold and Silver will trend higher with Silver outperforming Gold.

Silver (XAGUSD) Elliott Wave Chart​


After bottoming on March 18, 2020 low during the Covid-19 selloff, Silver rallied impulsively from $11.64 to $29.86 in a matter of just 5 months. That rally ended wave I or A. It then corrected 27% in just a little over 1 month ended wave 2/B at $21.6. With this week's price action, Silver manages to take out wave I/A and creates a bullish sequence. Furthermore, the rally from wave 2/B low is in 5 waves (diagonal), suggesting further upside is likely while pullback stays above there. Alternatively, Silver can do an expanded flat in which 9.25.2020 low is wave ((A)) and the marginal high is wave ((B)), and now can see wave ((C)) of II/B lower which can potentially break below 21.66 before the metal rallies higher again. This view however is not our primary view as we don't forecast a flat against a clear trend.

Source: https://elliottwave-forecast.com/commodities/silver-outperform-break-lower-gold-silver-ratio/
 

Elliottwave-Forecast

Master Trader
Feb 17, 2017
2,453
9
84
www.elliottwave-forecast.com
GameStop is a video game chain stores and merchandising that has made headlines for a few days due to a dramatic rise experienced by its shares on the stock exchange.

The company lost business over the years. Players prefer to buy the games on internet or play online, and consequently the value of the shares dropped. But the price of stocks also fell for another reason: some high investment funds bet that the value of GameStop's shares would fall.

Following the rise of GameStop shares are private investors grouped into Reddit's WallStreetBets forum, where users share memes, gifs and also, in some cases, investment tips. They realized that large investors were conducting short trades against GameStop and decided to take advantage of it to buy shares in the company. By investing in these stocks, the price started to rise very quickly.

In the end, GameStop's share price soared: at the beginning of the year, its shares cost $17, while on Thursday, January 28, 2021, they reached $500. Investment funds that opted down by GameStop have accumulated large losses and, in some cases, have been forced to sell shares of other companies to cover them.

Forecasting GameStop using Elliott Wave t Elliott's Wave Theory

GameStop 15 min Chart

The rally above $500 completed a Grand Super Cycle as wave ((a)) in a 5-wave structure. Wave (I) was the peak of 2007, wave (II) was the low of 2019, waves (III) and (IV) were on January 27, and wave (V), on 28, completing the cycle. Then we have a clear 3-3-5 corrective flat structure, waves (a), (b) and (c), where (c) must end as an impulse. (If you want to learn more about Elliott Wave Theory, please follow this link: Elliott Wave Theory). We are currently building the last wave V of (c), which could continue to slowly decline towards the value of 10.72 where it should bounce or the GameStop company files for bankruptcy. Another alternative for wave V is to take the structure of an ending diagonal, for this option the price of the stock must remain below $ 121.94.

Source: https://elliottwave-forecast.com/stock-market/gamestop-shares-elliotts-wave-theory/
 

Elliottwave-Forecast

Master Trader
Feb 17, 2017
2,453
9
84
www.elliottwave-forecast.com
With Bitcoin recently breaking out to new all time highs the Crypto and Blockchain market has reached fever pitch. NXT -ID isn't your typical crypto stock, but it is in the related field of blockchain. Lets take a look at what the company does:

“NXT-ID is a manufacturer and distributor of non-monitored and monitored personal emergency response systems. NXT -ID has extensive experience in access control, biometric and behavior-metric identity verification, security and privacy, encryption and data protection, payments, miniaturization and sensor technologies.

Fit Pay, Inc., a wholly owned subsidiary of NXT-ID, Inc. (NASDAQ: NXTD) and Cascade Financial Technology Corp (Cascade FinTech) are in joint development of a platform that gives cryptocurrency holders the ability to use the value of their currency to make purchases at millions of retail locations worldwide. The new platform will enable devices with stored value exchanged from cryptocurrency to be used for traditional payment transactions."


Lets dig into the charts!

NXT -ID Elliottwave Daily View

NXT -ID


Medium term term view from the all time low in March 2020 set @ 0.22. NXT -ID went sideways to up for an extended amount of time in a wave ((1)). After that, corrected for 3 months into ((2)). From there, a very sharp wave ((3)) took place which peaked at 2.12 on December 17 2020. After that, it has been sideways to down in a choppy double zig zag corrective pattern. It is common for instruments to go sideways for extended time after sharp wave 3 advances. It is possible that ((4)) has found a low where (W) is set and wave ((5)) has already begun. Moreover, there is no divergence in momentum in daily RSI. One more high with divergence is favoured to set Red I before correcting in Red II.

In Conclusion, ((4)) may still be in progress, but depending on Bitcoin, further weakness may take place before moving higher. Regardless we do not like to trade the sideways zones but like to trade extreme areas.

Risk Management​

Using proper risk management is absolutely essential when trading or investing in a volatile stocks. Elliott Wave counts can evolve quickly, be sure to have your stops in and define your risk when trading.

Source: https://elliottwave-forecast.com/stock-market/nxt-id-nxtd-close-moving-higher/
 

Elliottwave-Forecast

Master Trader
Feb 17, 2017
2,453
9
84
www.elliottwave-forecast.com
Credit Suisse is a global wealth manager, invetsment bank and financial services provider. It is one of the nine bulge bracket banks. Founded 1856 and headquartered in Zurich, it can be traded under tickers $CSGN at Six Swiss Exchange and $CS at New York Exchange. After printing the all-time highs in August 2000 at 89.38, the stock price has lost more than 90% by March 2020. Currently, we see Credit Suisse turning higher.

Credit Suisse Monthly Elliott Wave Analysis 02.07.2021​

The monthly chart below shows the Credit Suisse stock $CSGN traded at Six Swiss. From the lows, the stock price has developed a cycle higher in wave ((I)) of a grand super cycle degree. Credit Suisse has printed the all-time highs in August 2000 at 89.38. From there, a correction lower in wave ((II)) has started with a first leg unfolding as a leading diagonal. The 5 subwaves of blue wave (a) lower have ended in October 2002 at 17.72. From the Elliott Wave theory one knows that five waves form an incomplete pattern. Hence, after a bounce, at least another leg lower should take place. Indeed, we saw a bounce in 3 waves of blue wave (b) failing below the all-time highs. Thereafter, a decline in wave (c) was expected to reach towards the equal legs extension area being 16.22-0.00 range.

As a matter of fact, the 16.22-0.00 target area has been reached by July 2012. Nothwithstanding, the stock was not ready to turn higher. Wave (c) of a zigzag pattern has taken the form of an ending diagonal which is an Elliott Wave 3-3-3-3-3 structure. Hence, Credit Suisse may end correction and start a new cycle upwards only once the pattern is accomplished. We call the pattern completed in March 2020 at 6.18. From there, the stock price should be in first stages of a new cycle in black wave ((III)). While above 6.18, Credit Suisse should extend towards the new all-time highs targeting the 95.66-150.98 area and even higher.

Credit Suisse Elliott Wave Monthly

Credit Suisse Daily Elliott Wave Analysis 02.07.2021​

The daily chart below shows the advance higher in black wave ((1)) of red wave I from the March 2020 lows. Within it, subwaves (1)-(4) have ended. Currently, wave (5) is in progress. Once over, a correction within wave ((2)) should take place. It is expected to find support in 3, 7, 11 swings above 6.18 lows. Investors and traders can be looking to buy the wave ((2)) pullback for a rally in wave ((3)).

Credit Suisse Elliott Wave Daily

Source: https://elliottwave-forecast.com/stock-market/credit-suisse-turning-higher/
 

Elliottwave-Forecast

Master Trader
Feb 17, 2017
2,453
9
84
www.elliottwave-forecast.com
Since the crash of March 2020, all stocks have tried to recover what they lost and Disney was no exception. Disney did not only recover the lost, but It also reached historic highs. Now, we are going to try to build an impulse from the March 2020 lows with a target around $230. Target measured from 0 to 2019’s high projected from March’s low, equal legs.

Disney Daily Chart Disney Daily Chart 1

As we see in the daily chart, the waves ((1)) and ((2)) of the impulse have completed and currently we are building the wave ((3)). We believe that wave (3) of ((3)) is still developing and we need one more high to complete an impulse 1, 2, 3, 4, 5 in red. We expect that the wave 5 in red reaches 190.88, ideally, to end the structure of wave (3) of ((3)).

Last week we expected to continue higher as an impulse to complete the structure of the wave (3). On Monday the market dubiously opened, but as the days passed, it began to gain upward strength and it almost reaches to break to a new historical high.

Disney 30 minutes Chart​

Disney 30 min Chart 1

In this chart wave 4 of (3) finished. Disney built 3 waves to the downside ((w)), ((x)), and ((y)), as a double correction. (If you want to learn more about Elliott Wave Theory, please follow this link: Elliott Wave Theory). Last week, Disney broke the high of wave ((i)) as we expected and continue the rally as an impulse structure. The waves (i) and (ii) of ((iii)) were pretty small. Then the stock started to move upside and it made a temporary peak at 179.74 that we labelled as wave (iii) of ((iii)). Then we saw 3 swings down that is wave (iv) and currently we are in wave (v) of ((iii)).

Thus, in this week we should see a slightly high to complete an extended wave (v) and also complete wave ((iii)). Then we expect a double correction (w), (x), (y) to build wave ((iv)) and bounce from the 177.15 – 179.82 area. This rally should continue to 190.88 target and finish the wave ((v)) and also end the wave 5 in red and wave (3) in the daily chart.

Source: https://elliottwave-forecast.com/stock-market/disney-rally-almost-historical-high/
 

Elliottwave-Forecast

Master Trader
Feb 17, 2017
2,453
9
84
www.elliottwave-forecast.com
Bovespa Brazil Index Long Term Cycles and Bullish Trend

The Bovespa Index has been trending higher with other world indices. Since inception the cycles have shown a bullish trend. In early years not seen on this chart it rallied with other world indices trending higher into the May 2008 highs. It then corrected the whole bullish cycle from the beginning. That was while most other world indices were in a pullback lower. The index ended that larger degree correction in October 2008. At this point is where the index corrected the whole decades long bullish cycle. Thus the October 2008 lows is from where this bullish cycle and swing analysis will begin.

First from the October 2008 lows the index rose into the November 2010 highs in what appears as an impulse. From there the index endured an almost 6 year long correction of that cycle into the January 2016 lows.

The analysis continues below the chart.


Secondly I want mention the blue box area that was reached in the cycle up into the January 2020 highs. This is Fibonacci extension measured from zero up to the May 2008 highs then back down to the October 2008 lows. This is a typical place for the next cycle higher in any degree to reach as it did in January 2020.

Thirdly and in conclusion. The pullback into the March 2020 lows was enough to suggest it was correcting the cycle from the 2008 lows. This was shared by other world indices and many others have already made new yearly highs in their bullish cycles. This one was no different and eventually did get back above the January 2020 highs. From the March 2020 lows the index appears to be an impulse when looked at in the lower time frames. The index should ideally see another couple of highs in the 140000 before it corrects the cycle up from the March 2020 lows. This is pretty much in line with other correlated world indices. There should be a future bullish outcome in the index while above the March 2020 lows.

Source: https://elliottwave-forecast.com/st...zil-index-long-term-cycles-and-bullish-trend/
 

Elliottwave-Forecast

Master Trader
Feb 17, 2017
2,453
9
84
www.elliottwave-forecast.com
MOEX Russian Index Long Term Cycles and Bullish Trend

The MOEX Russian index has trended higher with other world indices since inception. The index remained in a long term bullish trend cycle into the December 2007 highs. It made a sharp correction lower in 2008 that lasted until October 2008 similar to other world indices. That is where the index corrected the whole decades long bullish cycle.

Firstly from the October 2008 lows the index rose into the April 2011 highs. Then the index saw an almost 3 year long correction of that cycle into the March 2014 lows. That pullback corrected the whole cycle up from the 2008 lows. From there to the January 2020 highs reached the blue box highlighted Fibonacci extension area. This is a typical area where the second cycle with the tread reaches. This area was defined by measuring a Fibonacci extension from the beginning level zero up to the December 2007 high down to the October 2008 low.

The analysis continues below the chart.

Monthly Chart


Secondly I would like to mention this overall price movement in the bullish cycles leaves the index in a couple of different scenarios. One way to view it from an Elliott wave perspective is the January 2020 highs was the end of a larger degree third wave. I do not prefer this because it suggests after a few more new highs back above the January 2020 highs the index will suffer a huge correction bigger than ever seen before.

Thirdly in conclusion. The positive progression of mankind is reflected in equity indices. I do believe in the technical indicators that suggests I saw enough pain in the dips into the 2008 as well as the March 2020 lows that should eventually prove to be longer term cycle lows. I think the index has a longer term series of nested wave ones and twos. As suggested on the chart I think the cycle from the March 2020 lows should continue higher in the near term before a pullback corrects that cycle. I expect the index will remain above there for a long time progressing higher.

Source: https://elliottwave-forecast.com/stock-market/moex-russian-index-long-term-cycles-and-bullish-trend/
 

Elliottwave-Forecast

Master Trader
Feb 17, 2017
2,453
9
84
www.elliottwave-forecast.com
Hello fellow traders. OIL Futures ( $CL_F ) is another instrument that has given us nice trading opportunity lately . As our members know the commodity is showing bullish sequence. We recommended members to avoid selling the commodity and keep on buying the dips in 3,7,11 sequences when get chance. In this technical blog we’re going to take a quick look at the charts of OIL published in members area of the website and explain the Elliott Wave structure and trading strategy.

OIL Elliott Wave 4 Hour Chart 1.22.2021​

OIL remains bullish against the 47.31 low in first degree. Cycle from that low ended as 5 waves and now we are getting correction. At this stage pull back looks incomplete. The price structure suggests another leg down is possible toward 51.7-50.36 ( buyers zone) As the main trend is bullish we expect to see at least 3 waves bounce from the marked zone. Once the price reaches 50 fibs against the ((b)) black high , we should make long positions risk free. As our members know Blue Boxes are no enemy areas , giving us 85% chance to get a reaction.

You can learn more about Elliott Wave Patterns at our Free Elliott Wave Educational Web Page.

OIL

OIL Elliott Wave 1 Hour Chart 1.25.2021​

Eventually OIL made another leg down toward blue box area ( 51.7-50.36 area ) and found buyers as we expected. The commodity has given us nice bounce from the buying zone. At this moment the price has already reached 50 fibs against the ((b)) black high. Members who bought OIL at the blue box area now enjoying profits in a risk free trades. Now, we expect to see further separation up from the 51.44 low . We would need to see break of 01/13 peak to confirm next leg up is in progress.

OIL

OIL Elliott Wave 1 Hour Chart 1.25.2021​

As we can see on the chart below 51.44 low held nicely during short term pull backs. OIL made further separation higher and eventually broke above 01/13 peak. Right side remains the long side. We don't recommend selling it in any proposed pullback.

Note: Some labels have been removed in order to protect clients privileges. Keep in mind market is dynamic and presented view could have changed in the mean time. You can check most recent charts in the membership area of the site. Best instruments to trade are those having incomplete bullish or bearish swings sequences.We put them in Sequence Report and best among them are shown in the Live Trading Room.

OIL

Elliott Wave Forecast
Source: https://elliottwave-forecast.com/trading/oil-cl_f-buying-dips-blue-box-zone/
 

Elliottwave-Forecast

Master Trader
Feb 17, 2017
2,453
9
84
www.elliottwave-forecast.com
What do you get when you combine a Chinese based online game operator, with Bitcoin mining? You get a powerful trending stock called The9! This stock is currently on a high momentum run. Before we move further, lets take a look at the company profile:

“The9 Ltd. is a Shanghai-based online game operator which had the exclusive licence to operate and distribute World of Warcraft in China (launched in June 2005, it has since become the largest online game), a licence it secured after successfully aiding Webzen Games with the distribution of Mu Online in China. However, in April 2009, Blizzard said that the licence has been moved to NetEase.com.

Recently, the company has announced the purchase of Bitcoin Mining machines, entering into the Crypto space. After taking delivery of all machines purchased, it will have a total of 800PH/S mining power ”


The chart is acting fairly clean, lets dig in!

The9 Elliottwave View:

the9

Since there isn't really a lot of data to work with this is just a medium term term view from the low set at 2.02 in October 2020. NCTY was in a sideways consolidation before surging to a wave ((1)) peak set at 27.82 on Jan 7, 2021. After that, a sharp decline resulted in a 70% decline from the peak, which formed the wave ((2)) low. From that wave ((2)), the instrument began to form a series of nests. After the nests were set a very impulsive rally followed. Presently, it is favoured that red 3 has peaked in the extreme area for a pullback in red 4.

There are many more swings to complete the sequence to the upside but the extreme area is where buyers and sellers may start to fight. This can cause pries to be a little choppy. With this said, the 161.8 extension area at 49.75 could be an area where ((3)) peaks for a correction in ((4)). The9 is following Bitcoin fairly accurately, so keep an eye on the Bitcoin also for clues as to where this instrument may be headed.

Risk Management​

Using proper risk management is absolutely essential when trading or investing in a volatile stocks. Elliott Wave counts can evolve quickly, be sure to have your stops in and define your risk when trading.

Source: https://elliottwave-forecast.com/stock-market/the9-ncty-charging-higher/