Elliottwave-Forecast

Master Trader
Feb 17, 2017
2,453
9
84
www.elliottwave-forecast.com
In this technical blog, we will look at the past performance of 1 hour Elliott Wave Charts of General electric ticker symbol: GE, which we presented to members at the elliottwave-forecast. In which, the rally from 27 January 2021 low unfolded as an impulse structure. And showed a higher high sequence favored more upside extension to take place. Therefore, we advised members not to sell the stock & buy the dips in 3, 7, or 11 swings at the blue box areas. We will explain the structure & forecast below:

GE 1 Hour Elliott Wave Chart​

GE Elliott Wave Forecasting Buyers At The Blue Box Area

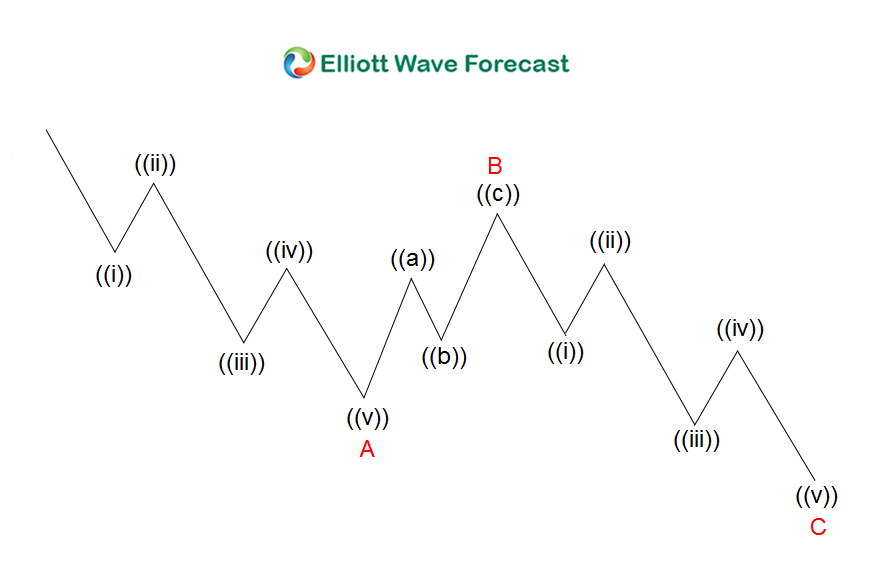
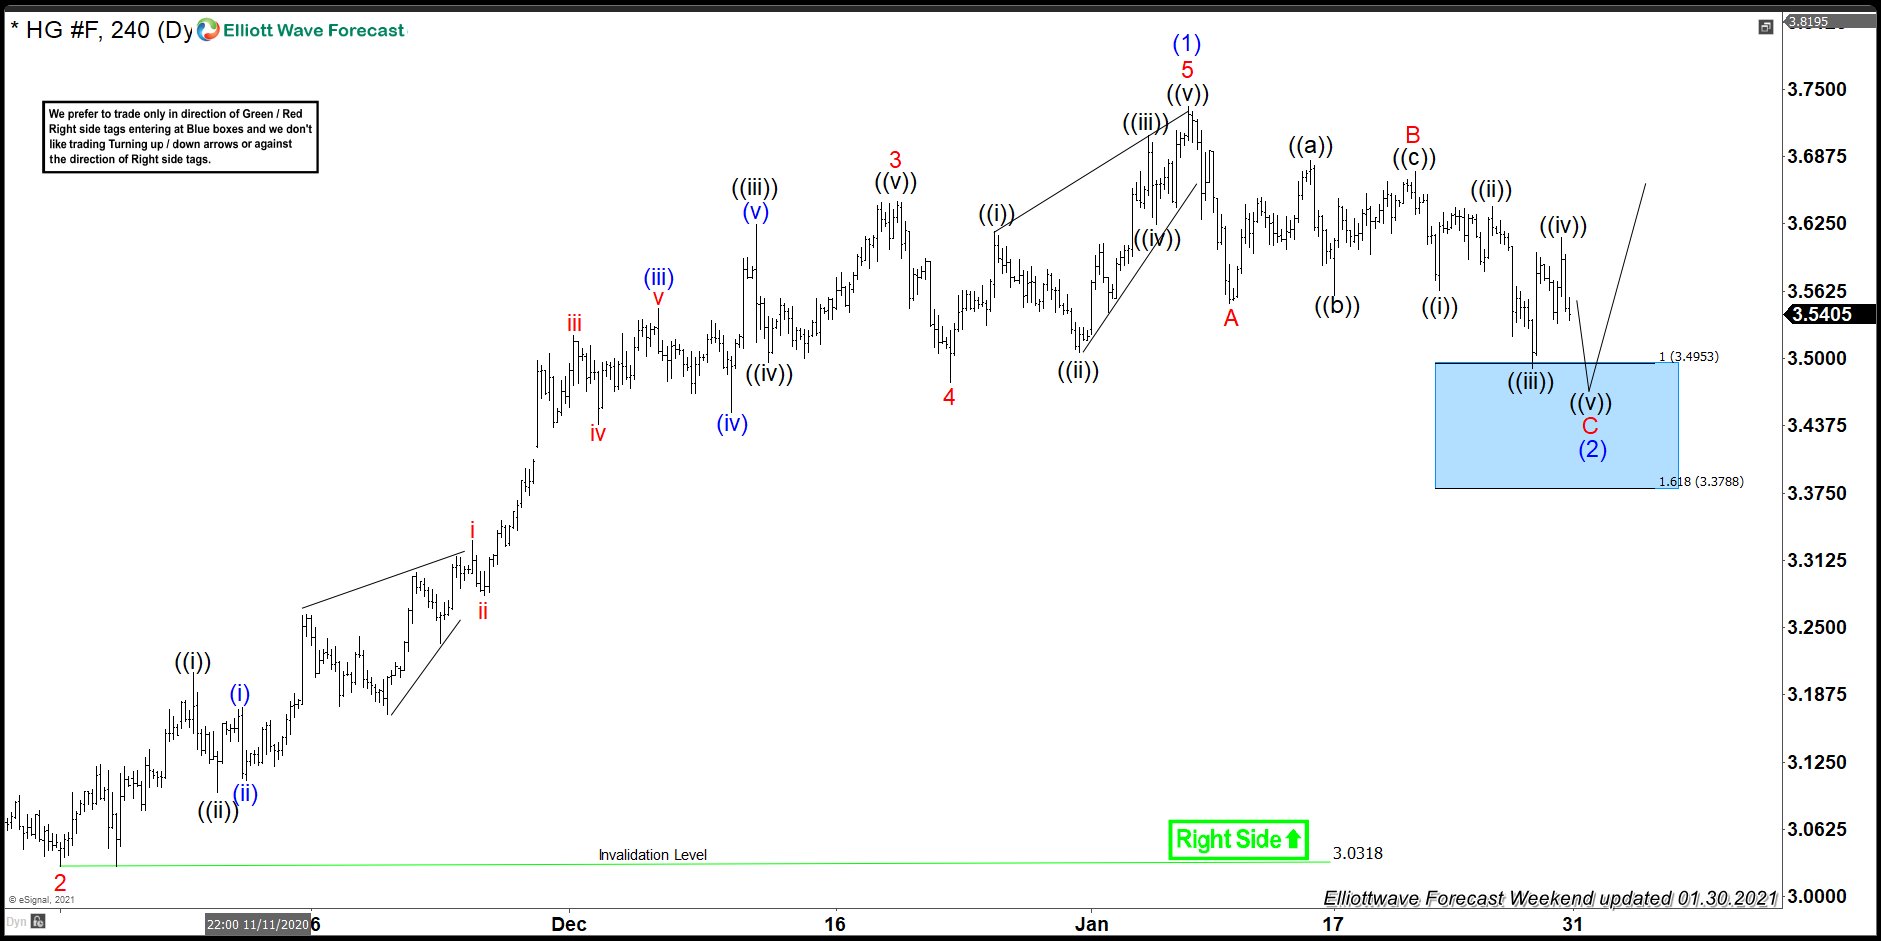
Above is the 1 hour Elliott Wave Chart of GE from the 2/26/2021 Pre-Market update. In which, the stock is showing a higher high sequence from 1/27/2021 low cycle favoring more upside. While the rally from that low unfolded as an impulse structure where wave (1) ended at $11.98 high. Down from there, wave (2) pullback unfolded as a zigzag structure where wave A ended at $11.78 low. Wave B bounce ended at $11.86 high and wave C ended at $11.51 low.

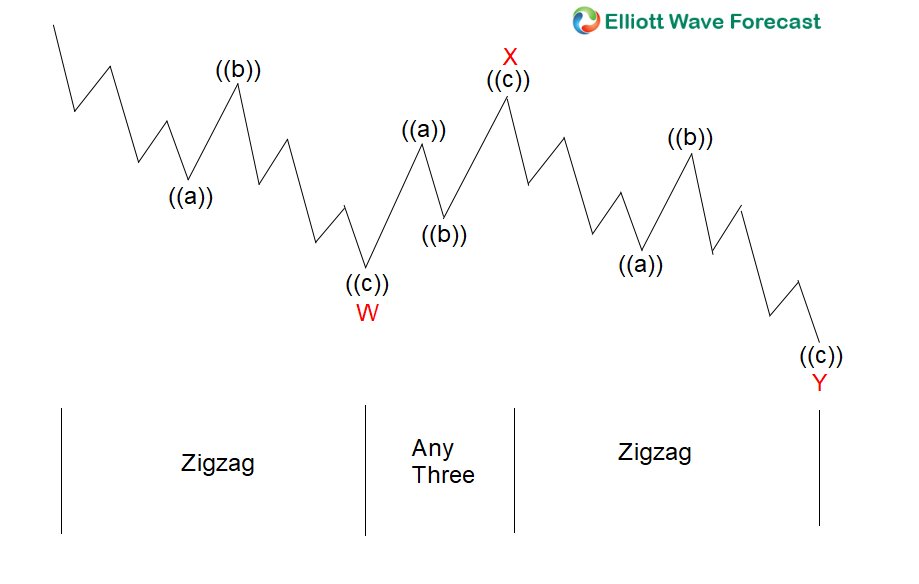
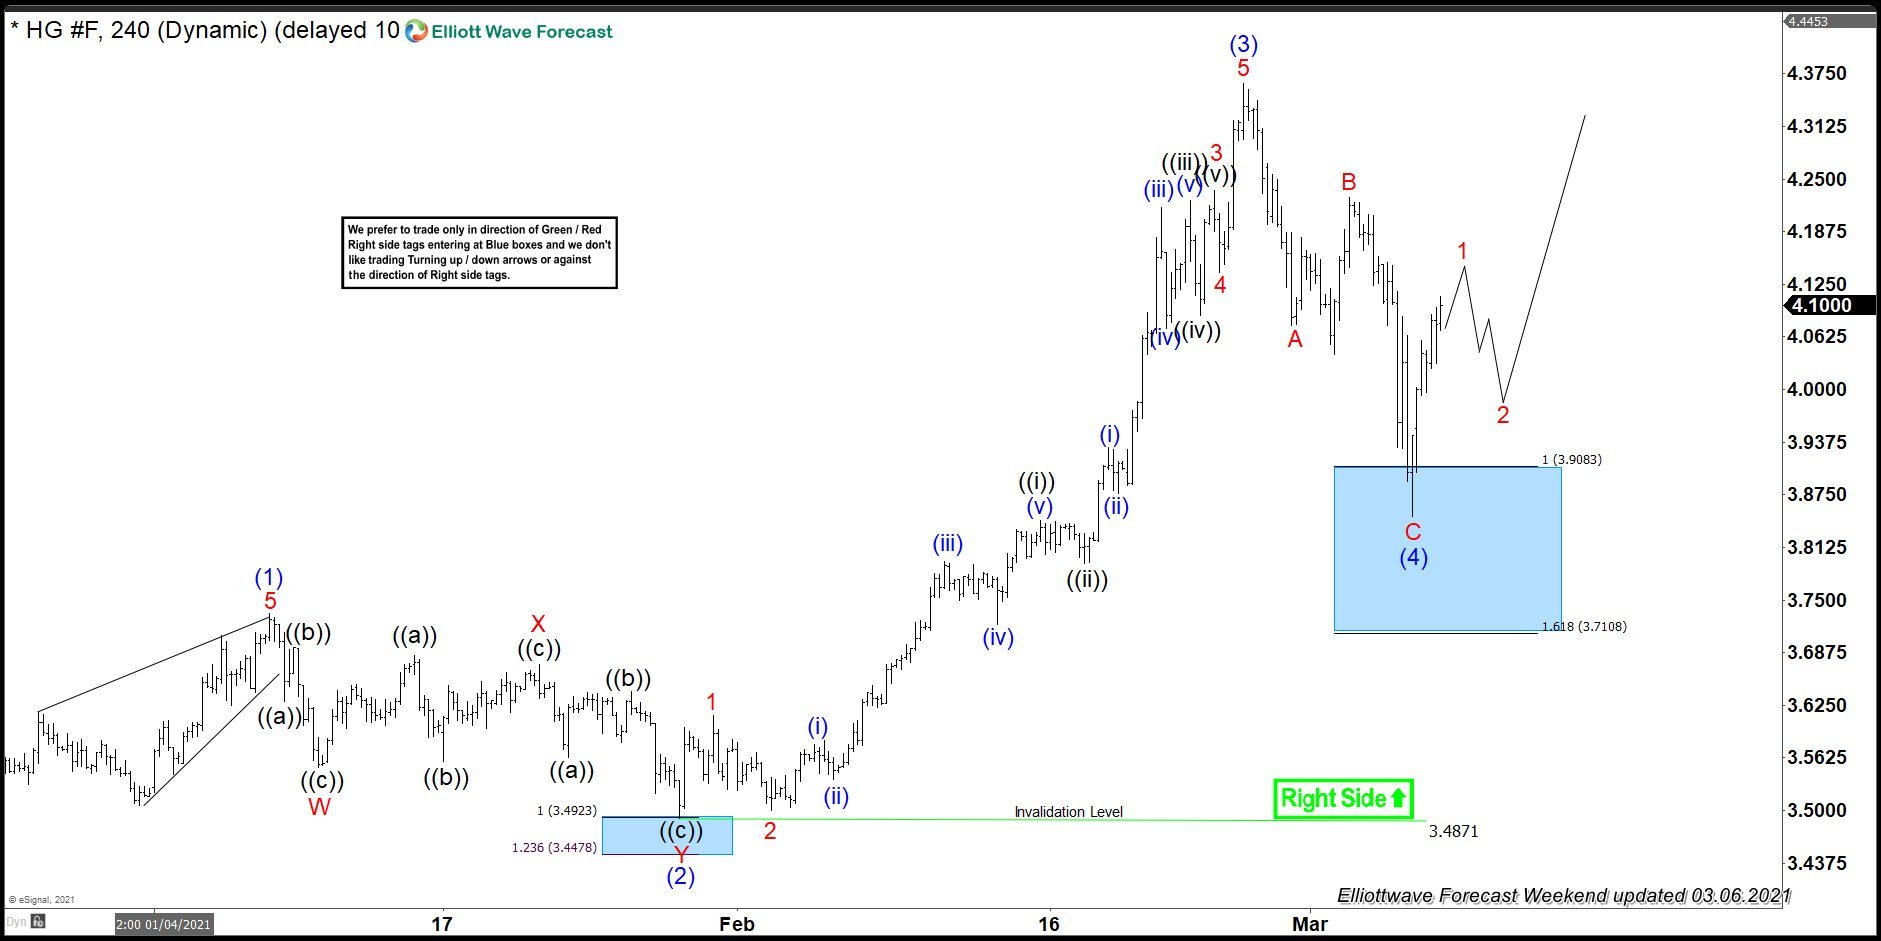
Up from there, the stock rallied in another 5 waves & completed wave 1 of (3) at $13.35 high and made a pullback in wave 2. The internals of that pullback unfolded as a zigzag structure where wave ((a)) ended at $12.66 low. Wave ((b)) bounce ended at $13.12 high and wave ((c)) was expected to reach the $12.43- $12.01 100%-161.8% Fibonacci extension area of ((a))-((b)). From there, buyers were expected to appear looking for further upside.

GE 1 Hour Elliott Wave Chart​

GE Elliott Wave Forecasting Buyers At The Blue Box Area

Here’s the 1 Hour Elliott Wave Chart of GE from the 3/03/2021 Midday update. The stock is showing a strong reaction higher taking place from the blue box area after ending the zigzag correction at $12.41 low. And breaking to new highs as expected. Allowed members to create a risk-free position shortly after taking the long positions at the blue box area.

Source: https://elliottwave-forecast.com/stock-market/ge-forecasting-buyers-blue-box-area/
 

Elliottwave-Forecast

Master Trader
Feb 17, 2017
2,453
9
84
www.elliottwave-forecast.com

More correction expected in the DXY as sellers continue to dominate​

The DXY or the dollar index has been in a steady decline from the 102.97 levels. These levels were seen in March 2020. And since then, we have seen lower highs and lower lows to date. The recent low was set at 89.692 on 2/25/2021 as shown as (X) in the recent 1 hourly chart below. The series of lows appears to have been in impluse waves, and indeed the subdivisions would have also been just as impulsive. The right side is downside, therefore we prefer short positions.

Up from the January 6th lows, the index rallied in three waves and completed wave (W) in blue. We saw a decline in three more waves follow, as expected of a correction. This decline ended on February 25, at 89.682. Blue wave (W) and wave (X) both unfolded as double three corrections. Sometimes, these type of corretions can unfold as triple three corrections.


DXY 1 hour Elliott Wave ChartIn the 1 hourly chart above, we regard the recent March 02 peak to have completed a minor degree A of wave (Y) of wave ((4)) . Internally, we saw subdivisions of five waves in red A - that is, ((i)) to ((v)) in black. We saw a three wave down in red wave B, correcting Red wave A. Up from the red wave B low, one can expect the upside rally to continue towards C, and thus (Y) and ((4)). If wave C does not unfold as an impulse, it may become an ending diagonal .One can expect wave ((4)) to terminate in the 92.097 and 93.595 area before sell-off resumes. Thereafter, we shall expect to see the beginning of a decline in wave ((5)).

Source: https://elliottwave-forecast.com/forex/dxy-further-drop-soon/
 

Elliottwave-Forecast

Master Trader
Feb 17, 2017
2,453
9
84
www.elliottwave-forecast.com
Bitcoin miners have had a great 2021 but can it continue? Bitfarms is one of the worlds largest public bitcoin miners and has an incomplete bullish sequence, lets take a look at the company profile:

“Founded in 2017 Bitfarms is one of the one of the largest public bitcoin mining operations in the world. Bitfarms run verticall mining operations with onsite technical repair, data analytics and engineers to deliver high performance and uptime of operations. $BITF is currently listed as a Rising Star by the TSX-V.

Bitfarms has a diversified production platform with five industrial scale facilities located in Quebec. Each facility is 100% powered with environmentally friendly hydro power and secured with long-term power contracts. Bitfarms is currently the only publicly traded pure-play mining company audited by a Big Four audit firm.”

Lets take a look at the Elliottwave View:

Bitfarms Elliottwave View:

bitfarms

Medium term term view from the all time low in October 2020. Bitfarms appears to have 5 swings into the peak into Red I. From there, a wave 3 advance (Red III) has taken shape. This wave has recently peaked at $8.50 and has since pulled back. Is that all this stock has for this cycle? According to the data we have, the stock appears to have an incomplete bullish sequence. What does this mean? At least one more high is needed to satisfy an impulsive swing higher before a larger pullack. We do not favour to sell this instrument, but like to look for opportunity where buyers may enter at the extreme areas.

In Conclusion, with the data that is present, this stock is favouring further extension higher in at least one more high before correcting in a larger degree. But at this point, it is important to observe good risk management as the 5th wave can take on many shapes and forms.

Risk Management​

Using proper risk management is absolutely essential when trading or investing in a volatile stocks. Elliott Wave counts can evolve quickly, be sure to have your stops in and define your risk when trading.

Source: https://elliottwave-forecast.com/stock-market/bitfarms-bfarf-bitf-ca-looking-higher/
 

Elliottwave-Forecast

Master Trader
Feb 17, 2017
2,453
9
84
www.elliottwave-forecast.com
Bitcoin hardware makers are like the picks and shovels of the gold rush in California. Ebang is a shovel maker, in the new Bitcoin era. Ebang has had a nice run so far but is there more in store? lets take alook at the company profile.

“Ebang International Holdings Inc. is a blockchain technology company with strong application-specific integrated circuit (ASIC) chip design capability. With years of industry experience and expertise in ASIC chip design, it has become a leading bitcoin mining machine producer in the global market with steady access to wafer foundry capacity. With its licensed or registered entities in various jurisdictions, the Company seeks to launch a professional, convenient and innovative digital asset financial service platform to expand into the upstream and the downstream of blockchain and cryptocurrency industry value chain.”

As you can see on the chart below, there has been quite a large pullback from the recent peak. Lets take a look at the Elliottwave View.

Ebang Elliott Wave View:

Ebang

Medium term term view from the all time low in July 2020. Ebang has had a fairly volatile 2020. From the low in July, Ebang set a leading diagonal 5 swings higher which peaked on Sep 17 2020. Since that peak, it is had been very choppy, and is favoured to be presently correcting in a blue (4) before heading higher for one more swing. It is important to realize, this sector is very volatile, and proper risk management must be observed. Currently the stock is favoured to be correcting in blue (4) before heading higher in (5) of ((1)). However, while above the 3.80 low, further extension higher is favoured.

In Conclusion, with the data that is present, this stock is favouring further extenson lower before higher in at least one more high before correcting in a larger degree. But at this point, it is important to observe good risk management as the 5th wave can take on many shapes and forms.

Risk Management​

Using proper risk management is absolutely essential when trading or investing in a volatile stocks. Elliott Wave counts can evolve quickly, be sure to have your stops in and define your risk when trading.

Source: https://elliottwave-forecast.com/stock-market/ebang-international-holdings-ebon-nesting-higher/
 

Elliottwave-Forecast

Master Trader
Feb 17, 2017
2,453
9
84
www.elliottwave-forecast.com
Since the crash of March 2020, all stocks have tried to recover what they lost and Disney was no exception. Disney did not only recover the lost, but It also reached historic highs. Now, we are going to try to build an impulse from the March 2020 lows with a target around $230. Target measured from 0 to 2019’s high projected from March’s low, equal legs.

Disney Daily Chart

Disney Daily Chart 1

As we see in the daily chart, the waves ((1)) and ((2)) of the impulse have completed and currently we are building the wave ((3)). We hit our first target at 190.88. The target gave us a return of +18.58% from 160.97. We believe that 198.77 is the end of the wave (3) of ((3)) and wave (4) of ((3)) began to build. The area to watch to complete this wave (4) is between 180.93 – 164.53 where we must continue the rally to find out a new historical high and complete the wave (5) of ((3)).

Disney Daily Chart 2

Last two week the share has been ranging. Disney continue with the pullback, but we change the count from WXY to ABC as irregular flat correction. (If you want to learn more about Elliott Wave Theory, please follow this link: Elliott Wave Theory). Wave B moved further than the peak of the wave (3), that is a characteristic of a irregular flat, then we should look for a 5 waves down as a impulse to complete the ABC correction and wave (4).

Disney 30 Min Chart

Disney 30 Min Chart  1Wave W had ended and wave X had begun. The pullback of the wave ((b)) has been very depth and wave X could be a flat correction, so we expect a strong move higher to complete X in 188.18 – 191.60 area and then continue lower. If the market breaks the W low, the structure still could be an irregular flat for wave X and see the bounce that we are expecting.

Disney 30 Min Chart   2

Wave X was too strong than expected and we change the view to an ABC structure. That means if this is an irregular flat, we need to end the last wave C as an impulse or ending diagonal. The movement given last week suggest wave C is developing an ending diagonal, then we need 3 swings down as it is in the chart to complete the structure and also the end the wave (4) to continue the rally to look for wave (5) of ((3)).

Source: https://elliottwave-forecast.com/uncategorized/disney-irregular-flat-correction/
 

Elliottwave-Forecast

Master Trader
Feb 17, 2017
2,453
9
84
www.elliottwave-forecast.com
Lumber, also known as timber, is a type of wood that has been processed into beams and planks. One can trade it in form of Random Length Lumber futures and options at Chicago Mercantile Exchange within the agriculture asset class under the ticker $LBS. Currently, we see commodities in general, and metals and energy in particular turning higher. Lumber, which is mainly used in a construction, has gained 4x in price within less than 1 year. Will the rally in lumber prices make the real estate market to explode?

Lumber Monthly Elliott Wave Analysis 03.06.2021​

The monthly chart below shows the lumber front contract LBS #F. From the all-time lows, the prices have developed a cycle higher in blue wave (w) of a super cycle degree. It is a choppy and overlapping structure in series of 3. Therefore, the best count is to see the advance towards May 2018 highs at 648.5 as a double three pattern. From there, a correction lower in wave (x) has ended in April 2020 at 251.5. From the lows, a break to the new all-time highs has confirmed a new cycle higher in blue wave (y). Hereby, wave (y) should reach in 3 swings towards 900.4-1301.5 area. In fact, the minimum target being 900.4 has been already accomplished. However, based on the shorter cycles, still more upside can be expected, before a larger cycle in black wave ((w)) will end.

For 2021-2030, the expectations are to see more upside while the pullbacks should find support in 3, 7, 11 swings. Investors should not chase the market as of right now and can be looking to buy a larger pullback in black wave ((x)) for another extension higher in black wave ((y)).

Lumber Elliott Wave Monthly

Lumber Daily Elliott Wave Analysis 03.06.2021​

The daily chart below shows in more detail the advance from the April 2020 lows. From the bottom at 648.5, red waves a and b have ended. While above 490.8, red wave c can extend higher towards 1188.2-1353.0 area to end the blue wave (y) of black wave ((w)). Therefore, traders can be looking buying short term pullbacks against 634.9 lows in first degree for more upside towards 1188.2 level at least.

Lumber Elliott Wave Daily

Source: https://elliottwave-forecast.com/commodities/lbs-lumber-prices-explode-real-estate/
 

Elliottwave-Forecast

Master Trader
Feb 17, 2017
2,453
9
84
www.elliottwave-forecast.com
Swatch Group is a Swiss manufacturer of watches and jewellery. Besides the product line Swatch, the group owns brands including Blancpain, Breguet, ETA, Glashütte, Omega, Longines, Tissot, Hamilton, Certina, Rado and Harry Winston. As a matter of fact, the Swatch company employs about 36000 people in over 50 countries. Founded 1983 and headquartered in Biel/Bienne, Switzerland, it can be traded under tickers $UHRN and $UHR at Six Swiss Exchange. After printing the all-time highs in April 2014, the stock price has lost about 3/4 of the price by March 2020. Currently, we see Swatch starting a new larger cycle higher.

Swatch Monthly Elliott Wave Analysis 03.06.2021​

The monthly chart below shows the Swatch stock $UHRN traded at Six Swiss. From the all-time lows, the stock price has developed a cycle higher in wave ((I)) of a grand super cycle degree. Swatch has printed the all-time highs in April 2014 at 108.00. Without any doubt, the advance is a textbook quality impulsive move up in 5 waves. Also, the subdivisions are motive waves, too. From April 2014 highs, a correction lower in wave ((II)) has unfolded as a double three pattern being 3-3-3 structure. It has reached the equal legs extension area towards 31.74-17.66. From that area, a strong reaction higher can be seen. Hereby, Swatch might be in the first stages of a new cycle in black wave ((III)) higher. While above 28.56, Swatch should extend towards the new all-time highs targeting the 135.96-202.34 area and even higher.

Swatch Elliott Wave Monthly

Swatch Daily Elliott Wave Analysis 03.06.2021​

The daily chart below shows the advance higher in red wave I of blue wave I from the March 2020 lows. Within it, subwaves ((1))-((4)) have ended. Currently, wave ((5)) is in progress and is counting already 3 waves up. It is possible that the cycle in wave I will end soon and a correction in wave II will start in coming weeks. Hereby, the stock is expected to find support in 3, 7, 11 swings above 28.56 lows. Therefore, investors and traders can be looking to buy the wave II pullback for a rally in wave III.

Swatch Elliott Wave Daily

Source: https://elliottwave-forecast.com/stock-market/swatch-new-larger-cycle-higher/
 

Elliottwave-Forecast

Master Trader
Feb 17, 2017
2,453
9
84
www.elliottwave-forecast.com
Hello fellow traders. As our members know we have had a lot of good trading opportunities lately. Another instrument that we have been trading is Eurostoxx ( SX5E) Index from Group 2. In this technical blog we’re going to take a quick look at the Elliott Wave charts of SX5E published in members area of the website. As our members know, Eurostoxx has been showing incomplete bullish sequences from the March 2020 low , targeting 4074.7+ area. Consequently we were calling for more strength in the Index, suggesting members to avoid selling it and keep on buying the dips in 3,7,11 swings. In further text we’re going to explain Elliott Wave Forecast and Trading strategy.

Eurostoxx 1 Hour Elliott Wave Analysis 2.23.2021​

Eurostoxx is giving us pull back 2 red that looks incomplete at the moment. So far we got only 5 swings from the peak. Incomplete sequences are calling for another leg down toward 3649.26-3606.19 ( buyers zone) . From marked Blue Box area area we expect rally to take us toward new highs ideally. As our members know Blue Boxes are no enemy areas , giving us 85% chance to get a bounce. Strategy is buying the dips at the marked blue box area. As Eurstoxx is bullish against the 3479.22 low , we expect to see 3 waves bounce at least from the mentioned zone. As soon as the price reach 50 Fibonacci Retracement against the ((x)) black peak, we should make long positions Risk Free ( put SL at BE).

Eurostoxx

Eurostoxx 1 Hour Elliott Wave Analysis 2.26.2021​

Eurostoxx found buyers at the blue box 3649.26-3606.19 area. All long positions are risk free at this stage ( we took partial profits and put SL at BE). At the moment 3728.65 is the key level to watch. If it gets broken correction would be over . However at this stage we see possibility of another leg down toward next set of equal legs : 3629.63-3568.4. At that zone we would like to be buyers again.

Eurostoxx

Eurostoxx 1 Hour Elliott Wave Analysis 3.3.2021​

Eventually we got another leg down toward blue box area ( 3629.63-3568.4) as expected. Eurstoxx found buyers again and giving us nice rally. Long trades are risk free at this stage. We call wave 2 red completed at the 3622.34 low. However, break of red 1 peak( 2/15) in order to confirm next leg up is in progress. We don’t recommend selling the index in any proposed pull back and favor the long side from the blue box. Short term rally from the 3622.3 low should be ending soon as 5 waves structure. We expect to see 3 waves pull back in ((ii)) black wave soon, after which rally should ideally continue toward new highs.

Eurostoxx

Eurostoxx 1 Hour Elliott Wave Analysis 3.9.2021​

We got ((ii)) pull back. Correction ended at 3656.2 low and we got rally toward new highs again.
Keep in mind market is dynamic and presented view could have changed in the mean time. You can check most recent charts in the membership area of the site. Best instruments to trade are those having incomplete bullish or bearish swings sequences.We put them in Sequence Report and best among them are shown in the Live Trading Room

Eurostoxx

Elliott Wave Forecast
Source: https://elliottwave-forecast.com/trading/eurostoxx-buying-dips-extremes/
 

Elliottwave-Forecast

Master Trader
Feb 17, 2017
2,453
9
84
www.elliottwave-forecast.com
In Elliott Wave, there are several different corrective structures. Two of the most common corrective structures are zigzag ABC and double three WXY. A zigzag is a simple correction that all wavers is familiar with. The subdivision of ABC is 5-3-5, as the graph below illustrates.

ABC Zigzag Structure


The concept in Elliott Wave is simple. The main thesis is that trend moves in 5 waves called an impulse, while counter-trend moves in 3 waves. Thus in a bullish market, traders want to trade in the direction of the trend to the upside by buying a counter-trend pullback. To buy a pullback, traders need to wait for a clear 3 waves pullback such as a zigzag ABC above. In a typical ABC correction, wave C tends to end somewhere around 100% - 161.8% Fibonacci extension of wave A. Wave C should not extend more than 161.8% relative to wave A otherwise the entire decline can become a 5 waves.

The reason is because wave 3 in an impulse is usually the strongest and the longest wave. In Fibonacci terms, wave 3 tends to be at least 161.8% extension of wave 1. Since the subdivision of wave 1 and wave 3 in an impulse is also in 5 waves, we do not know ahead of time if the decline will be ABC or 123. Traders can identify whether the decline is a beginning of a 5 waves impulse or an ABC is by looking at the third swing extension. If the third swing extends only to 100% of the first swing, then it's an ABC zigzag. If the third swing extends to at least 161.8% of the first swing, then the odd increases that we are in an impulsive structure.

Traders who want to buy an ABC counter-trend move therefore can limit the risk at the 161.8% extension because below there, the entire decline can become impulsive and trend direction could change. Thus, traders who trade ABC pattern always have the risk that they are actually trying to buy a wave 3.

WXY Double Three Structure


Another type of corrective structure is a double three WXY, as the graph above illustrates. This is a complex correction involving two types of corrective structures. In the graph above, the first leg wave W and third leg wave Y are both zigzag. We can call this specific pattern a double zigzag. We can consider WXY as a 3-3-3 pattern. The first (W), second (X), and third leg (Y) all subdivide in 3 waves ((a))-((b))-((c)). In the simplest term, these are two zigzag corrections linked together in WXY. Despite the complex subdivision , this is essentially also a 3 swing correction labelled as WXY if we just focus on the main degree and not the subdivision.

Similar to ABC, wave Y also usually ends at 100% - 161.8% Fibonacci extension relative to wave W. The third swing wave Y should not go below 161.8% extension of the first swing wave W. Otherwise, it increases the odd of further downside. A trader who wants to buy a corrective pattern WXY thus can try to buy wave Y at the 100% of wave W with stop loss below 161.8%. There is however a major difference in buying a WXY correction compared to ABC. In a WXY pattern, the first leg wave W already shows a clear 3 waves subdivision.

Thus, it has confirmed the structure to be corrective. In ABC pattern however, the first leg wave A is in 5 waves. If traders buy wave C at 100% of wave A, they run the risk that wave C can become a wave 3. If traders buy wave Y at 100% of wave W however, the chance that it will become wave 3 and breaks below 161.8% extension is smaller because the first leg wave W in this case subdivides in 3 waves. In an impulse, the first swing wave 1 must subdivide in 5 waves, similar to wave A in a zigzag. Thus, if wave W is in clear 3 waves, it reduces the risk that the decline becomes an impulse.

In summary, WXY is a better corrective pattern to trade than ABC. The pattern reduces the risk that the correction will become an impulse which is something that traders want to avoid.

Source: https://elliottwave-forecast.com/el...-a-better-structure-to-trade-than-zigzag-abc/
 

Elliottwave-Forecast

Master Trader
Feb 17, 2017
2,453
9
84
www.elliottwave-forecast.com
Short term Elliott Wave View suggests that Eurostoxx rallies from January 28 low as a 5 waves impulse Elliott Wave structure. Up from January 28 low, wave 1 ended at 3742.53 and pullback in wave 2 ended at 3622.24. Internal of wave 2 unfolded as a Flat where wave ((a)) ended at 3643.33 and bounce in wave ((b)) ended at 3728.65. Index then resumed lower and ended wave ((c)) of 2 at 3622.24.

Index has resumed higher in wave 3. Up from wave 2 low, wave (i) ended at 3696.91 and dips in wave (ii) ended at 3671.63. Index then resumed higher in wave (iii) towards 3728.47, pullback in wave (iv) ended at 3707.72, and wave (v) ended at 3742.50. The 5 waves move completed wave ((i)) in higher degree. Index then ended pullback in wave ((ii)) at 3656.63. Wave ((iii)) of 3 is currently in progress as another 5 waves in lesser degree. Up from wave ((ii)) low, wave (i) ended at 3714.26 and wave (ii) pullback ended at 3666.38. Expect wave (iii) to end soon, and Index to pullback in wave (iv) before it resumes higher again. As far as pivot at 3656.63 low stays intact, expect Index to extend higher and dips to find support in 3, 7, or 11 swing.

Eurostoxx (SX5E) 45 Minutes Elliott Wave Chart​

Eurostoxx Elliott Wave Chart

Source: https://elliottwave-forecast.com/news/elliott-wave-view-upside-expected-eurostoxx/
 

Elliottwave-Forecast

Master Trader
Feb 17, 2017
2,453
9
84
www.elliottwave-forecast.com
SPACs have exploded in popularity in 2020 with many investors hopping on board the next hottest trend. Jaguar Health is one of those companies that have joined in with the SPAC craze as well as boasting plant based prescription medicine. In addition, the technicals are strong on this chart. Lets take a look at their company profile:

"Jaguar Health focus' on developing novel, sustainably derived gastrointestinal products on a global basis. Our wholly-owned subsidiary, Napo Pharmaceuticals, focuses on developing and commercializing proprietary human gastrointestinal pharmaceuticals for the global marketplace from plants used traditionally in rainforest areas."

Regarding the SPAC Rumors. Reportedly, Jaguar Health’s wholly owned subsidiary, Napo Pharmaceuticals, is discussing enacting a SPAC merger to take anticipated subsidiary Napo EU public.

Lets dig into the charts!

Jaguar Health Elliotwave View:

Jaguar Health

Medium term term view from the all time low in November 2020. Jaguar Health is favoured to have 5 swings into the peak into Red I on Jan 11, 2021 @ $5.00. From there, a lengthy Red II correction to that cycle occurred which bottomed recently on March 4, 2021 . Off that recent low @ 1.32, a sharp rally occured which is giving evidence to the Red II being set. In addition, there there is an extreme area blue box we are able to measure. This is an area where buyers and sellers enter into the market. For instance, some profit taking is likely to occur around the $6.13 to $9.11 area. However, Red III is more than capable of reaching the $9.11 price point considering the percentage gains enjoyed from the November 2020 low.

In Conclusion, with the data that is present, this stock is favoured to have struck a low recently at the March 4 2021 low. There is upside gains to be had as long as that level remains intact.

Risk Management​

Above all, using proper risk management is absolutely essential when trading or investing in a volatile stocks. Elliott Wave counts can evolve quickly, be sure to have your stops in and define your risk when trading.

Source: https://elliottwave-forecast.com/stock-market/jaguar-health-inc-jagx-looking-move-higher/
 

Elliottwave-Forecast

Master Trader
Feb 17, 2017
2,453
9
84
www.elliottwave-forecast.com

In this blog, we look at how Russell (RTY_F) reacted higher from the blue box​

The 1 hourly chart below is from 3/5/2021 New York update. In it, we see Russell already in the blue box. As per our strategy, we expected a reaction and a separation higher from there. Our view would be invalidated if price went below 2062.8. The decline from red wave X unfolded as a zig zag in red wave Y.

Internals of red wave Y are subdivided into two impulses ((a)) and ((c)). These two impulses were connected by connector wave ((b)). In some instances, Wave ((c)) can unfold as an ending diagonal . Because waves ((a)) and ((c)) were impulse waves themselves, each have impulse waves subdivisions. The right side is upside against 2062.8, and we prefer to buy Russell in 3, 7 or 11 swings looking for more upside.


ElliottWave 1 hourly chart from 3/5/2021​

Russell 5 March 1 hour

In the 1 hour chart below, we see a reaction higher from the blue box as per forecast. We expected the reaction to complete an impulse in the intermediate degree. The chart shows red wave 1 completed, with a pull back in 2 also called completed. From the wave 2 lows, we see a futher rally in wave 3, although the bullish sequence appeared incomplete. As far as it is above 2085.6, we favor more upside. However, the market does not move linearly. Therefore we will expect pull backs during the upside advance. And we will be looking to buy the aforementined pull backs in 3, 7 or 11 swings.

ElliottWave 1 hourly chart from 3/11/2021​

Russell 11 March 1 Hour

Our blue box system is a very effective system that we, and our members use to enter trades. We offer analysis on 78 different instruments, 3 live trading room sessions per day. We also provide regular updates on all 78 instruments.

Source: https://elliottwave-forecast.com/stock-market/russell-reacts-higher/
 

Elliottwave-Forecast

Master Trader
Feb 17, 2017
2,453
9
84
www.elliottwave-forecast.com
Since the crash of March 2020, all stocks have tried to recover what they lost, and Disney was no exception. Disney did not only recover the lost, but It also reached historic highs. Now, we are going to try to build an impulse from the March 2020 lows with a target around $230. Target measured from 0 to 2019’s high projected from March’s low, equal legs. Since we begin with this analysis on February 13th, we bought the share in 160.97 - 165.89 area.

Disney Daily Chart Disney Daily Chart 1

As we see in the daily chart, the waves ((1)) and ((2)) of the impulse have completed and currently we are building the wave ((3)). We hit our first target at 190.88. The target gave us a return of +18.58% from 160.97. Last week the share has continued ranging. Disney did not make too much progress and the current structure shows that it is better to thinkthe stock should build to the upside an ending diagonal. (If you want to learn more about Elliott Wave Theory, please follow this link: Elliott Wave Theory).

Disney Daily Chart 2

This ending diagonal makes me think about to adjust the impulse counting. Although it is the same result as the previous chart, that we are finishing wave ((3)), structurally speaking it looks much better labelled wave (3) at 183.55 and wave (4) at 160.56. Thus, the move from 160.56 is wave (5) as diagonal. In the chart we suggest a structure to form the ending diagonal, but it could change during the week. I do not think we will complete the diagonal this week because these are slow structure to develop. Then we will see in what area this wave ((3)) could be ending and the possible levels for wave ((4)).

Disney 30 minutes Chart

Disney 30 min Chart

We change the near term structure as an ending diagonal, wave 1 and 2 in red has concluded and we are building wave 3 as an ((a)), ((b)) and ((c)) structure. The chart shows wave ((b)) still needs one more low to complete it and we should look for a bounce in 189.63 – 183.82 area. The market would continue the rally and break above wave ((a)) to find a top to end wave ((c)) and also wave 3 in red.

Source: https://elliottwave-forecast.com/stock-market/disney-extended-bullish-momentum-wave-5/
 

Elliottwave-Forecast

Master Trader
Feb 17, 2017
2,453
9
84
www.elliottwave-forecast.com
Hello fellow traders. Copper Futures ( $HG_F ) is another instrument that has given us nice trading opportunity lately . As our members know the commodity is showing impulsive bullish sequence in the cycle from the March 2020 low. We recommended members to avoid selling the commodity and keep on buying the dips in 3,7,11 sequences when get chance. In this technical blog we’re going to take a quick look at the charts of Copper published in members area of the website and explain the Elliott Wave structure and trading strategy.

Copper Elliott Wave 4 Hour Chart 1.30.2021​

Copper remains bullish against the 3.0318 low . Pull back has reached its equal legs at 3.4953-3.3788 ( buyers area). We see possibility that Copper can make another leg down toward blue box. However, we should keep in mind that minimum number of swings is already in place and turn could happen any moment. Anyway , equal legs is reached and long positions are already open. The main trend is bullish we expect to see at least 3 waves bounce from the marked zone. As our members know Blue Boxes are no enemy areas , giving us 85% chance to get a reaction.

You can learn more about Elliott Wave Patterns at our Free Elliott Wave Educational Web Page.


Copper Elliott Wave 4 Hour Chart 3.3.2021​

The commodity found buyers as we expected. Copper has given us very good rally from the buying zone 3.4953-3.3788 . Pull back (2) ended at 3.4781 low. Currently Copper is giving us (4) pull back that is correcting cycle from the 3.4781 low. Pull back looks to be unfolding as Elliott Wave Double Three Pattern that has scope to reach 3.908-3.7108 area. At that zone we would like to be buyers again.

Copper

Copper Elliott Wave 4 Hour Chart 3.3.2021​

Copper pair found buyers at 3.4953-3.3788 the Blue Box area. We got nice reaction from there so far. We call wave (4) blue pull back completed at 3.8503 low. Bounce from the buying zone has already reached 50fibs against the B red high, so long positions are risk free. We would like to see further extension higher and break above (3) blue peak (02/25) to confirm next leg up is in progress.


Elliott Wave Forecast
Source: https://elliottwave-forecast.com/trading/copper-hg_f-buying-dips-extremes/
 

Elliottwave-Forecast

Master Trader
Feb 17, 2017
2,453
9
84
www.elliottwave-forecast.com
$GLD Long Term Cycles and Elliott Wave Analysis

Firstly the GLD ETF fund is one of the largest as well as one of the oldest Gold tracking funds out there since it’s inception date of November 18, 2004. From there on up into the September 2011 highs it ended a larger bullish cycle as did the Gold commodity in terms of US dollars. From the September 2011 highs the price decline was pretty steep however does appear corrective as a double three (a)-(b)-(c) (in blue color) into the December 2015 lows.

Secondly I would like to mention that the bounce from the December 2015 lows at 100.23 into the July 2016 wave (I) highs (in blue) is clearly an Elliott Wave impulse. The bounce was strong enough to suggest it ended the cycle lower from the September 2011 highs as well thus at this point it is very much suspected to be resuming a long term bullish trend from the December 2015 lows. As shown above from there the metal made a wave (I) high in July 2016. From there it appears to have made a simple a-b-c structure to end the wave (II) (in blue) at the December 2016 lows.

The analysis continues below the monthly chart.


Thirdly in conclusion: From the wave (II) (in blue) lows from December 2016, the bounce higher appears to have a complete bullish sequence of five waves up in an Elliott Wave impulse. Currently the metal instrument appears to have been correcting the cycle from the December 2016 lows. This appears ended at the 157.13 lows from 3/8/21. While above there expect the metal higher toward the larger degree equal legs of the ((a))-((b)) move at 286.08.

Source: https://elliottwave-forecast.com/stock-market/gld-long-term-cycles-and-elliott-wave-analysis/
 

Elliottwave-Forecast

Master Trader
Feb 17, 2017
2,453
9
84
www.elliottwave-forecast.com
$SLV Silver ETF Elliott Wave and Larger Cycles

Firstly there is data back to when the ETF fund began in 2006 as seen on the weekly chart shown below. The fund made a low in 2008 at 8.45 that has not since been taken out in price. It could have been up until The point of the spike higher in July 2020. You should be able to assume from the October 2008 lows to the April 2011 highs was a larger degree impulse ending from all time Silver lows either way.

Secondly, the decline from the April 2011 highs down to the May 2011 lows was five waves. Price held below the April 2011 highs during the bounce from the May 2011 lows to the August 2011 high.

The analysis continues below the weekly chart.


Thirdly, the cycle from the August 2011 high now appears complete. The red I , II & III decline to the December 2015 lows best looks as two Elliott Wave impulses. The bounce to the August 2016 high was strong enough to suggest it had corrected the cycle from the red wave II highs in February 2012. From the August 2016 high the decline appears to be an Elliott Wave triangle structure that ended the wave “E” at the February 2020 highs. From this point in time the instrument printed a clean Elliott wave impulse lower into the March 2020 lows at 10.86.

In conclusion. Down from the April 2011 highs SLV exhibits all qualities of an Elliott Wave zig zag structure that now appears complete at this point. This is partially due to the bounce from the March 2020 lows. It was strong enough and apparently in five waves. This suggests the correction of the cycle up from the all time lows has completed. Near term while above the 3/5/21 lows Silver can turn higher is again.

Source: https://elliottwave-forecast.com/stock-market/slv-silver-etf-elliott-wave-and-larger-cycles/
 

Elliottwave-Forecast

Master Trader
Feb 17, 2017
2,453
9
84
www.elliottwave-forecast.com
In this technical blog, we will look at the past performance of 1 hour Elliott Wave Charts of SPY, which we presented to members at the elliottwave-forecast. In which, the rally from 27 January 2021 low unfolded as an impulse structure. And showed a higher high sequence favored more upside extension to take place. Therefore, we advised members not to sell the ETF & buy the dips in 3, 7, or 11 swings at the blue box areas. We will explain the structure & forecast below:

SPY 1 Hour Elliott Wave Chart​

SPY Another Pullback Offered Another Buying Opportunity

Above is the 1 hour Elliott wave Chart of SPY from the 3/01/2021 Pre-Market update. In which, the SPY ended the 5 wave impulse rally in wave 1 at $395.35 high. Down from there, the ETF made a pullback in wave 2. The internals of that pullback unfolded as a double three structure where wave ((w)) ended at $380.20 low. Wave ((x)) bounce ended in 3 swings at $393.10 high and wave ((y)) was expected to reach the $377.97- $368.59 100%-161.8% Fibonacci extension area of ((w))-((x)). From there, buyers were expected to appear looking for further upside.

SPY 1 Hour Elliott Wave Chart​

SPY Another Pullback Offered Another Buying Opportunity

Here’s the 1 Hour Elliott wave Chart of SPY from the 3/14/2021 Weekend update. In which, the ETF managed to reach the blue box area at $377.97- $368.59 & showing a strong reaction higher taking place from the blue box area. Right after ending the double three correction within the blue box area at $371.83 low. And breaking to new highs as expected. Allowed members to create a risk-free position shortly after taking the long positions at the blue box area.

Source: https://elliottwave-forecast.com/stock-market/spy-pullback-offered-another-buying-opportunity/
 

Elliottwave-Forecast

Master Trader
Feb 17, 2017
2,453
9
84
www.elliottwave-forecast.com

SPX is expected to rally further and set new record highs​

SPX recovery from the March 2020 lows was remarkable. This was amidst skeptics favoring lower, as it was believed to have started crashing. Little did they know that it was setting up to make new, never seen before highs. From the March 2020 lows, we saw a relatively sharp and steady rise in the index.

We completed red wave ((3)) in the 3950 area, as shown in the chart below. As per Elliott Wave theory, wave ((3)) would have been an impulse. Naturally, we expect the subdivisions within the third wave to also be impulses of a lesser degree. In other words, the intermediate or blue impulse waves.

Elliott Wave 1 Hour chart from 3/5/2021SPX 1 H

The chart below is from 3/9/2021. We see in it that black wave ((3)) was followed by what was favored to be a correction in ((4)). We saw 7 swings in ((4)) reaching the blue box. As per our system, we expect a reaction higher from the blue box. Indeed, we saw the expected reaction higher as shown in the chart below. We proposed wave ((4)) low to have set at 3723.76. And we expect more upside while price stays above there.

Theoretically, we need to see a break above ((3)) peak. After such a break above, we can then confirm a leg higher in ((5)). This is because we cannot rule out a double correction lower in ((4)) while price is below wave ((3)) peak. Long positions from the blue box were already running risk free as at 3/9/2021. And since we broke above wave ((3)) peak, we will be looking for dips in 3, 7 or 11 swings to add to our long positions from the blue box.

Elliott Wave 1 Hour chart from 3/9/2021 SPX 1 H

In the chart below, we see further extension higher in SPX. One should note that the degrees were revised, and it is still favored in ((3)). However, this does not change the view on long positions from the blue box. We saw the extension higher from the blue box as we had correctly anticipated. The right side remains upside.

SPX

Source: https://elliottwave-forecast.com/stock-market/spx-continue-higher/
 

Elliottwave-Forecast

Master Trader
Feb 17, 2017
2,453
9
84
www.elliottwave-forecast.com
On March 8 2021 I posted on social media @AidanFX "AUDJPY LONG at 83.40 Stop Loss at 82.77 Target 84.03 - 84.34 area." and "AUDJPY 2nd LONG at 83.43 Stop Loss at 83.12 Target 83.74 - 84.03 area."

AUDJPY, trading, forex, elliottwave, market patterns, @AidanFX, AidanFX


The chart below was also posted on social media @AidanFX March 8 2021 showing several clear bullish market patterns. Blue bullish pattern already triggered BUYERS at the BC 0.50% Fib. retracement level. After triggering BUYERS at the BC 0.50% level the pair also found a support/resistance zone (blue box) where price bounced higher from. Pink bullish pattern also triggered buyers in the same support resistance zone. Added bullish patterns (light blue) also triggered buys with bullish divergence patterns (black) signalling traders that BULLS had control. All these bullish patterns was all I needed to be confident on posting the LONG/BUY trade setup March 8 2021 for a move higher.

AUDJPY 1 Hour Chart March 8 2021


AUDJPY, trading, forex, elliottwave, market patterns, @AidanFX, AidanFX


In the chart below, the pair formed a bullish flag breakout pattern (blue) and on March 10 2021 I added another LONG position (purple 83.80) on the break above the flag pattern.

AUDJPY 1 Hour Chart March 10 2021


AUDJPY, trading, forex, elliottwave, market patterns, @AidanFX, AidanFX


AUDJPY eventually moves higher and on March 11 2021 price hits the black LONG 1:4 RR target at 84.67 from 83.43 for +124 pips and green LONG 1:2 RR target at 84.66 from 83.40 for +126 pips. Purple LONG entry also hit 1:2 RR target at 84.46 from 83.80 for +66 pips. If you followed me on social media @AidanFX you too could have caught the AUDJPY move higher. We at EWF never say we are always right. No market service provider can forecast markets with 100% accuracy. Only thing we at EWF 100%, is that we are RIGHT more than we are WRONG.

AUDJPY 1 Hour Chart March 11 2021

AUDJPY, trading, forex, elliottwave, market patterns, @AidanFX, AidanFX

Of course, like any strategy/technique, there will be times when the strategy/technique fails so proper money/risk management should always be used on every trade. Hope you enjoyed this article and follow me on social media for updates and questions> @AidanFX

At Elliottwave-Forecast we cover 78 instruments (Forex, Commodities, Indices, Stocks and ETFs) in 4 different time frames and we offer 5 Live Session Webinars everyday. We do Daily Technical Videos, Elliott Wave Trade Setup Videos and we have a 24h Chat Room. Our clients are always in the loop for the next market move.

Source: https://elliottwave-forecast.com/aidans-corner/audjpy-bullish-market-patterns-calling-move-higher/
 

Elliottwave-Forecast

Master Trader
Feb 17, 2017
2,453
9
84
www.elliottwave-forecast.com
In this technical blog we’re going to take a quick look at the Elliott Wave charts of XLP ETF published in members area of the Elliottwave-Forecast . As our members know, XLP is showing impulsive bullish sequences in the cycle from the March 2020 (47.65) low. Recently we got short term pull back that has unfolded as Elliott Wave Double Three pattern that has given us opportunity to enter long trades. In further text we’re going to explain the forecast and Elliott Wave Pattern and trading strategy.

Before we take a look at the real market example, let’s explain Elliott Wave Double Three pattern.

Elliott Wave Double Three Pattern​

Double three is the common pattern in the market these days, also known as 7 swing structure. It’s a reliable pattern which is giving us good trading entries with clearly defined invalidation levels and target areas.
The picture below presents what Elliott Wave Double Three pattern looks like. It has (W),(X),(Y) labeling and 3,3,3 inner structure, which means all of these 3 legs are corrective sequences. Each (W) and (Y) are made of 3 swings , they’re having A,B,C structure in lower degree, or alternatively they could have W,X,Y labeling.

XLP

XLP 4 Hour Elliott Wave Analysis 3.02.2021​

Current view suggests pull back ((4)) black is unfolding as Elliott Wave double three pattern with inner labeling: (W)(X)(Y) blue. As we can see on the chart below each leg has corrective sequences. The price has slightly missed equal legs at 63.1. We believe another marginal push down can be seen toward blue box area 63.1-60.79. Trading strategy remains buying the dips at the extreme zone, if it gets reached. As the main trend is bullish buyers should appear at the blue box for a 3 waves bounce at least. Once bounce reaches 50 fibs against the middle pivot (X) blue , we should make long positions risk free.

You can learn more about Elliott Wave Double Three Patterns at our Free Elliott Wave Educational Web Page.

XLP

XLP 4 Hour Elliott Wave Analysis 3.10.2021​

Eventually XLP made another leg down as we expected. ETF found buyers right at the Blue Box area. Wave ((4)) pull back is completed at the 32.81 low. Bounce already reached and exceeded 50 fibs against the (X) blue pivot. All long positions from the blue box area should be risk free at this stage.

XLP

XLP 1 Hour Elliott Wave Analysis 3.21.2021​

This is what the price structure looks like in shorter time frame. The price made further separation higher from the 62.82 low. Current view suggests we have ended 5 waves up from the mentioned low, and now correcting that cycle. Pull back looks incomplete at the moment and we still can see another leg down C red of (2) blue.

Keep in mind that market is dynamic and presented view could have changed in the mean time. You can check most recent charts in the membership area of the site. Best instruments to trade are those having incomplete bullish or bearish swings sequences. We put them in Sequence Report and best among them are shown in the Live Trading Room.

XLP

Elliott Wave Forecast
Source: https://elliottwave-forecast.com/elliottwave/xlp-buying-elliott-wave-double/