Elliottwave-Forecast

Master Trader
Feb 17, 2017
2,462
9
84
www.elliottwave-forecast.com
EURNZD this week dropped to a new low and traded at it's lowest level since 21st February 2020. The recent decline started after sellers entered in our blue box area. In this article, we will look at some recent charts from members area calling for the bounce to get rejected in the blue box for new lows and how the decline unfolded after that. Let's start by taking a look at 1 Hour chart from November 13, 2020.

EURUZD 1 Hour Elliott Wave Analysis 11.13.2020​

Chart below shows EURNZD is in an impulsive decline when wave ((i)) of 3 completed at 1.7400, wave ((ii)) of 3 completed at 1.7557, wave ((iii)) of 3 completed at 1.7248, wave ((iv)) of 3 completed at 1.7366 and wave ((v)) of 3 completed at 1.7043. Following this pair started a wave 4 bounce which took the form of a Zigzag Elliottwave correction and reached blue box area between 1.7306 - 1.7407 which is basically 100- 161.8 % Fibonacci extension area of ((a)) related to ((b)). In the chart below, we called wave 4 bounce completed at 1.7343 and expected the decline to resume in wave 5 However, even if the pair made a new high above 1.7343, it should still be treated as a wave 4 as far as pric stayed below 161.8 Fibonacci extension of ((a)) related to ((b)) at 1.7407.

EURNZD 13 November 1 Hour Elliott Wave Analysis

EURNZD 1 Hour Elliott Wave Analysis 11.17.2020​

Chart below shows sellers did appear in the blue box and pair resumed the decline, pair is showing 5 swings down from wave 4 peak (1.7343) suggesting wave ((i)) is complete at 1.7142, wave ((ii)) bounce is in progress and as it fails below 1.7343 high, we expect the decline to resume. Price already reached 50% retracement of the rally from black ((b)) low so any sellers which entered in the blue box should already be in a risk free position.

EURNZD 17 November 1 Hour Elliott Wave Analysis

EURNZD 1 Hour Elliott Wave Analysis 11.24.2020​

Proposed wave ((ii)) bounce failed below 1.7343 peak as expected and pair went on to make a new low below wave 3 low confirming the bounce was indeed wave 4 and new low is part of wave 5.

EURNZD 24 November 1 Hour Elliott Wave Analysis
 

Elliottwave-Forecast

Master Trader
Feb 17, 2017
2,462
9
84
www.elliottwave-forecast.com
Short Term Elliott Wave view in AUDJPY suggests the pullback to 75.3 ended wave 2. Internal subdivision of wave 2 unfolded as a double three Elliott Wave structure. Down from November 11 peak (77.09), wave ((w)) ended at 75.74, wave ((x)) ended at 76.77, and wave ((y)) ended at 75.3.

Pair has turned higher in wave 3, but it still needs to break above the previous wave 1 peak on November 11 to rule out a double correction. Internal of wave 3 is unfolding as a 5 waves impulse structure. Up from wave 2 low at 75.3, wave (i) ended at 75.97 and wave (ii) pullback ended at 75.66. Pair then resumes higher in wave (iii) towards 77.04, and pullback in wave (iv) ended at 76.4. Expect pair to extend a few more highs to end wave (v) and this should complete wave ((i)) in higher degree. Afterwards, expect pair to pullback in wave ((ii)) to correct cycle from November 20 low before the rally resumes. As far as pivot at November 20 low at 75.3 remains intact, expect dips to find support in 3, 7, or 11 swing for further upside.

AUDJPY 60 Minutes Elliott Wave Chart​

AUDJPY Elliott Wave Chart
 

Elliottwave-Forecast

Master Trader
Feb 17, 2017
2,462
9
84
www.elliottwave-forecast.com
In this technical blog, we are going to take a look at the past performance of 1 hour Elliott Wave Charts of Tesla ticker symbol: $TSLA, which we presented to members at elliottwave-forecast. In which, the rally from 30 October 2020 low unfolded as an impulse structure. Thus suggested that it’s a continuation pattern. And as per Elliott wave theory after a 3 waves pullback, it should do another extension higher in 5 waves impulse structure at least. Therefore, we advised members not to sell the Tesla & trade the no enemy areas ( blue boxes) as per Elliott wave hedging remained the preferred path looking for 3 wave reaction higher at least. We will explain the structure & forecast below:

Tesla 1 Hour Elliott Wave Chart From 11/09/2020​

Tesla Forecasting The Rally Higher From Blue Box Area

Here's 1 hour Elliott Wave Chart from the 11/09/2020 Midday update. In which the pullback in wave ((2)) unfolded as a double three structure where wave (W) ended at $407.38 low. Wave (X) bounce ended at $430.50 high and wave (Y) ended at $379.14 thus completed the pullback. Up from there, the Tesla rallied higher in an impulse sequence & ended wave A at $452.50 high. Down from there, the stock made a short-term pullback against the $379.14 low & was expected to provide us buying opportunity in 3 or 7 swings.

Tesla 1 Hour Elliott Wave Chart From 11/10/2020​

Tesla Forecasting The Rally Higher From Blue Box Area

Here's 1 Hour Elliott Wave Chart of Tesla from 11/10/2020 Midday update. In which the stock made a wave B pullback as a double three structure & managed to reach the blue box area at $407.62- $388.13 100%-161.8% Fibonacci extension area of ((w))-((x)). Therefore, offered members a buying opportunity looking for new highs ideally or for a 3 wave bounce at least.

Tesla 1 Hour Elliott Wave Chart From 11/17/2020​

Tesla Forecasting The Rally Higher From Blue Box Area

Above is the 1 Hour Elliott Wave Chart from 11/17/2020 Post-Market update. Showing a strong reaction higher taking place from the blue box area. Allowed members to create a risk-free position shortly after taking the longs at $407.62- $388.13 blue box area as per Elliott wave hedging.
 

Elliottwave-Forecast

Master Trader
Feb 17, 2017
2,462
9
84
www.elliottwave-forecast.com
An ending diagonal is an Elliott Waves structure that is wedge-shaped and can appear within an impulse as wave 5 or within a correction as a wave C. This type of structure internally is composed of 5 waves and each of these 5 waves is subdivided into 3 or 5 waves creating two possible structures 3-3-3-3-3 or 5-3-5-3-5.

An ending diagonal indicates that the end of a cycle is near and this has two consequences: 1. The market corrects the finished cycle and then continue with the trend 2. We have a short, medium or long term trend change depending on the cycle that the market is ending. This makes the ending diagonal a very powerful technical structure because gives us great trading opportunities. For more information on Elliott's Theory you can visit this link: Elliott's Wave Theory.

Ending Diagonal Structure

Coffee Ending Diagonal​

Coffee Ending Diagonal

Above we can see in early November that an ending diagonal was forming in Coffee ($KC #F). We have a corrective structure (A) (B) (C) from the peak, where wave (C) is an ending diagonal indicating that the correction was about to finish and we should see a bounce in 3 swings at least or continue with the uptrend. For the moment Coffee continues with the bullish movement and does not indicate any change in the trend until it does not break the invalidation level of 102.14.
 

Elliottwave-Forecast

Master Trader
Feb 17, 2017
2,462
9
84
www.elliottwave-forecast.com
$SMH Semiconductors ETF Long Term Cycles & Elliott Wave

Firstly as seen on the monthly chart shown below. There is data back to May 2000 in the ETF fund. Data suggests the fund made a low in November 2008. This low has not been taken out in price. The cycles in this instrument tends to reflect the Nasdaq index fairly well however it has a larger degree difference in that the Nasdaq made a low to correct the cycle from the all time lows in October 2002 compared to the low made in November 2008 in the SMH semiconductors.

Secondly every way I count this data it suggests several things. Several counts are always possible however the wave (III) in blue is still in progress as per the best reading of the cycles.

The analysis continues below the monthly chart.


Thirdly the instrument can relatively soon see an Elliott Wave IV pullback to correct the cycle from the March 2020 lows which data does not support happening as of right now in the smaller time frames. The instrument should see some further gains into the 212.35 to 239.82 area. Afterward the wave IV should see only around a .236 to .382 retracement of the wave III before turning higher again in wave V of (III).

In conclusion it appears the pullback to the March 2020 lows already corrected the cycle up from the blue wave (II) lows. I always like to give the trend benefit of the doubt. In this case it should be obvious the trend is higher. The longer term lows highlighted on the chart suggest the SMH should trade higher while above the March 2020 lows. Furthermore importantly while above the December 2018 lows according to the price data currently available.
 

Elliottwave-Forecast

Master Trader
Feb 17, 2017
2,462
9
84
www.elliottwave-forecast.com
In this technical blog, we are going to take a look at the past performance of 1 hour Elliott Wave Charts of XLF an ETF from the financial sector. In which, the rally from 29 October 2020 low unfolded as impulse structure favored more strength to take place. Also, the right side tag pointed higher & favored more strength. Therefore, we advised our members to buy the dips in XLF in 3, 7, or 11 swings at the blue box areas. We will explain the structure & forecast below:

XLF 1 Hour Elliott Wave Chart From 11.12.2020​

XLF Forecasting The Rally From Elliott Wave Blue Box Areas

Above is the 1 Hour Elliott wave Chart from the 11/12/2020 Midday update. In which, the pullback to $23.25 low ended wave 2. Up from there, the rally higher took place as impulse structure where wave ((i)) ended at $25.10 high. Wave ((ii)) ended at $24.18 low, wave ((iii)) ended at $27.45 high. While wave ((iv)) pullback managed to reach the $26.74- $26.33 100%- 161.8% Fibonacci extension area of (a)-(b) and provided buying opportunity to the members looking for more upside or for 3 wave reaction higher at least.

XLF 1 Hour Elliott Wave Chart From 11.25.2020​

XLF Forecasting The Rally From Elliott Wave Blue Box Areas

Here’s the 1 Hour Elliott wave Chart from the 11/25/2020 Pre-Market update. Showing Coffee reaching the blue box area & reaction higher from the blue box area and ended wave ((v)) of 3 at $27.97. Down from there, the ETF made a pullback in wave 4. The internals of that pullback unfolded as a zigzag structure where wave ((a)) ended at $27.13 low. Wave ((b)) bounce ended at $27.94 high and wave ((c)) ended at $27.02 low. Up from there, wave ((i)) of 5 ended at $28.96 high in another 5 waves impulse sequence and made another 3 wave pullback within wave ((ii)).

XLF 1 Hour Elliott Wave Chart From 11.30.2020​

XLF Forecasting The Rally From Elliott Wave Blue Box Areas

Here's 1 Hour Elliott wave chart from the 11/30/2020 Pre-Market update. In which, the ETF made another 3 wave pullback in lesser degree wave ((ii)). The internals of that pullback unfolded as a zigzag structure where wave (a) ended at $28.22 low. Wave (b) bounce ended at $28.61 high and wave (c) was expected to reach $27.87- $27.41 100%-161.8% Fibonacci extension area of (a)-(b). From there, buyers were expected to appear for more upside or for 3 wave reaction higher at least.

XLF 1 Hour Elliott Wave Chart From 11.03.2020​

XLF Forecasting The Rally From Elliott Wave Blue Box Areas

Here’s the Latest 1 Hour Elliott wave Chart From 12/03/2020 Post-Market update. Showing XLF reaching the blue box area & reaction higher. Allowed members to create a risk-free position shortly after taking the longs at $27.87- $27.41 blue box area.

Source: https://elliottwave-forecast.com/stock-market/xlf-forecasting-rally-elliott-wave/
 

Elliottwave-Forecast

Master Trader
Feb 17, 2017
2,462
9
84
www.elliottwave-forecast.com
Hard Red Winter Wheat is one of the grain commodities, along with soft red wheat, corn, soybeans and others. Within the wheat family, first of all, there is a fundamental difference between two wheat types. Soft wheat is low in protein and is basically used in cakes in pastries. By contrast, hard wheat has a higher content of protein and it founds itself in breads and hard baked goods. Some time ago, trading of hard wheat took place at Kansas City Board of Trade. Then, it moved to Chicago. One can trade hard wheat futures at Chicago Board of Trade under the ticker $KE. Hereby, the contract size is 5'000 bushels (300'000 pounds) each and the prices are in Dollars US per 100 bushel.

Hard Red Winter Wheat Weekly Elliott Wave Analysis 12.02.2020​

The weekly chart below shows the Hard Winter Wheat front contract IH #F. From the all-time lows, the prices have developed a cycle higher in black wave ((a)) of a grand super cycle degree. It has ended in March 2018 at 1148 Dollars. From the highs, a correction lower in wave ((b)) has unfolded as an Elliott Wave double three pattern. In 8 years, as a matter of fact, IH #F has lost 3/4 of the price reaching 296 Dollars per 100 bushel. It is the preferred view that an important bottom on October 2016 has been set and the black wave ((b)) has ended.

From the lows, consequently, a new rally within wave ((c)) may have started. Hereby, the cycle degree waves I and II have already ended, while above 365, wave III can extend higher and it can see 625-785 area. For 2020-2030, the expectations are to break out to the new all-time highs. The long-term target for wave ((c)) to end will be 1444-2153 area.

Hard Red Winter Wheat Elliott Wave Weekly

Source: https://elliottwave-forecast.com/commodities/hard-red-winter-wheat-rising-price/
 

Elliottwave-Forecast

Master Trader
Feb 17, 2017
2,462
9
84
www.elliottwave-forecast.com
Hello fellow traders. In this technical blog we’re going to take a quick look at the charts of USDCAD published in members area of the website. As our members know, USDCAD is showing lower low sequences in the cycle from the 03/19 peak . We advised clients to avoid buying the pair ,while favoring selling it at the Blue Box. In the charts below, we’re going to explain the Elliott Wave structure and trading setup.

USDCAD Elliott Wave 1 Hour Chart 11.13.2020​

Current view suggests The Pair is correcting the cycle from the 1.33908 peak. Recovery is having form of Elliott Wave Zig Zag Pattern that should ideally complete at 1.31105-1.3190 area . We expect another marginal push up to complete recovery. However we should be aware that sellers zone is already reached and turn can happen any moment . At the Blue Box area we expect sellers to appear for decline toward new lows ideally. Once the price reaches 50 fibs against the (b) blue low, we should make short positions risk free.As our members know Blue Boxes are no enemy areas , giving us 85% chance to get a bounce.

You can learn more about Elliott Wave Zig Zag Patterns at our Free Elliott Wave Educational Web Page.

USDCAD

USDCAD Elliott Wave 1 Hour Chart 11.13.2020​

USDCAD found sellers right at the blue box : 1.31105-1.3190 area. The pair gave us nice decline from there . At this stage we see wave ((iv))) recovery completed at the 1.31702 peak. However it needs to make break of 11/09 low to confirm next leg down is in progress.

Keep in mind market is dynamic and presented view could have changed in the mean time. You can check most recent charts in the membership area of the site. Best instruments to trade are those having incomplete bullish or bearish swings sequences.We put them in Sequence Report and best among them are shown in the Live Trading Room.

USDCAD

Source: https://elliottwave-forecast.com/trading/usdcad-turned-lower-blue-box/
 

Elliottwave-Forecast

Master Trader
Feb 17, 2017
2,462
9
84
www.elliottwave-forecast.com
Russian Rouble (or Ruble) is the currency of the Russian Federation and the 17th most traded currency in the world. Within current environment of rising commodity prices, the world market impact of Russia, which is a major commodities producer, should strengthen. Without any doubt, this fact will increase the trading volumes of the Russian national currency. Therefore, a correct anticipation of the price action of Rouble against the dominating currency USD is essential. The outlook is, hereby, important for USDRUB pair traders as well as for investors in Russian stocks, commodity funds and more. In this blog, a technical analysis of the USDRUB is provided for both long and medium terms.

Rouble Monthly Elliott Wave Analysis 12.06.2020​

The monthly chart below shows the USDRUB pair traded on the Forex market. From July 2008, the USDRUB is extending higher within a wave ((c)) of a grand super cycle degree. From the 2008 lows at 23.06, the cycle higher has accomplished so far the waves (I)-(III). Hereby, the pair saw the all-time highs on January 2016 at 85.94. Wave (III) has extended far beyond the 1.618 multiples of the wave (I) confirming that the larger cycle from 2008 lows is an impulse. To be mentionned, impulses are motive waves and they count from (I) to (V). Therefore, after a consolidation in wave (IV), at least another push towards 85.94 and higher in wave (V) should be expected. Long term view of USDRUB, as a consequece, favors more Rouble weakness.

In the medium term, Rouble should strengthen against USD. Correlation across the market instruments supports the Elliott Wave contracting triangle pattern in the USDRUB. Triangle is a 3-3-3-3-3 continuation structure. From the January 2016 highs, red waves a and b of the cycle degree have ended on March 2020. While below the 82.90 highs, wave c of (IV) should extend lower towards 66.07-56.87 area. Later on, expect wave d higher to fail below 82.90 highs for another leg lower in wave e. Then, wave (V) can start towards 85.94 highs and even beyond.

Rouble Elliott Wave Monthly

Rouble Daily Elliott Wave Analysis 12.06.2020​

The daily chart below shows the c leg lower of the triangle in wave (IV) in more detail. From the March highs at 82.90 highs, the pair has demonstrated a first leg lower which has accomplished 7 swings corrective structure in wave ((W)). Then, a bounce in wave ((X)) has failed below the march highs. Currently, while below 80.95, another leg down is in progress. It should develop a corrective structure and reach in wave ((Y)) towards 66.07-56.87 area. There, it should find support for a bounce in red wave d higher. Otherwise, in case of breaking below 56.87 level, the triangle pattern in wave (IV) will need a reevaluation.

As an outlook, decline towards 66.07-56.87 area signifies the medium term Rouble strength. However, long term favors still the dominance of the Dollar over the currency of the Russian federation. Indeed, the larger cycle from 2008 looks still incomplete and 85.94 highs should still be reached in a longer run.

Rouble Elliott Wave Daily

Source: https://elliottwave-forecast.com/forex/russian-rouble-shows-strength/
 

Elliottwave-Forecast

Master Trader
Feb 17, 2017
2,462
9
84
www.elliottwave-forecast.com
Hello fellow traders. In this technical blog we’re going to take a quick look at the Elliott Wave charts of OIL, published in members area of the website. As our members know, OIL is another instrument that we have been trading lately. The price is showing bullish sequences in the cycle from the April 21st low . The price structure of OIL has been calling for further rally. Consequently, we advised members to avoid selling OIL and keep on buying the dips in the sequences of 3,7,or 11 swings whenever get chance. In further text we’re going to explain Elliott Wave Forecast and trading strategy.

OIL 1 Hour Elliott Wave Analysis 12.01.2020​

Wave (2) blue pull back is unfolding as Elliott Wave Zig Zag and still looks incomplete at the moment. The price is reaching equal legs area at 44.08-43.02 area . As our members know, Blue Boxes are no enemy areas , giving us 85% chance to get a bounce. We don’t recommend selling it against the main trend and favor the long side from the marked blue box area. As the main trend is bullish, we expect to see 3 waves bounce at least from the mentioned zone. As soon as the price reach 50 Fibonacci Retracement against the B red peak, we should make long positions Risk Free ( put SL at BE).

You can learn more about Zig Zag Elliott Wave Patterns at our Free Elliott Wave Educational Web Page.

OIL

OIL 1 Hour Elliott Wave Analysis 12.03.2020​

OIL found buyers at 44.08-43.02 area , the Blue Box area. We got nice rally from there, when wave (2) pull back completed at 43.92 low. All longs from the blue box should be risk free at this stage. We would like to see further rally which will break (1) blue peak (11/25 ). Once proposed break happens we will get confirmation next leg up is in progress. We don’t recommend selling it, and favor staying long from the blue box in risk free positions.

OIL

OIL1 Hour Elliott Wave Analysis 12.05.2020​

Eventually we got more upside and break above 11/25 peak which confirmed next leg up is in progress. Another short term leg up is possible to complete 5 waves up from the 43.92 low before we get pull back ((ii)) black. The commodity should ideally remain bullish against the 43.92 low in first degree and found buyers in 3,7,11 swings in wave ((ii)) pull back.

You can check most recent charts in the membership area of the site. Keep in mind not every chart is trading recommendation. The best instruments to trade are those having incomplete bullish or bearish swings sequences. We put them in Sequence Report and best among them are shown in the Live Trading Room.

OIL

Source: https://elliottwave-forecast.com/trading/oil-cl_f-buying-the-dips-at-the-blue-box-area/
Elliott Wave Forecast
 

Elliottwave-Forecast

Master Trader
Feb 17, 2017
2,462
9
84
www.elliottwave-forecast.com
In this article we are going to review and analyze The Elliot's Wave structure of the shares of Advanced Micro Devices Inc in the last days of November. Here's the 1-hour AMD chart presented to our members on November 24th. After finishing a cycle as wave (2) at 77.56, we could see 5 waves up as wave 1 in red, then a zig-zag correction and another 5 waves up as wave ((i)). Thus, we looked for a movement to correct the cycle of wave ((i)) as simple as (a) (b) (c) correction to develop a wave ((ii)).

AMD Nov 24

AMD Zig-Zag and Rally

This is the chart of November 30 where we can see that the wave ((ii)) we were looking for performed a zig-zag Elliott wave correction, to have more information on Elliott Theory can visit the following link: Elliott's Wave Theory. The market bounced back at 83.30 and continued with the uptrend following the right side of the market. We could see 5 waves developing an impulse as wave (i) and then a zig-zag correction as wave (ii). From here, the stock rally again and we are expecting more upside to complete wave (iii) and small correction as (iv) and one more high to complete a cycle from 83.30 level.

AMD Nov 30

Source: https://elliottwave-forecast.com/stock-market/amd-correction-rally/
 

Elliottwave-Forecast

Master Trader
Feb 17, 2017
2,462
9
84
www.elliottwave-forecast.com
$FXB British Pound ETF Elliott Wave & Longer Term Cycles

Firstly the British Pound Sterling tracking ETF fund FXB inception date was 6/21/2006. The bearish cycle lower from the November 2007 highs in FXB is the focus of this analysis. The British Pound Sterling has been the currency of the Bank of England since 1694. Considering that date was back before there was a US Dollar to compare with and data readily available suggests price was at 2.6440 in 1972. Thus I assume the trend remains down with an incomplete bearish sequence. Spot price in the GBPUSD foreign exchange was 1.0520 in 1995. Price was at 2.1161 in 2007 where it peaked and turned lower. This is where we will shift the focus to the FXB highs at 211.44 in November 2007.

Secondly the bearish cycle from the November 2007 into the January 2009 lows was clearly an Elliott Wave impulse in 5 waves. From there into the wave (II) August 2009 high appeared to be three waves. From there into the May 2010 lows appeared best as an impulse wave I. From there into the July 2014 highs appeared to be a flat wave II. The analysis continues below the monthly chart.


Thirdly the turn lower from the July 2014 highs appears to be an impulse lower into the January 2017 lows that ended wave III. Price appeared to print a double three into the April 2018 wave IV highs. From there it appears a wave V of (III) completed in March 2020.

In conclusion : The instrument is currently correcting the cycle from the August 2009 highs. While above the September 2020 lows it can see the 142.10 area. Afterward the instrument can see some further weakness toward the 90 area before at least a larger degree bounce higher toward 170 to 180 if not back above the November 2007 highs.

Source: https://elliottwave-forecast.com/stock-market/fxb-british-pound-etf-elliott-wave-longer-term-cycles/
 

Elliottwave-Forecast

Master Trader
Feb 17, 2017
2,462
9
84
www.elliottwave-forecast.com
The news that Covid-19 vaccines will soon be available to fight the pandemic has boosted the global oil markets. Demand has plummeted since the start of the pandemic. Organization of the Petroleum Exporting Countries (OPEC) projects 2020 oil demand to be 9.8 million bpd (barrels per day) lower than 2019. In 2020, OPEC cut production by nearly 10 million bpd while non-OPEC oil supply contracts by 2.5 million bpd. This cut has helped stabilize the commodity's price after the brief dip to negative price in futures contract earlier this year.

Looking at the coming year, global oil demand can start to recover in 2021 once the pandemic ends. In OPEC's Monthly Oil Market report, it projects demand to recover by 6.2 million bpd in 2021. Hence there's market expectation that OPEC members and Russia would start to raise the production capacity again. In last week's OPEC meeting, OPEC+ producers agreed to raise output by 500,000 barrels per day. This increase was smaller than expected as there was a concern they could raise by 2 million bpd. The cautious output increase is likely justified as it may take time to vaccinate a large portion of the population. Demand therefore may not bounce substantially until the second half of next year.

Oil (CL) Daily Elliott Wave Chart​

Oil Elliott Wave chart

Oil Daily Elliott Wave chart above shows a higher high bullish sequence from April 22 low. The rally can either unfold as a 5 waves impulse or at least an ABC zigzag. Either way, the ideal minimum target for the third swing is a 100% extension to the first swing. That target area comes at 52.35 - 56.68. Dips therefore should continue to find support in 3, 7, or 11 swing against 33.81 in the first degree.

Source: https://elliottwave-forecast.com/commodities/post-pandemic-future-demand-recovery-supports-oil/
 

Elliottwave-Forecast

Master Trader
Feb 17, 2017
2,462
9
84
www.elliottwave-forecast.com
In this technical blog, we are going to take a look at the past performance of 1 hour Elliott Wave Charts of XLV. In which, the rally from 30 October 2020 lows, showed the higher high sequence in an impulse structure favored more strength to take place. Also, the right side tag pointed higher & favored more strength. Therefore, we advised our members to buy the dips in XLV in 3, 7, or 11 swings at the blue box areas. We will explain the structure & forecast below:

XLV 1 Hour Elliott Wave Chart​

XLV Ended Elliott Wave Zigzag Correction & Bouncing

Above is the 1 hour Elliott wave chart of XLV from the 11/20/2020 Midday update. In which, the rally from 10/30/2020 low unfolded as an impulse sequence & ended wave (1) at $114.50 high. Down from there, the ETF made a 3 swings pullback to correct that cycle in wave (2). The internals of that pullback unfolded as Elliott wave zigzag structure where wave A ended at $110.07 low. Wave B bounce ended at $113.86 high as a lesser degree flat structure. Below from there, wave C unfolded as another 5 wave structure & managed to reach the 100$-161.8% Fibonacci extension area of A-B at $109.36-$106.56 blue box area. From where buyers were expected to appear looking for more upside or for a 3 wave bounce at least.

XLV 1 Hour Elliott Wave Chart​

XLV Ended Elliott Wave Zigzag Correction & Bouncing

Here's the Latest 1 hour Elliott wave chart of XLV from 12/09/2020 Post-Market update. Showing reaction higher taking place from the blue box area. Allowed longs to get into a risk-free position shortly after the long positions at $109.36-$106.56 blue box area. However, a break above the previous wave (1) high ($114.50) still needed to confirm the next extension higher & avoid double correction lower.

Source: https://elliottwave-forecast.com/stock-market/xlv-ended-elliott-wave-zigzag-correction/
 

Elliottwave-Forecast

Master Trader
Feb 17, 2017
2,462
9
84
www.elliottwave-forecast.com
Elliottwave-Forecast.com (EWF) approach to forecasting is unique compared to other services / wavers. Through years of experience, we have developed tools in addition to Elliott Wave to improve the forecasting accuracy. One of the chief complains with Elliott Wave is that the theory provides at least 1 if not more alternative count. The technique is flexible enough to allow multiple paths especially in the short term.

We therefore stress to our members the importance of understanding the right side. The right side is very important to know because the short term paths can vary in 1 more more ways. Despite the possible variation, Elliott Wave is still very useful to traders. We can use the math analogy. There are several ways to sum two numbers in order to get the result 10. For example, we can have 1+9, or 2+8, or 3+7, or 4+6, or 5+5, or 6+4, or 7+3, or 8+2, or 9+1. We can see here we can have 9 different ways/paths to get into number 10. The end result is the same, but the means to get there can vary. We can look at the market in the same way. Think of number 10 as the right side of the market. Then think of the various summation possibilities as the different short term paths available.

Determining the right side of the market is easier than figuring out the exact short term path to get there. We can never know 100% the short term path, but we at EWF develop our proprietary tools of 3, 7, 11 swing. Regardless which short term path it takes, a corrective structure always unfolds in 3, 7, or 11 swing. Thus, when the right side is bullish, we tell members to only look to buy dips at the extreme area in 3, 7, or 11 swing. Conversely, when the right side is bearish, we tell members to only look to sell rallies at the extreme area in 3, 7, or 11 swing.

We understand Elliott Wave can offer 1 or more alternative counts. However, if we can eliminate some of these alternate counts, we can end up with smaller universe of possibilities, and therefore improve our forecasting accuracy. One tool we develop for this purpose is the correlation. Many wavers only follow small number of markets. They only try to label a market in isolation. At EWF, our philosophy is that the market is 1 single entity. Therefore, the more market we follow, the more we understand it. Let's take a look at an example of correlation below

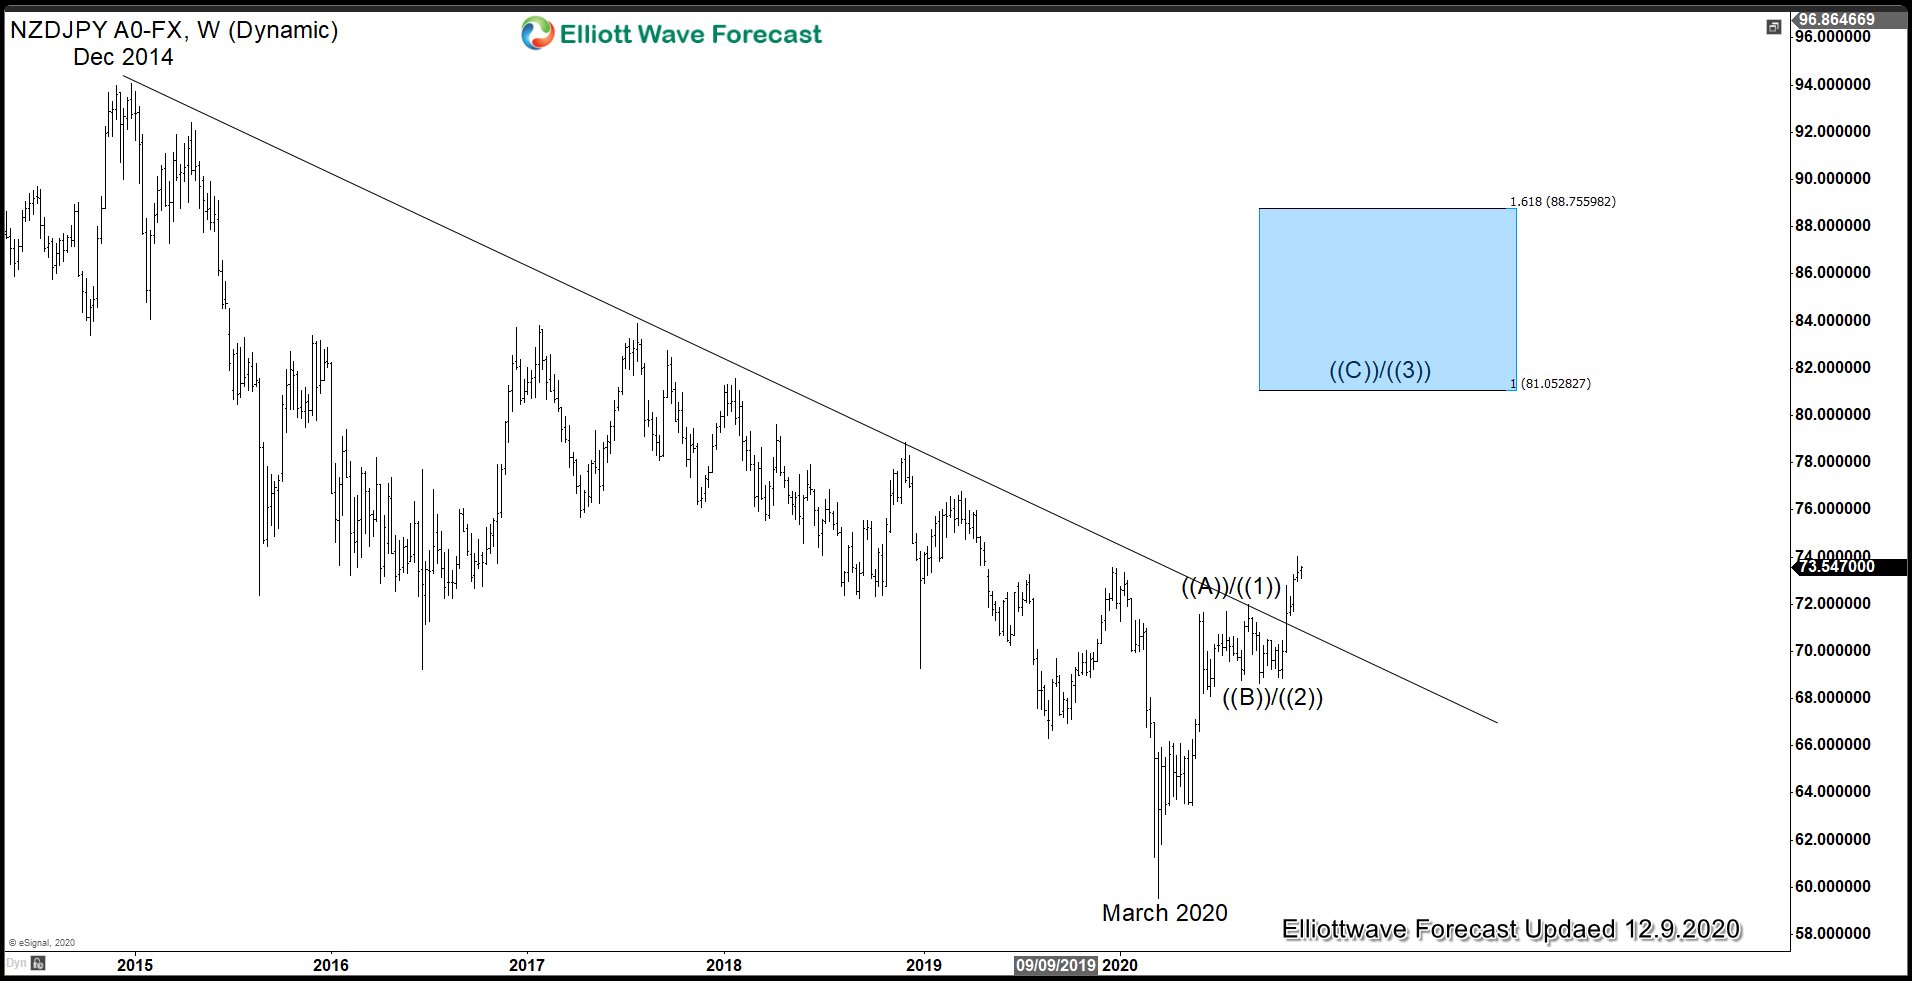
NZDJPY Weekly Elliott Wave​


NZDJPY is the first pair in our 72 instrument which gives us very valuable information for the rest of Yen group. As the weekly chart above shows, it's the first pair to break above the long term bearish channel from December 2014 high. It's also the first Yen pairs to create a bullish sequence (a sequence of higher high) from March 2020 low. We can see that pair created a connector in wave ((A))/((1)) and ((B))/((2)) from March 2020 low. It tells us that NZDJPY should continue to stay supported until pair reaches the blue box. We know what the right side is for the NZDJPY.

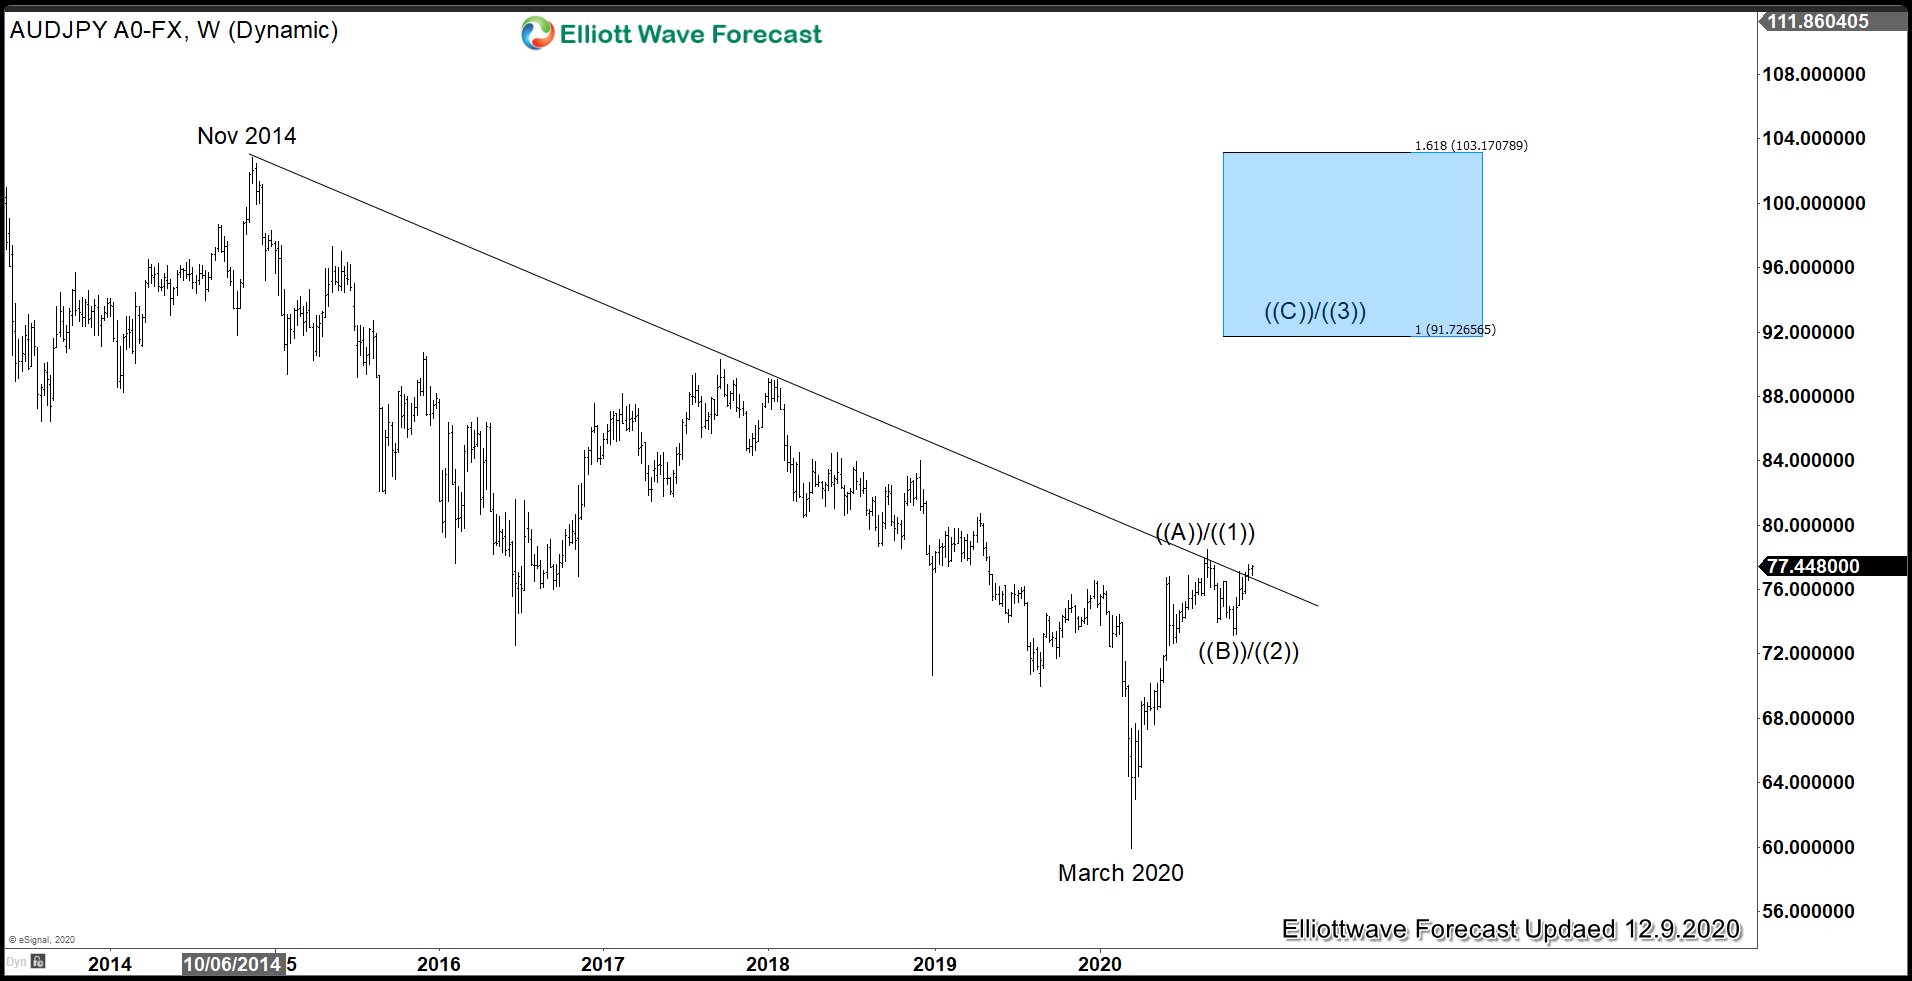
AUDJPY Weekly Elliott Wave​


Unlike AUDJPY, the pair has not created a bullish sequence, and it has not fully broken above the bearish channel from November 2014 high. If we only trade and analyze AUDJPY in isolation, we still can't conclude the right side of the market. The reason is because unless the pair breaks above wave ((A))/((1)), we still technically can't rule out a double correction. However, it's at this stage where correlation can help. Knowing that NZDJPY has already created a bullish sequence and broken above the long term bearish channel, we can conclude the right side of AUDJPY should be to the upside as well. Therefore we can make the more aggressive count even before the confirmation of a break above wave ((A))/((1)).

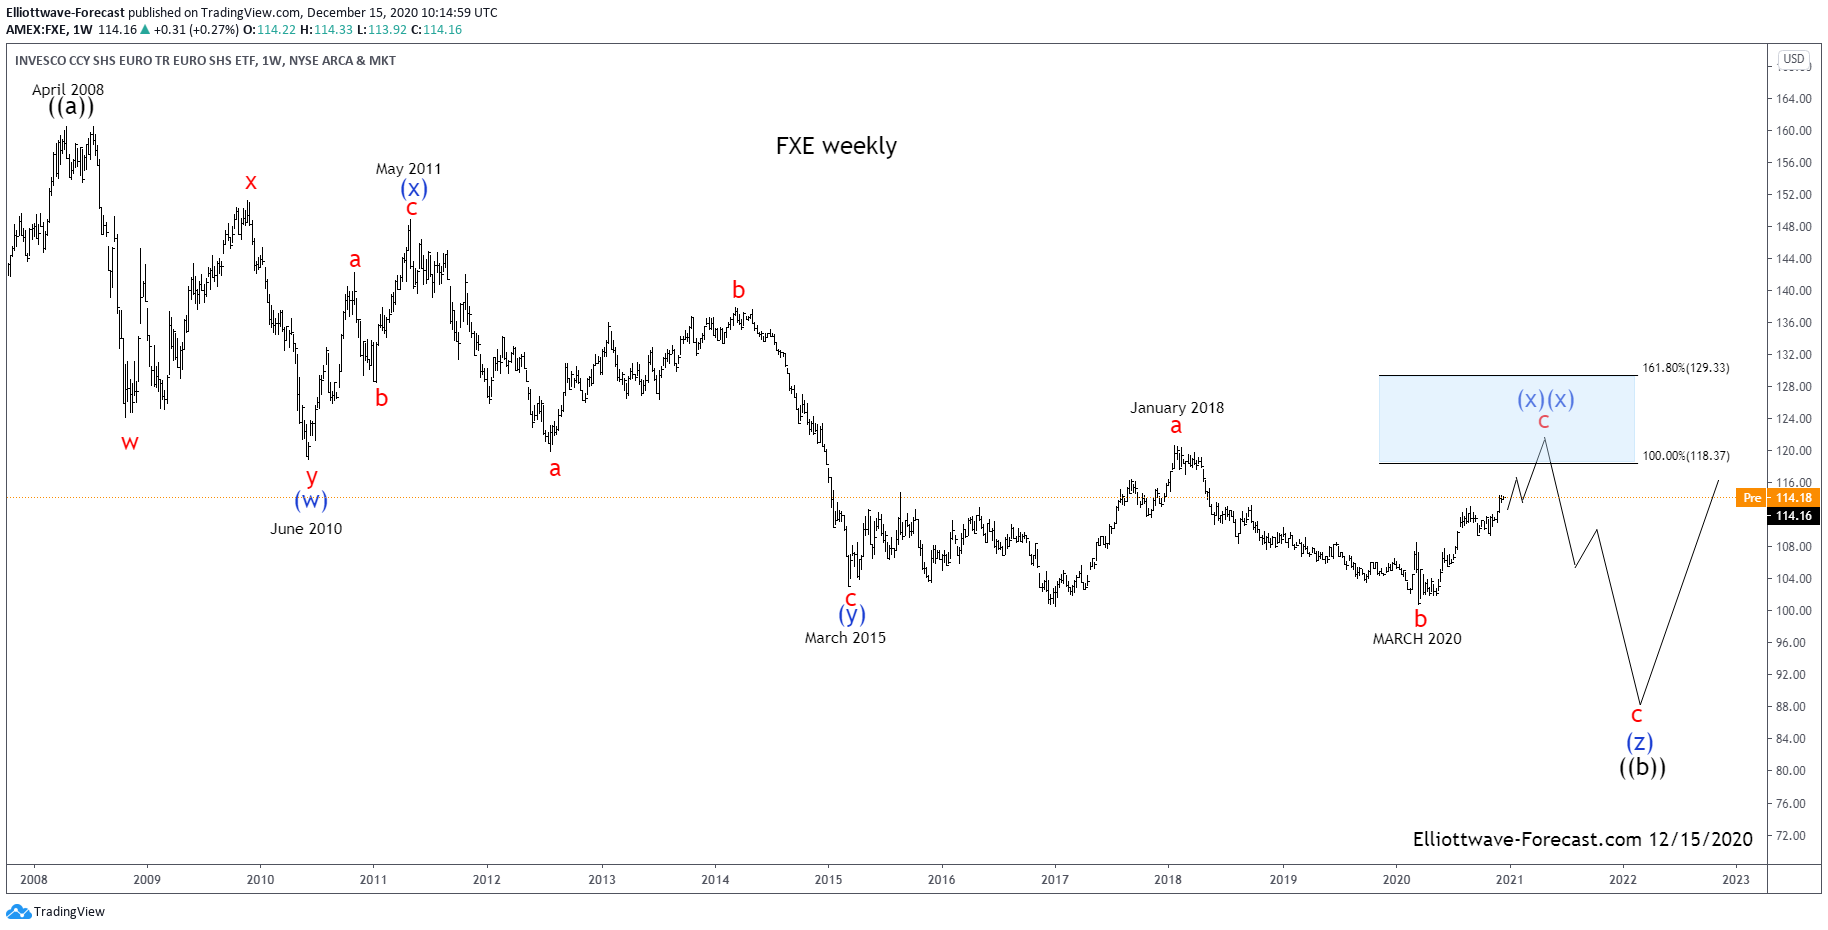
EURJPY Weekly Elliott Wave​

EURJPY correlation with NZDJPY implies more upside

In a similar way, EURJPY has not created a bullish sequence and it has barely broken above the bearish trend line from December 2014 high. However, in the same way, knowing the NZDJPY right side helps us to eliminate a double correction possibility in wave (B)/(2). We can better forecast Yen pairs as a group because we see the group as a whole and not just in individual isolation.

Source: https://elliottwave-forecast.com/forex/nzdjpy-leading-yen-pairs-higher/
 

Elliottwave-Forecast

Master Trader
Feb 17, 2017
2,462
9
84
www.elliottwave-forecast.com
In this technical blog we’re going to take a quick look at the Elliott Wave charts of Wheat Future TESLA, published in members area of the website. As our members know, TESLA is another instrument that we have been trading lately. The stock is showing impulsive sequences in the cycle from the October low (379.67) . The price structure of Tesla has been calling for further rally. Consequently, we advised members to avoid selling the stock and keep on buying the dips in the sequences of 3,7,or 11 swings whenever get chance. In further text we’re going to explain Elliott Wave Forecast and trading strategy.

Tesla 1 Hour Elliott Wave Analysis 10.02.2020​

Current view suggests the stock is bullish against the 401.57 pivot . As of right now we are getting wave 4 red pull back. The pull back looks incomplete at the moment. suggesting we can see another leg down toward 545.88-512.72 equal legs area (buyers zone). We do not like selling in any proposed pull back and favor the long side from the marked blue box area. As the main trend is bullish, we expect to see 3 waves bounce at least from the mentioned zone. Once the price reach 50 Fibonacci Retracement against the((b)) black peak, we should make long positions Risk Free ( put SL at BE).

As our members know, Blue Boxes are no enemy areas , giving us 85% chance to get a bounce.

You can learn more about Elliott Wave Patterns at our Free Elliott Wave Educational Web Page.

TESLA

Tesla 1 Hour Elliott Wave Analysis 12.02.2020​

Tesla made leg down toward blue box area. The stock buyers at 545.88-512.72 ,as we expected. We got bounce from the area and call wave 4 red pull back completed. However we need to see furhter separation higher , ideally break above 3 red peak to confirm next leg up is in progress. As soon as the price reach 50 Fibonacci Retracement against the((b)) black peak, we will make long positions Risk Free ( put SL at BE).

TESLA


Tesla 1 Hour Elliott Wave Analysis 12.07.2020​

Eventually Tesla made break above 3 red peak. The price confirmed next leg up is in progress .All longs from the blue box should be risk free at this stage. As far as the pivot at 541.07 pivot holds , we expect the stock to keep trading higher within wave 5 red as shown on the charts. We don’t recommend selling it, and favor staying long from the blue box in risk free positions.

You can check most recent charts in the membership area of the site. Keep in mind not every chart is trading recommendation. The best instruments to trade are those having incomplete bullish or bearish swings sequences. We put them in Sequence Report and best among them are shown in the Live Trading Room.

Tesla

Source: https://elliottwave-forecast.com/trading/tesla-tsla-buying-blue-box/
Elliott Wave Forecast
 

Elliottwave-Forecast

Master Trader
Feb 17, 2017
2,462
9
84
www.elliottwave-forecast.com
The Santa Claus rally is a capital market phenomenon that happens from December 28 to January 2 of the following year. It named in 1972 by Yale Hirsc who noticed an unusual upward movement in the market in that period of time. This event is so recurrent for years that it earned its own name "The Santa Claus Rally." According to the 2016 Stock Trader Almanac, since 1896 the Dow Jones gained an average of 1.7% during this period obtaining a positive return 77% of the time.

However, since the 90s the Santa Claus rally has not been the same. It has had some ups and downs lacking the mythical "phenomenon"; but in the end, the history or culture ends up winning, the last statistics are put aside when people are going out to invest in the last week of the year.

NETFLIX in Santa’s Rally

Netflix is one of the companies that in the last ten years outperforms the stock market in the last week of the year and we are going to analyze it based on Elliott Wave Theory.

So far in December the performance has been positive and according to the following Elliott count where we have a double WXY correction that ends in equal legs in the daily chart, Netflix should continue with the upward movement (For more information on what is a double correction for please visit this link: Elliott Wave Theory). But let's remember what we are measuring in this article is the performance of the stock in the last week of December and anything can happen before we see the Santa Rally appear or not this year.

Santa Claus Rally Netflix Elliott Wave Structure possibility 1

For the next 15 days, Netflix's structure could change and go to a double correction where Y wave could extend further downward in a zig-zag structure, but for that we need to break the 458.25 level to have a clearer picture and know whether it is worth investing in Santa's Rally.

Santa Claus Rally Netflix Elliott Wave Structure possibility 2

Source: https://elliottwave-forecast.com/stock-market/will-santa-claus-rally-2020/
 

Elliottwave-Forecast

Master Trader
Feb 17, 2017
2,462
9
84
www.elliottwave-forecast.com
On December 9 2020 I posted on social media @AidanFX "GBPCAD watch for selling opportunities."

The charts below were also posted on social media @AidanFX December 9 2020 showing the possible bearish patterns. Blue bearish pattern triggered SELLS at the XA 1.27% Fib. retracement level and the brown AB=CD bearish pattern also triggered SELLS in the same area at the Fib. extension 1.0% level. Both these levels triggered sellers in a strong bearish confluence area where the SELL levels were met with a support/resistance zone (light blue) and dynamic resistance of the 200 moving average (dark blue). Also to add more reason the pair could push lower a bearish divergence pattern (pink) also formed in the same confluence area. I called for the pair to push lower and advised traders to watch for selling opportunities.

GBPCAD 1 Hour Chart December 9 2020

GBPCAD, forex, market patterns, elliottwave, trading, @AidanFX, AidanFX

GBPCAD 1 Hour Chart December 9/2020 (1st SELL Entry)

After a minor pullback, I posted the first SELL trade at 1.7165 (green) with stops at 1.7225 expecting for green targets to hit on the possible move lower. I also advised traders to look for the second SELL entry if price breaks below the 1.7111 level (light blue) and if the bottom momentum indicator breaks below the 100 level.

GBPCAD, forex, market patterns, elliottwave, trading, @AidanFX, AidanFX

GBPCAD 1 Hour Chart December 9/2020 (2nd SELL Entry)

Price breaks below 1.7111 level and indicator breaks below 100 level. Second SELL entry triggered.

GBPCAD, forex, market patterns, elliottwave, trading, @AidanFX, AidanFX

GBPCAD eventually moves lower and on December 10 2020 price hits the 1st SELL entry (green) 1:4 RR target at 1.6925 from 1.7165 for +240 pips and also hit the 2nd SELL entry (light blue) 1:2 RR target at 1.6880 from 1.7111 for +231 pips for a combined +471 pips. If you followed me on social media @AidanFX you too could have caught the GBPCAD move lower. We at EWF never say we are always right. No market service provider can forecast markets with 100% accuracy. Only thing we at EWF 100%, is that we are RIGHT more than we are WRONG.

GBPCAD 1 Hour Chart December 10/2020

GBPCAD, forex, market patterns, elliottwave, trading, @AidanFX, AidanFX

Of course, like any strategy/technique, there will be times when the strategy/technique fails so proper money/risk management should always be used on every trade. Hope you enjoyed this article and follow me on social media for updates and questions> @AidanFX

At Elliottwave-Forecast we cover 78 instruments (Forex, Commodities, Indices, Stocks and ETFs) in 4 different time frames and we offer 5 Live Session Webinars everyday. We do Daily Technical Videos, Elliott Wave Trade Setup Videos and we have a 24 Chat Room. Our clients are always in the loop for the next market move.

Source: https://elliottwave-forecast.com/aidans-corner/gbpcad-bearish-patterns-signalling-move-lower/
 

Elliottwave-Forecast

Master Trader
Feb 17, 2017
2,462
9
84
www.elliottwave-forecast.com
Uranium Participation Corporation (UPC) is a holding company which invests its assets long-term in the uranium, both in form of uranium oxide and uranium hexafluoride. Founded in 2005, UPC has its headquarters in Toronto, Canada. One can trade it under the ticker $U at the Toronto Stock Exchange. Investors in shares of UPC possess, therefore, an indirect interest in physical uranium owned by UPC. Currently, we see the ongoing price appreciation within the energy commodities like oil, gas, coal and others. Consequently, uranium is expected to turn higher after 13 years of weak prices as well. Besides the market correlation, the pattern of UPC supports the bullish view. Therefore, investors in the energy sector obtain a high reward diversification opportunity by investing in an uranium pure player UPC .

Uranium Participation Corporation Monthly Elliott Wave Analysis 12.14.2020​

The monthly chart below shows the UPC shares $U traded at Toronto Stock Exchange. First, the stock price has developed a cycle higher in black wave ((I)) of grand super cycle degree. It has printed the all-time highs on April 2007 at 18.76. From the highs, a correction lower in black wave ((II)) has unfolded as an Elliott wave zigzag pattern. It has printed an important bottom on March 2020 at 3.12.

From March 2020 lows, a new cycle in wave ((III)) has already started and should extend towards 18.76 highs and beyond. Then, the target for wave ((III)) will be towards 21.85-33.43 area and even higher.

Uranium Elliott Wave Monthly

Uranium Participation Corporation Daily Elliott Wave Analysis 12.14.2020​

The Daily chart below shows the $U shares price action in more detail. From the March 2020 lows at 3.12, the stock price has advanced in the wave ((1)) of the red wave I towards 5.35 highs on May 2020. From there, a pullback in wave ((2)) has unfolded as an expanded flat (A)-(B)-(C) towards 3.93 lows in October 2020. To be noted, expanded flats are 3-3-5 structures where waves (B) produce a new high above the top of the previous cycle. Indeed, the blue wave (B) of black wave ((2)) has exceeded the wave ((1)) highs by printing a new high at 5.39.

From the 3.93 lows, a new cycle in wave ((3)) of I has started. It can bring the prices towards 6.16-7.54 area and even higher. At current price levels, investors in uranium prices have a good opportunity to enter the market with a great potential to the upside.

Uranium Elliott Wave Daily

Source: https://elliottwave-forecast.com/commodities/uranium-participation-ramping/
 

Elliottwave-Forecast

Master Trader
Feb 17, 2017
2,462
9
84
www.elliottwave-forecast.com
$FXE Long Term Cycle and Elliott Wave

Firstly as seen on the weekly chart shown below the instrument made a high in April 2008. There is data back to December 2005 in the ETF fund. Data correlated in the EURUSD foreign exchange pair suggests the high in April 2008 was the end of a cycle up from the all time lows. EURUSD data shows the pair had a five wave up move from the early 1970’s era. This data is derived from the German Mark currency against the US Dollar that preceded the inception of the Euro currency.

As you can see the FXE instrument reflects the price swings of the single currency well. As previously mentioned the instrument made a high in April 2008. This where the analysis begins on the weekly chart shown below. The correction from those highs appears to be a an Elliott Wave triple three structure correction. The analysis continues below the weekly chart.


Secondly as mentioned the decline from the April 2008 highs appears to be an Elliott Wave triple three structure. The cycle lower from there does not count well as an impulse although there is a such thing as a diagonal that subdivides in five three swing moves in the direction of that cycle. When a cycle ends against a trend it will show in momentum indicators usually before price makes it obvious. These cycle highs and lows are in the blue color as shown on the chart above (w)-(x)-(y)-(xx) & potential (z) to come later.

Lastly in conclusion as said the structure lower from the 2008 highs appears to be a triple three Elliott Wave structure. The instrument currently appears ended a cycle lower from the January 2018 highs in March 2020. It can further develop a bounce higher to correct the cycle from the May 2011 highs while above the March lows. It should reach the blue highlighted inflection area before turning lower again for one more long term low.

Source: https://elliottwave-forecast.com/stock-market/fxe-long-term-cycle-and-elliott-wave/