
Elliott Wave Analysis by EWF
- Thread starter Elliottwave-Forecast
- Start date
- Watchers 30
You are using an out of date browser. It may not display this or other websites correctly.
You should upgrade or use an alternative browser.
You should upgrade or use an alternative browser.
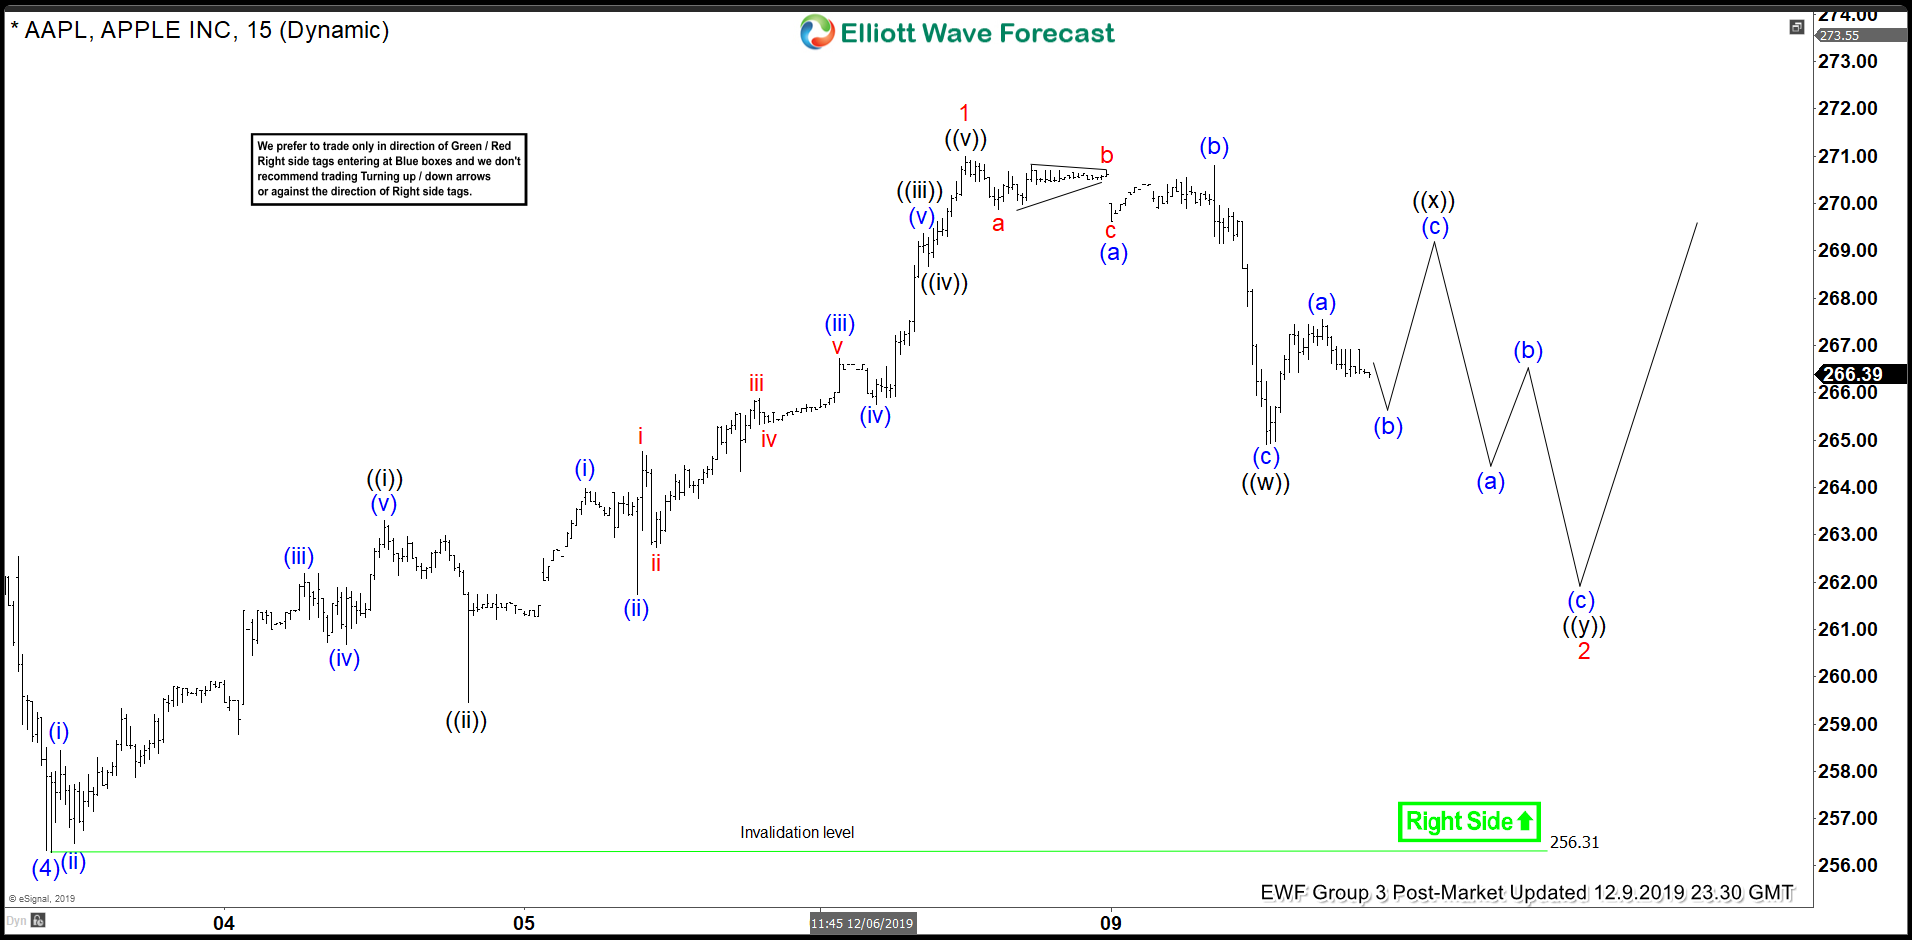
Short-term Elliott Wave view in Apple (ticker: AAPL) suggests that the pullback to 256.31 on December 3, 2019 low ended wave (4). The stock has resumed higher within wave (5) and the internal is unfolding as a 5 waves Elliott Wave structure. Up from 256.31, wave ((i)) ended at 263.31, and wave ((ii) pullback ended at 259.45. The stock extended higher in wave ((iii)) towards 269.36 and pullback in wave ((iv)) ended at 268.66. Finally, the stock made the last wave ((v)) higher to 271 before ending wave 1 of (5).
The stock is now correcting cycle from December 3, 2019 low within wave 2 before the rally resumes. Pullback is unfolding as a double zigzag structure where wave ((w)) ended at 264.91. Expect wave ((x)) bounce to fail below 271 before another turn lower in wave ((y)) of 2. Then as far as pivot at 256.31 low stays intact, expect Apple to extend higher again. We don't like selling the stock. If stock instead breaks above 271, then wave 2 would have ended at 264.91 and in this case, the stock has resumed higher in wave 3 of (5).
Apple (AAPL) 1 Hour Elliott Wave Chart
Short-term Elliott Wave view in Copper (HG_F) suggests that the metal is rallying as a 5 waves Elliott wave impulsive structure from November 15, 2019 low. Up from there, wave ((i)) ended at 2.69, and wave ((ii) pullback ended at 2.619. Subdivision of wave ((ii)) unfolded as a double zigzag. Wave (w) of ((ii)) ended at 2.653, wave (x) of ((ii)) ended at 2.679, and wave (y) of ((ii)) ended at 2.619. The metal has resumed higher in a powerful wave ((iii)) with more than 161.8% extension of wave ((i)). Up from 2.619, wave (i) of ((iii)) ended at 2.676, wave (ii) of ((iii)) ended at 2.676 and wave (iii) of ((iii)) is proposed complete at 2.77.
Expect the metal to continue to extend higher to end wave ((iii)) as 5 waves up from 2.619 low. Afterwards, it should correct the cycle from December 4, 2019 low (2.619) before the rally resumes again. We don't like selling Copper. We expect dips to continue to find support in the sequence of 3, 7, or 11 swing for further upside. This view is valid as far as pivot at 2.619 low stays intact.
Copper 1 Hour Elliott Wave Chart

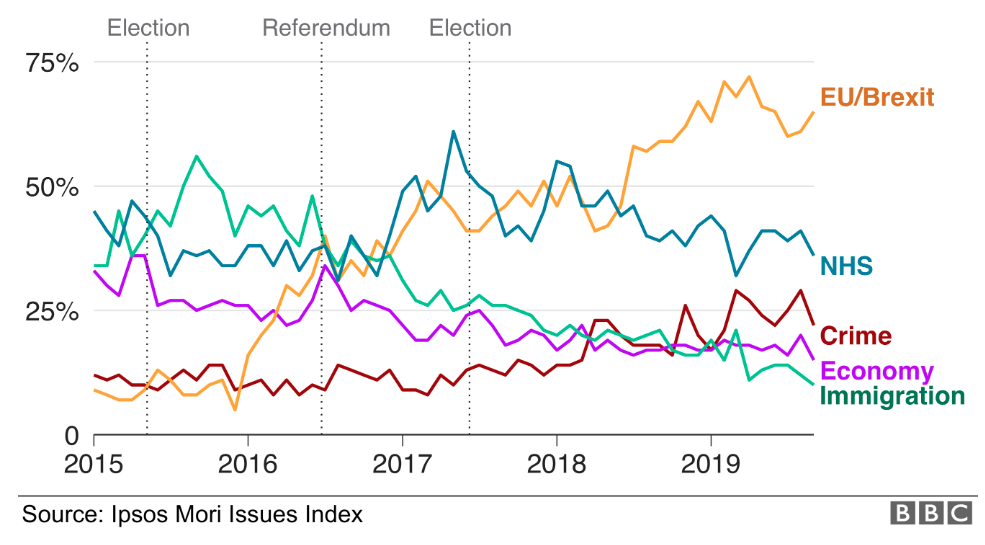
Pound Sterling remains strong as the U.K. will go to poll this coming Thursday December 12. The general election normally should be held every five years. However, this election will be the third time since 2015 as it's necessary to break the country's Brexit impasse. It will determine whether the U.K. will quit the European Union after more than 3 years after the EU referendum. Every election usually has different issues. For this coming snap election, the prominent issue is how and whether the U.K. should pursue Brexit.
2019 Election - Brexit Dominates as Major Issue

The incumbent Conservative party (Tories) and main opposition Labour party have presented a radically different solution. Prime Minister Boris Johnson from Conservative Party pledges to deliver Brexit by the end of January if he wins a majority. Labour party leader Jeremy Corbyn on the other hand would like to renegotiate the divorce deal with EU and hold second referendum on revised agreement within six months. In addition, he would provide an option to remain within the EU.
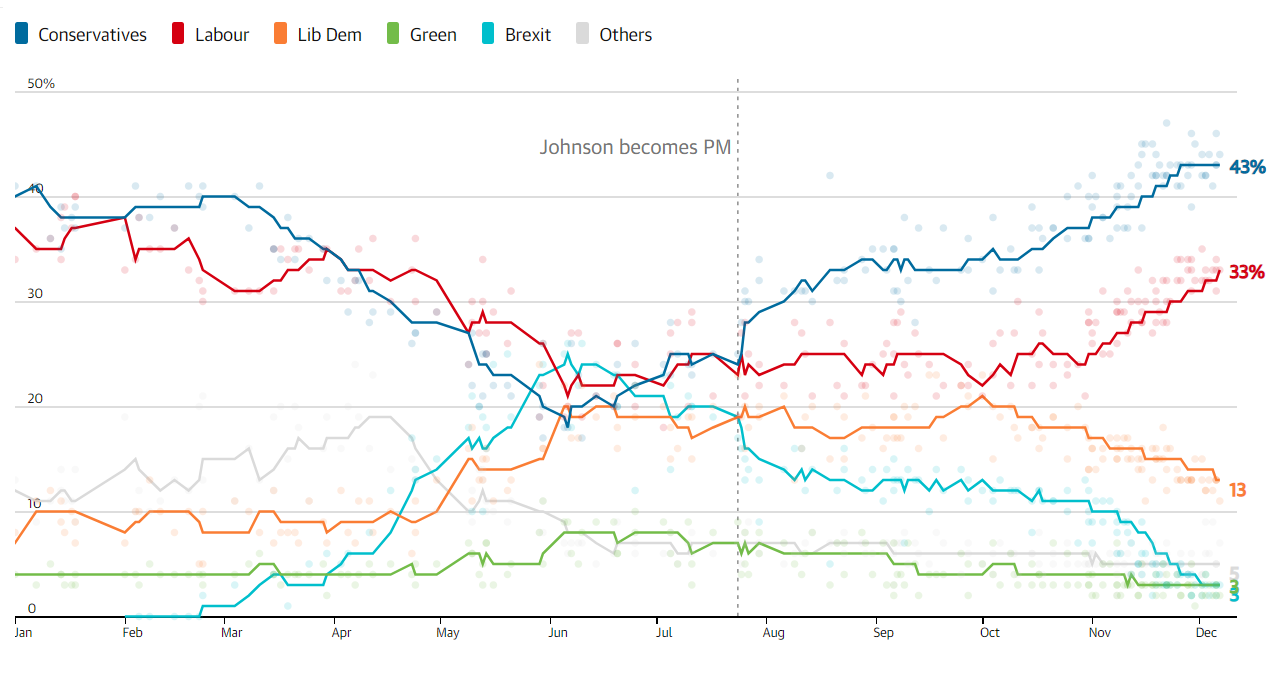
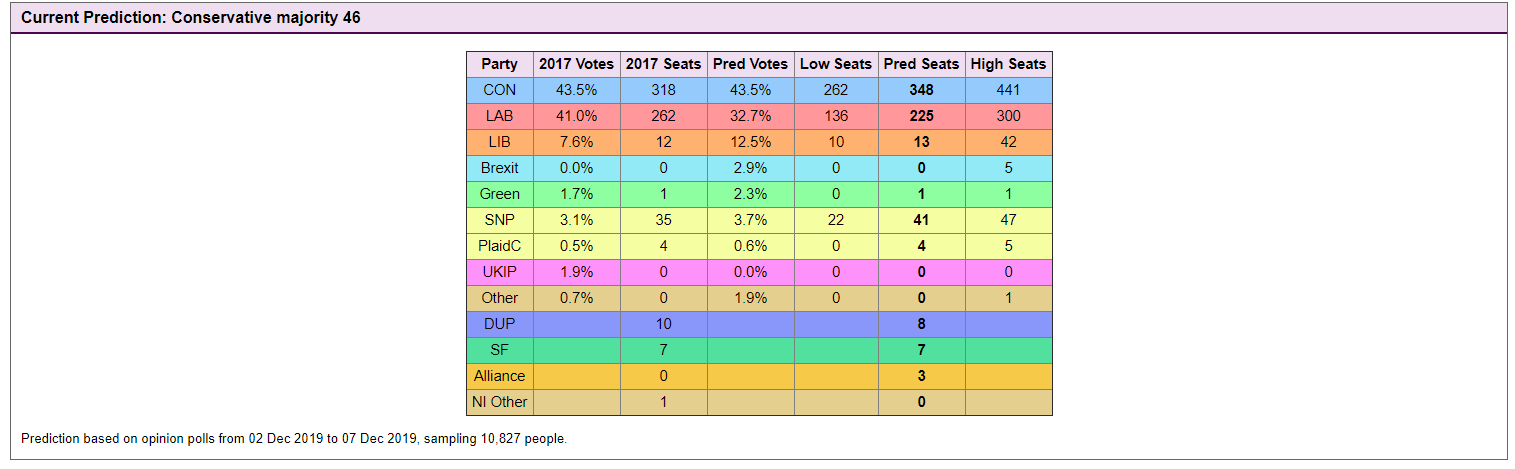
Latest UK Election Poll Shows Tories Maintain Lead over Labour

The chart above is a tracker by UK newspaper Guardian based on various UK-wide polls by reputable pollsters. Based on the tracker, the Tories are leading with 43% ahead of Labour on 33%. Compared this with 2017 election where Tories achieved 42.4% while Labour got 40%. Thus although Conservatives position is stable, Labour's relative position today is worse. Electoral Calculus, one of the popular public predictive models, predicts a Conservative majority with the current polls.

Brexit creates a lot of uncertainties in the U.K.'s future, hurting the UK economy and Pound Sterling. The UK faces the risk of recession in case it withdraws from the EU without a deal. A majority win to the Conservative party can remove this uncertainty. It can also boost Pound Sterling which has been battered in the past 3.5 years.
Pound Sterling Remains Strong Against Australian Dollar - GBPAUD Bullish Weekly Elliott Wave Sequence

Pound Sterling has maintained strength against all major currencies. Above is the chart of Pound Sterling against Australian Dollar which is near 3 year high. The Elliott Wave sequence from October 2016 low remains bullish with 100% target towards 2.00 - 2.07. Near term, it has reached 100% from December 3, 2018 so it may pullback first in wave ((X)) to correct cycle from December 3 low. However, it's not a sell due to the bullish sequence as pair can also extend higher directly to the blue box.
2019 Election - Brexit Dominates as Major Issue
The incumbent Conservative party (Tories) and main opposition Labour party have presented a radically different solution. Prime Minister Boris Johnson from Conservative Party pledges to deliver Brexit by the end of January if he wins a majority. Labour party leader Jeremy Corbyn on the other hand would like to renegotiate the divorce deal with EU and hold second referendum on revised agreement within six months. In addition, he would provide an option to remain within the EU.
Latest UK Election Poll Shows Tories Maintain Lead over Labour
The chart above is a tracker by UK newspaper Guardian based on various UK-wide polls by reputable pollsters. Based on the tracker, the Tories are leading with 43% ahead of Labour on 33%. Compared this with 2017 election where Tories achieved 42.4% while Labour got 40%. Thus although Conservatives position is stable, Labour's relative position today is worse. Electoral Calculus, one of the popular public predictive models, predicts a Conservative majority with the current polls.
Brexit creates a lot of uncertainties in the U.K.'s future, hurting the UK economy and Pound Sterling. The UK faces the risk of recession in case it withdraws from the EU without a deal. A majority win to the Conservative party can remove this uncertainty. It can also boost Pound Sterling which has been battered in the past 3.5 years.
Pound Sterling Remains Strong Against Australian Dollar - GBPAUD Bullish Weekly Elliott Wave Sequence

Pound Sterling has maintained strength against all major currencies. Above is the chart of Pound Sterling against Australian Dollar which is near 3 year high. The Elliott Wave sequence from October 2016 low remains bullish with 100% target towards 2.00 - 2.07. Near term, it has reached 100% from December 3, 2018 so it may pullback first in wave ((X)) to correct cycle from December 3 low. However, it's not a sell due to the bullish sequence as pair can also extend higher directly to the blue box.
In this technical blog, we are going to take a look at the past performance of 1 hour Elliott Wave Charts of XLV, which we presented to members at elliottwave-forecast.com. In which, the rally from December 2018 lows & October 2019 lows, showed the higher highs in an impulse sequence favored more strength to take place. Also, the right side tag pointed higher & favored more strength against $93.71 low seen on 11/05/2019. Therefore, we advised our members to buy the dips in ETF in 3, 7 or 11 swings at the blue box areas. We will explain the structure & forecast below:
XLV 1 Hour Elliott Wave Chart

XLV 1 Hour Elliott Wave Chart From 12/03/2019 Pre-Market update, in which the 3 waves pullback to $93.71 low ended wave ((ii)). Up from there, the rally takes place in 5 waves impulse structure where wave (i) ended at $95.65 high. Wave (ii) pullback ended at $94.85 low, wave (iii) ended at $97.93 high, wave (iv) ended at $97.01 low and wave (v) ended at $100.04 high thus completed wave ((iii)). Down from there, wave ((iv)) pullback was expected to take place as a lesser degree double three structure where wave (w) ended at $98.73 low. Wave (x) bounce ended at $99.35 high and wave (y) was expected to reach $98.03-$97.21 short-term 100%-161.8% Fibonacci extension area of (w)-(x). Afterwards, the ETF was expected to resume the upside or do a 3 wave reaction higher at least.
XLV 1 Hour Elliott Wave Chart

Here's 1 Hour Elliott Wave Chart of XLV from the 12/09/2019 Pre-Market update, in which the ETF managed to reach $98.03-$97.21 blue box area & reacted higher as expected. Allowed members to create a risk-free position shortly after taking the trade. Since then the ETF bounced strongly & managed to reach minimum extension area in wave ((v)) at $100.50-$101.28 i.e inverse 123.6%-161.8% of wave ((iv)). But, as far as dips remain above $98 low the ETF can extend higher towards $100.99-$102.28 areas as well before a pullback could take place. We don't recommend selling the ETF or chasing the strength at this stage.
XLV 1 Hour Elliott Wave Chart

XLV 1 Hour Elliott Wave Chart From 12/03/2019 Pre-Market update, in which the 3 waves pullback to $93.71 low ended wave ((ii)). Up from there, the rally takes place in 5 waves impulse structure where wave (i) ended at $95.65 high. Wave (ii) pullback ended at $94.85 low, wave (iii) ended at $97.93 high, wave (iv) ended at $97.01 low and wave (v) ended at $100.04 high thus completed wave ((iii)). Down from there, wave ((iv)) pullback was expected to take place as a lesser degree double three structure where wave (w) ended at $98.73 low. Wave (x) bounce ended at $99.35 high and wave (y) was expected to reach $98.03-$97.21 short-term 100%-161.8% Fibonacci extension area of (w)-(x). Afterwards, the ETF was expected to resume the upside or do a 3 wave reaction higher at least.
XLV 1 Hour Elliott Wave Chart

Here's 1 Hour Elliott Wave Chart of XLV from the 12/09/2019 Pre-Market update, in which the ETF managed to reach $98.03-$97.21 blue box area & reacted higher as expected. Allowed members to create a risk-free position shortly after taking the trade. Since then the ETF bounced strongly & managed to reach minimum extension area in wave ((v)) at $100.50-$101.28 i.e inverse 123.6%-161.8% of wave ((iv)). But, as far as dips remain above $98 low the ETF can extend higher towards $100.99-$102.28 areas as well before a pullback could take place. We don't recommend selling the ETF or chasing the strength at this stage.
PepsiCo (NASDAQ: PEP) is an American multinational food, snack, and beverage corporation offering food (brands include Frito-Lay and Quaker) and drinks, including Pepsi, Tropicana, and Gatorade.
PEP rally since May 2018 is unfolding as an impulsive Elliott Wave structure which currently can still see further upside within an extended wave (5) of of wave ((3)) and reach equal legs area $148.32 -$158.68 before a 3 waves pullback take place in wave ((4)) to correct the rally from October 2018. Then as long as pivot at $104.5 remains intact, PEP will be able to resume the rally to new all time highs to finish the 5 waves advance.
PEP Daily Chart

The alternative view would take place if the stock fails to break above October peak from current levels suggesting that wave ((3)) is already in place. Consequently PEP will end up doing a double correction and see further correction lower toward 38.2% Fibonacci retracement level at $126.7 area before ending wave ((4)) then turning higher again for another 5 waves rally.
PEP Alternative Daily Chart

Short-term Elliott Wave view in Tesla (TSLA) suggests that pullback to 327.1 on Nov 27 low ended wave (4). From there, the stock is rallying within wave (5) as a 5 waves Elliott wave impulsive structure looking for more highs. Up from 327.1, wave ((i)) ended at 338.62 as a leading diagonal structure. Wave ((ii) pullback ended at 327.31 as a zigzag structure. The stock has resumed higher and wave ((iii)) is in progress with internal subdivision as another 5 waves in a lesser degree.
Up from wave ((ii)) low at 327.31, wave (i) ended at 338.86, and wave (ii) pullback ended at 335.08. The stock then extended higher in wave (iii) towards 357.19 and wave (iv) pullback ended at 352.15. Expect the stock to extend two more highs before ending wave ((v)) of 1. Afterwards, it should pullback in wave 2 to correct cycle from November 27, 2019 low before the rally resumes. We don't like selling the proposed pullback. As far as pivot at 327.31 low stays intact, expect dips to find support in 3, 7, or 11 swing for a few more highs.
Tesla (TSLA) 1 Hour Elliott Wave Chart

Short-term Elliott Wave view in Nike (ticker: NKE) suggests that rally from May 31, 2019 low is unfolding as a 5 waves Elliott wave impulsive structure. Up from May 31, 2019 low, wave 1 (not shown on the chart below) ended at 89.87. Wave 2 pullback ended at 78.19 and stock then resumed higher in wave 3 towards 96.87. Pullback in wave 4 ended at 88.74. Stock is now in wave 5 which has an internal of 5 waves in lesser degree.
Short term chart below shows the internal subdivision for wave 5. Wave ((i)) of 5 ended at 95.12, and wave ((ii)) of 5 pullback ended at 91.31. Stock has resumed higher and expected to end wave ((iii)) of 5 soon. Afterwards, it should pullback in wave ((iv)) of 5 before the rally resumes again in wave ((v)) of 5. We don't like selling the stock and expect buyers to appear in the sequence of 3, 7, or 11 swing as far as pivot at 91.3 low stays intact. Potential target to the upside is wave 5 = 1 which comes at 101.6 - 104.6 area.
Nike (NKE) 1 Hour Elliott Wave Chart

In this technical blog we’re going to take a quick look at the Elliott Wave charts of AUDUSD published in the membership area of the elliottwave-forecast . As our members know, AUDUSD recently gave us rally within the short term cycle from the 11/29 low . We got 3 waves pull back , that unfolded as Elliott Wave Double Three Pattern. The pair reached Equal Legs – Blue Box and found buyers at that area as we expected. In further text we’re going to explain the forecast and Elliott Wave Pattern.
Before we take a look at the real market example, let’s explain Elliott Wave Double Three pattern.
Elliott Wave Double Three Pattern
Double three is one of the most common pattern in the market these days, also known as 7 swing structure. It’s a very reliable pattern which is giving us good trading entries with clearly defined invalidation levels and target areas.The picture below presents what Elliott Wave Double Three pattern looks like. It has (W),(X),(Y) labeling and 3,3,3 inner structure, which means all of these 3 legs are corrective sequences. Each (W) and (Y) are made of 3 swings , they’re having A,B,C structure in lower degree.
You can learn more about Elliott Wave Double Three Patterns at our Free Elliott Wave Educational Web Page.

AUDUSD1 Hour Elliott Wave Analysis 12.10.2019
AUDUSD is correcting the short term cycle cycle from the 22427 low. The pull back is unfolding as Elliott Wave Double Three Pattern. At this stage we can count clear 7 swings down from the peak when the price has already reached the equal legs- Blue Box area. There is no any clear sign yet that pull back is done, but we are aware that turn can happen any moment . We expected buyers to appear at the blue box for a proposed rally or 3 waves bounce alternatively. We don't recommend selling the pair and expect rally to happen from the blue box in 3 waves bounce at least.
As our members know, Blue Boxes are no enemy areas , giving us 85% chance to get a reaction from there.

AUDUSD1 Hour Elliott Wave Analysis 12.10.2019
AUDUSD found buyers right at the blue box area . We got nice impulsive rally when the price made break above 10/31 peak. That suggests further extension higher as far as pivot at 0.67523 low holds. At this stage we are calling cycle from the 11/29 low completed as wave W red. As far as the price stays below 0.693823 peak, we can get another leg down before buyers appear again.
Keep in mind market is dynamic and presented view could have changed in the mean time. You can check most recent charts in the membership area of the site. Best instruments to trade are those having incomplete bullish or bearish swings sequences.We put them in Sequence Report and best among them are shown in the Live Trading Room.

EURUSD Technical Analysis
EURUSD : An Elliott Wave Zig-Zag pattern is a 3 wave (A,B,C) pattern consisting of a 5-3-5 wave structure. 5 waves for the wave A, followed by 3 waves for wave B and finally another 5 waves for wave C to complete the Zig Zag pattern. The Zig Zag pattern is a counter trend pattern and goes against the main trend so trading this pattern a trader should always use tight stops. Traders also need to watch price action for confirmation if the pattern will ultimately form.
EURUSD 1 Hour Weekend Chart 12.7.2019 : Start of the trading week of December 8 - 13/2019 we advised our clients that a Zig Zag pattern has formed and that the pair would push higher. We advised that the wave (b) 3 wave pullback has terminated and to watch for the next rally higher. EWF clients were clear that the trade to the upside was the choice to take. Only a move lower below the invalidation level would cancel the upside move.
Before

EURUSD 1 Hour Chart 12.14.2019 : Using other strategies/techniques as trading filters allows a trader to enter the market with confidence. Trading filters are rules/signals that need to be met before entering the trade. The chart below shows how a trader could have entered the BUY trade waiting on price action confirmation. Filters consisting of bullish divergence, a higher high/higher low sequence (HH/HL), support/resistance zones and an Elliott Wave Zig Zag pattern is what I used to catch the breakout trade higher which eventually hit the 1:3 RR and completed the 5-3-5 pattern.
After

In this blog, we are going to look at the recent developments in CHFJPY forex pair. CHFJPY rally from 10.4.2019 (106.72) to 10.21.2019 (110.39) was in 3 waves and unfolded as a zigzag Elliott wave structure. Then pair pulled back to correct the cycle from 10.4.2019 low, it did 3 waves back to 109.11 but failed to break to new highs above 110.39 and turned lower again so we called a double three elliott wave correction toward 108.87 - 108.06 area. We highlighted the area with a blue box as we expected 7 swings lower from 10.21.2019 (110.39) peak and expect the pair to either resume the rally from the blue box or bounce in 3 waves at least.
CHFJPY 21 November 4 Hour Elliott Wave Update

CHFJPY December 12 4 Hour Elliott Wave Update
In the chart below we can see that pair reached the blue box between 108.87 - 108.06 and rallied to a new high above 10.21.2019 (110.39) peak. It saw a perfect reaction from the blue box and the reaction higher allowed any buyers from the blue box to get into a risk free position. We can see pair has reached the area where it is expected to end wave ((w)) i.e. cycle from 11.24.2019 (108.79) low and then pull back in wave ((x)) which should again unfold in the sequence of 3, 7 or 11 swings. Pair is currently showing 5 swings up from 10.4.2019 low and has an incomplete sequence against 11.24.2019 low so as wave ((x)) dip hold above this level, we expect the pair to make another push higher toward 112.45 - 113.32 area at least.

CHFJPY 12.15.2019 4 Hour Elliott Wave Update
Latest 4 Hour chart update shows pair has completed wave ((w)) and now pulling back in wave ((x)) which is expected to find buyers again in 3, 7 or 11 swings as far as pivot at 108.78 low remains intact and we don't like selling it as the right side is up.

Elliott Wave view in Nikkei (NKD_F) suggests that the Japanese Index ended wave (4) on December 3 at 22898. This is part of a bigger impulsive 5 waves rally from August 25, 2019 low (not shown on the chart). Up from August 25, 2019 low, wave (1) ended at 21970, wave (2) pullback ended at 21070, wave (3) ended at 23660 and wave (4) ended at 22898.
In the 1 hour chart below, we can see the Index has resumed higher in wave (5). The rally from December 3, 2019 low is unfolding as a 5 waves Elliott wave impulsive structure. Up from 12/3/2019 low, wave ((i)) ended at 23565 and wave ((ii)) pullback ended at 23265. The Index then extended higher in wave ((iii)) towards 24075 and pullback in wave ((iv)) ended at 23770.
Index is expected to end wave ((v)) soon with another leg higher. This final leg should also end wave 1 in higher degree. Afterwards, Index should correct cycle from December 3, 2019 low within wave 2 before the rally resumes. We don't like selling the proposed pullback and prefer buying wave 2 dips in 3, 7, or 11 swing as far as pivot at 22898 low stays intact. Potential target for wave (5) is 100% - 123.6$ Fibonacci extension of wave (1) towards 25171 - 25707.
Nikkei 1 Hour Elliott Wave Chart

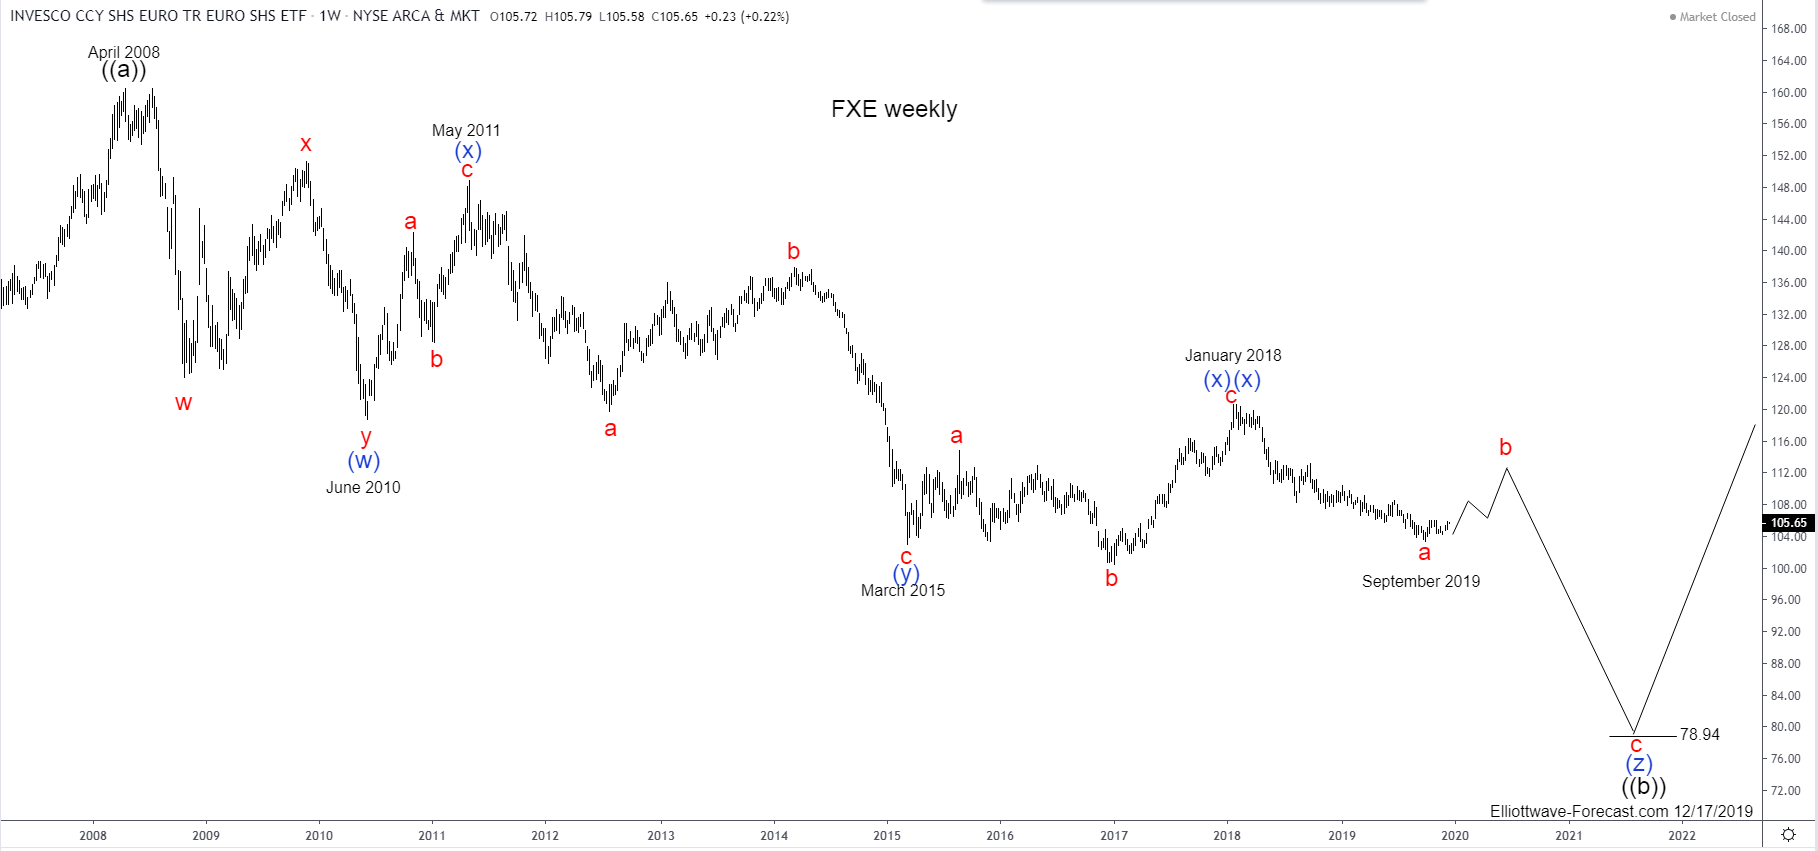
FXE Longer Term Cycles and Elliott Wave
Firstly as seen on the weekly chart shown below the instrument made a high in April 2008. There is data back to December 2005 in the ETF fund. Data correlated in the EURUSD foreign exchange pair suggests the high in April 2008 was the end of a cycle up from the all time lows. EURUSD data shows the pair had a five wave up move from the early 1970's era. This data is derived from the German Mark currency against the US Dollar that preceded the inception of the Euro currency.
As you can see the FXE instrument reflects the price swings of the single currency well. As previously mentioned the instrument made a high in April 2008. This where the analysis begins on the weekly chart shown below. The correction from those highs appears to be a an Elliott Wave triple three structure correction. The analysis continues below the weekly chart.

Secondly as mentioned the decline from the April 2008 highs appears to be an Elliott Wave triple three structure. The cycle lower from there does not count well as an impulse although there is a such thing as a diagonal that subdivides in five three swing moves in the direction of that cycle. When a cycle ends against a trend it will show in momentum indicators usually before price makes it obvious. These cycle highs and lows are in the blue color as shown on the chart above (w)-(x)-(y) & potential (z) to come later.
Lastly in conclusion as said the structure lower from the 2008 highs appears to be a triple three Elliott Wave structure. The instrument currently appears ended a cycle lower from the January 2018 highs. It should be able to further develop a bounce higher to correct the cycle from the January 2018 highs while above the late September 2019 lows. As of now the best guess would be to around the 112.00-114.00 area in the red wave b. While below the January 2018 highs a long term low can be seen. This is the 78.94 area where the wave (z) in blue is equal in length to the wave (w).
Firstly as seen on the weekly chart shown below the instrument made a high in April 2008. There is data back to December 2005 in the ETF fund. Data correlated in the EURUSD foreign exchange pair suggests the high in April 2008 was the end of a cycle up from the all time lows. EURUSD data shows the pair had a five wave up move from the early 1970's era. This data is derived from the German Mark currency against the US Dollar that preceded the inception of the Euro currency.
As you can see the FXE instrument reflects the price swings of the single currency well. As previously mentioned the instrument made a high in April 2008. This where the analysis begins on the weekly chart shown below. The correction from those highs appears to be a an Elliott Wave triple three structure correction. The analysis continues below the weekly chart.
Secondly as mentioned the decline from the April 2008 highs appears to be an Elliott Wave triple three structure. The cycle lower from there does not count well as an impulse although there is a such thing as a diagonal that subdivides in five three swing moves in the direction of that cycle. When a cycle ends against a trend it will show in momentum indicators usually before price makes it obvious. These cycle highs and lows are in the blue color as shown on the chart above (w)-(x)-(y) & potential (z) to come later.
Lastly in conclusion as said the structure lower from the 2008 highs appears to be a triple three Elliott Wave structure. The instrument currently appears ended a cycle lower from the January 2018 highs. It should be able to further develop a bounce higher to correct the cycle from the January 2018 highs while above the late September 2019 lows. As of now the best guess would be to around the 112.00-114.00 area in the red wave b. While below the January 2018 highs a long term low can be seen. This is the 78.94 area where the wave (z) in blue is equal in length to the wave (w).
Last week, US Dollar fell across the board after the Fed signaled it will leave policy unchanged for an extended period of time until 2021. The Fed maintained the interest rate unchanged at 1.5 - 1.75%. They also kept the forecast of inflation and GDP unchanged. The central bank's median rate is forecast to hold steady at 1.6% until the end of 2020, then increase to 1.9% in 2021. The Fed Chairman Jerome Powell said the Fed wants to see a significant and persistent move in inflation before acting on rate. So far, the inflation has remained below the Fed's target of 2%.
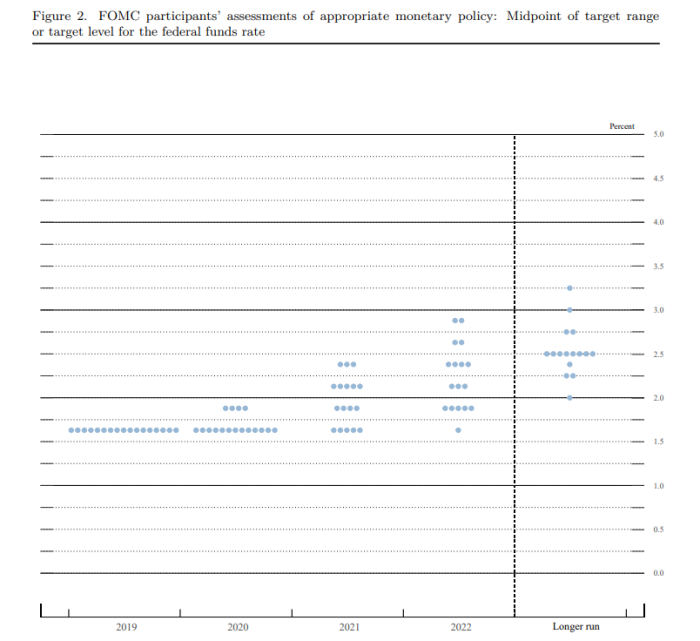
Here's the December dot plot:

And here's the September dot plot

The December's projection see a downward shift in the dots, with only 4 of 17 members anticipating a quarter rate increase in 2020. The median expectation of fed funds rate at 1.6% in 2020 is down from 1.9% in the September's estimate. The median rate for 2021 is also down from 2.1% to 1.9%.
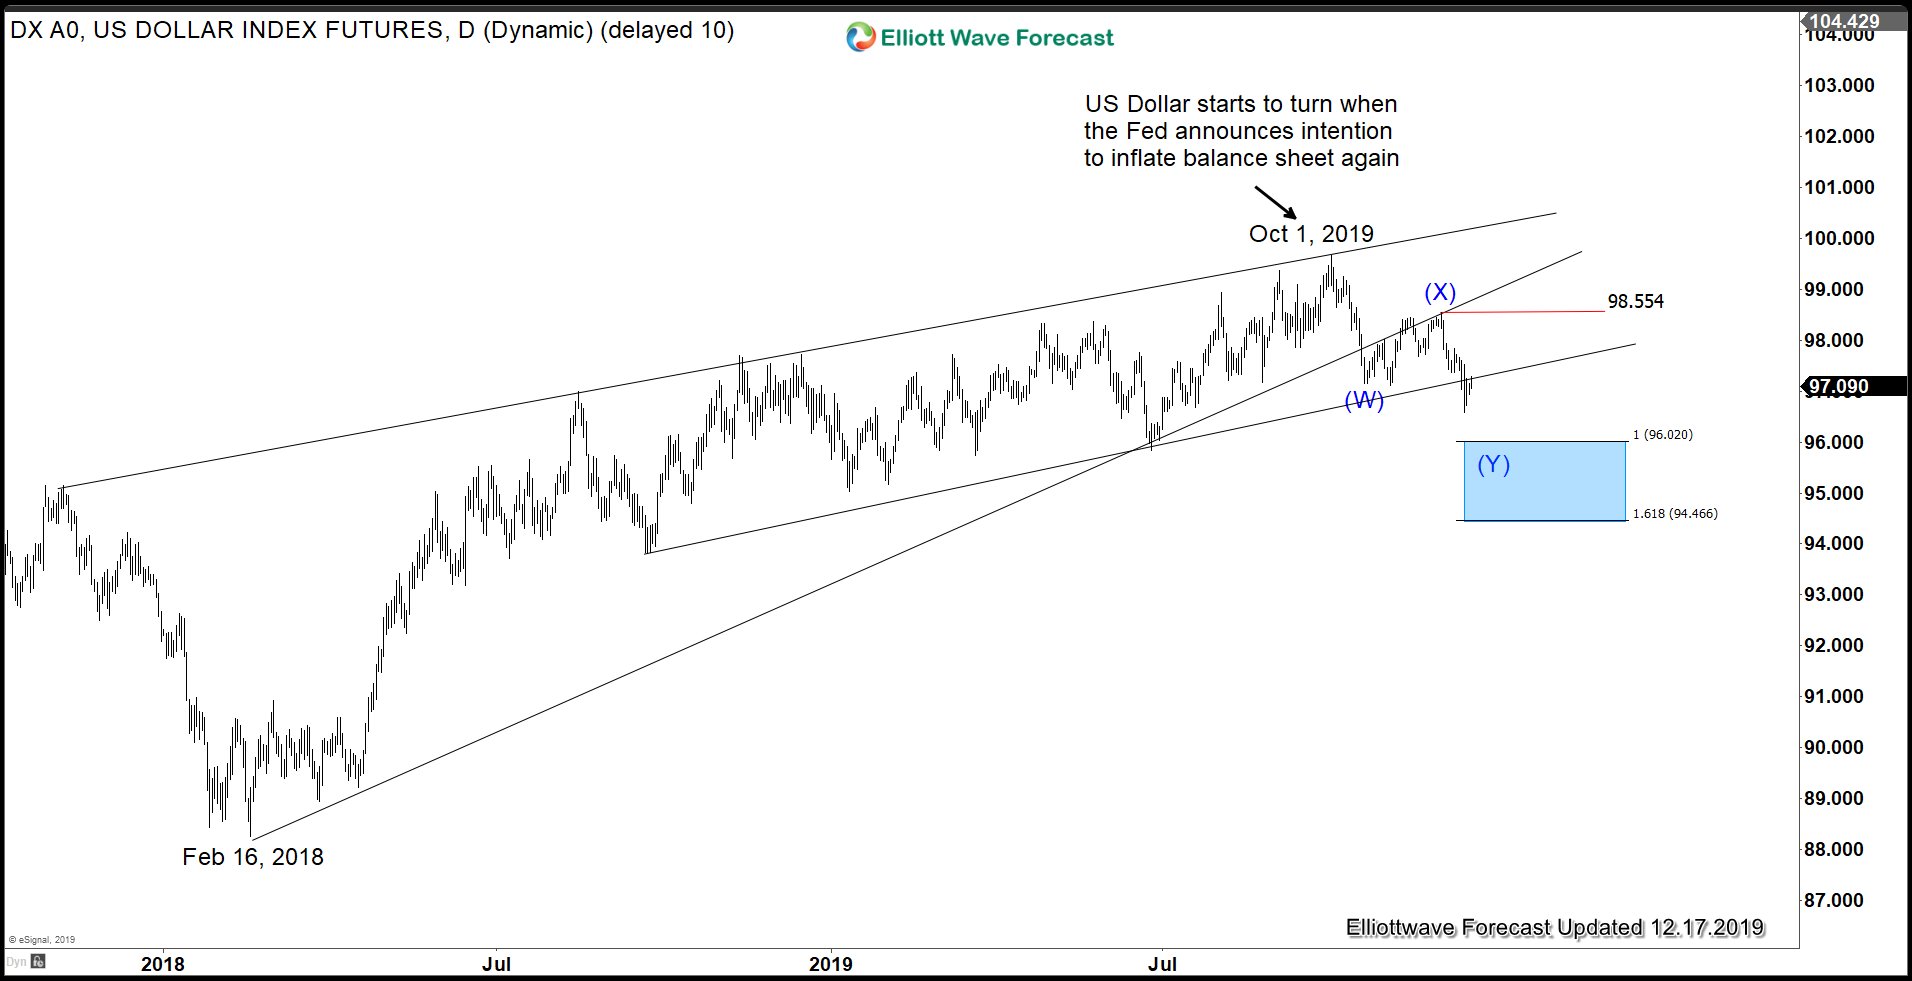
USD Index Ended Cycle from February 16, 2018 Low

USD Index has broken below the rising trend line from February 16, 2018 low, suggesting it has ended that cycle. At minimum, the Index should now correct that cycle in larger pullback in 3, 7, or 11 swing in the next coming weeks. In the near term, it shows a bearish sequence from October 1, 2019 high. While rally fails below 98.55, expect the Index to extend lower. We don't like buying the Index and favor further downside.
USD Time Cycle Analysis Indicates Potential Downside

A 15 year cycle in USD Index suggests it may have peaked on January 2017. Previous cycles from 1970 suggests the USD may continue lower in the next 4-5 years.
DXY 1 Hour London 12/17/2019

Dollar Index 1 hour chart above shows a bearish sequence with the right side going lower. Near term, any rally is expected to find sellers in the sequence of 3, 7, or 11 swing for further downside. We do not like buying the proposed bounce.
Here's the December dot plot:
And here's the September dot plot
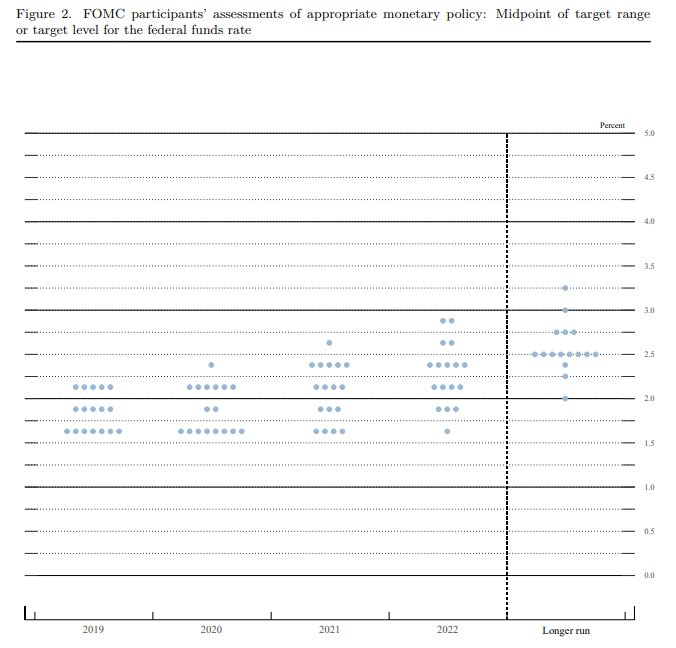
The December's projection see a downward shift in the dots, with only 4 of 17 members anticipating a quarter rate increase in 2020. The median expectation of fed funds rate at 1.6% in 2020 is down from 1.9% in the September's estimate. The median rate for 2021 is also down from 2.1% to 1.9%.
USD Index Ended Cycle from February 16, 2018 Low
USD Index has broken below the rising trend line from February 16, 2018 low, suggesting it has ended that cycle. At minimum, the Index should now correct that cycle in larger pullback in 3, 7, or 11 swing in the next coming weeks. In the near term, it shows a bearish sequence from October 1, 2019 high. While rally fails below 98.55, expect the Index to extend lower. We don't like buying the Index and favor further downside.
USD Time Cycle Analysis Indicates Potential Downside
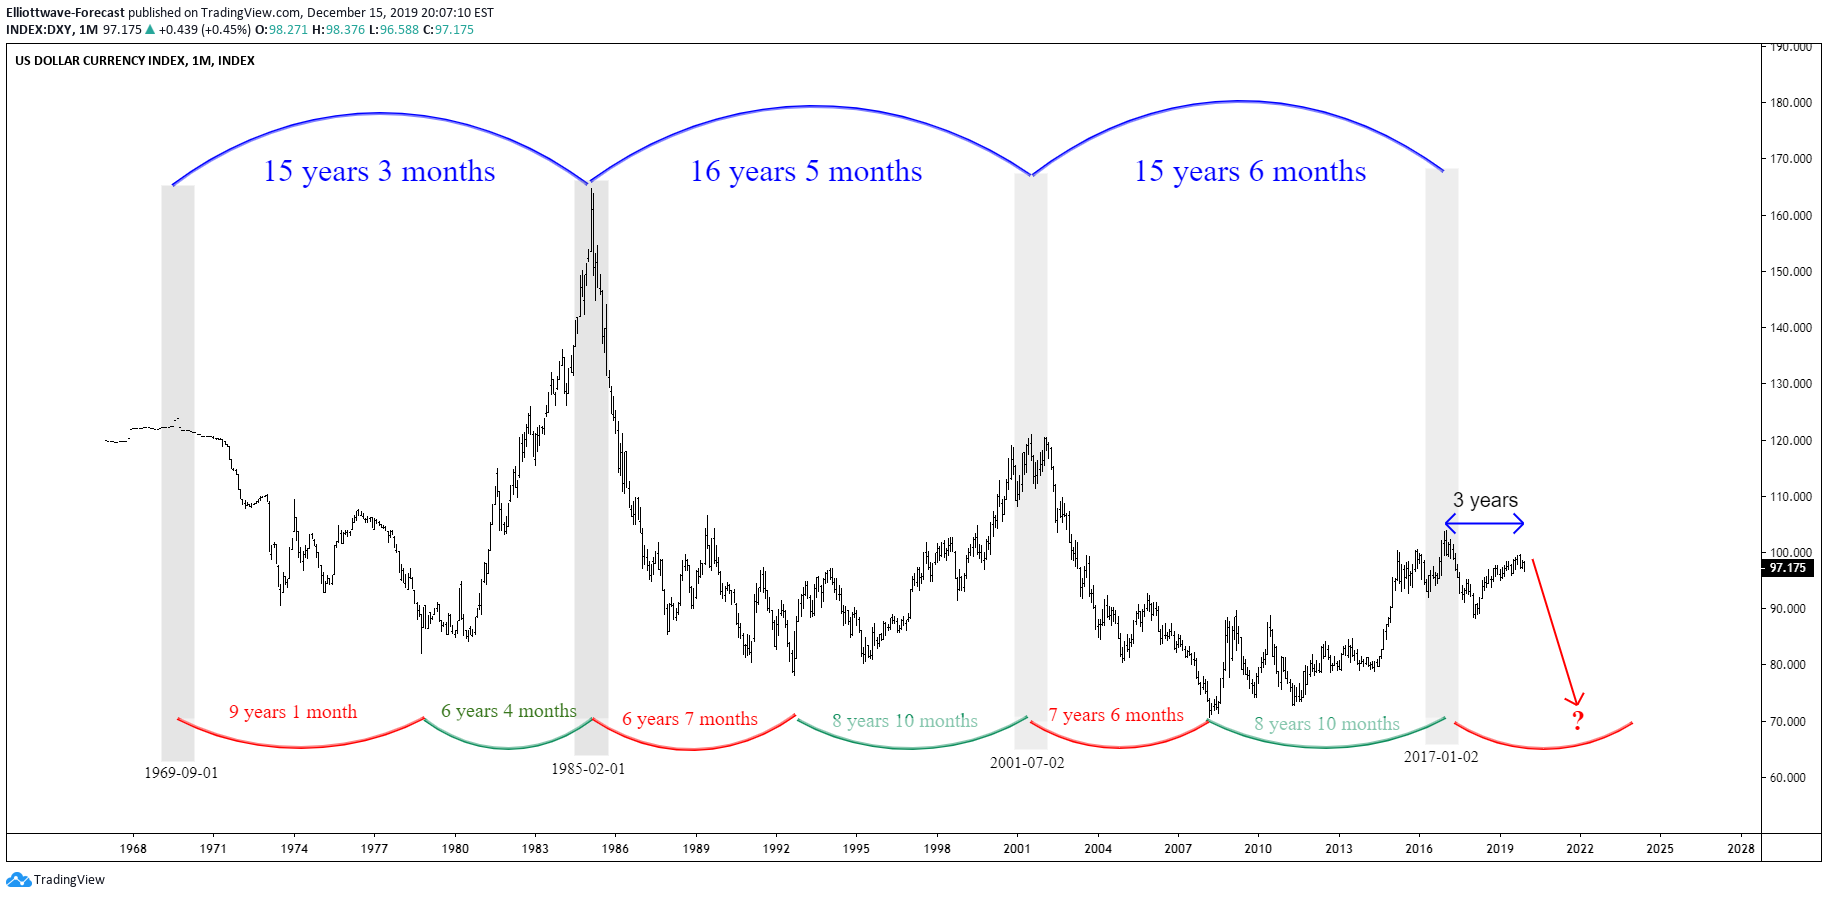
A 15 year cycle in USD Index suggests it may have peaked on January 2017. Previous cycles from 1970 suggests the USD may continue lower in the next 4-5 years.
DXY 1 Hour London 12/17/2019

Dollar Index 1 hour chart above shows a bearish sequence with the right side going lower. Near term, any rally is expected to find sellers in the sequence of 3, 7, or 11 swing for further downside. We do not like buying the proposed bounce.
Elliott Wave view in DAX suggests that Index shows an incomplete bullish sequence from December 27, 2018 low favoring more upside. On the 1 hour chart below, we can see the rally to 13374.27 ended wave 3 and the pullback to 12890.56 on December 10, 2019 low ended wave 4. The Index has resumed higher in wave 5 with internal subdivision as a 5 waves Elliott wave impulsive structure. Up from 12/10/2019 low, wave (i) ended at 13219.03 and wave (ii) pullback ended at 13124.24. Index then extended higher in wave (iii) towards 13423.41 and wave (iv) pullback ended at 13255.55. The final leg wave (v) is proposed complete at 13407.66 and this ends wave ((i)) of 5 in larger degree.
Expect Index to pullback in wave ((ii)) to correct the cycle from December 10, 2019 low before the rally resumes. We don't like selling the pullback. As far as pivot at 12890.56 low stays intact, dips should continue to find support in the sequence of 3, 7, or 11 swing. Potential target higher is 100% - 123.6% Fibonacci extension from December 27, 2018 low which comes at 13640 - 14204 area.
DAX 1 Hour Elliott Wave Chart

In this technical blog, we are going to take a look at the past performance of 1-hour Elliott Wave Charts of Dow Jones Futures ($YM_F), which we presented to members at elliottwave-forecast.com. In which, the cycle from 12/26/2018 low ( $21452) unfolded in an impulse structure & showed a higher high sequence in bigger time frame charts called for further upside. Also, it’s important to note that the $YM_F was having green right side tag pointing higher favored members to look for buying opportunity at the blue box areas in 3, 7 or 11 swings. We will explain the ideas & structure below:
$YM_F 1 Hour Elliott Wave Chart
 Elliott Wave: Forecasting The Rally From Blue Box")
$YM_F 1 Hour Elliott Wave Chart from 12/03/2019 NY update, in which the cycle from 10/03/2019 low unfolded in an impulse structure where wave 1 ended at $27088. Wave 2 ended at $26588 low, wave 3 ended at $28128 high, wave 4 ended at $27643 low and wave 5 ended at $28197 high thus completed wave (3). Down from there, the index made a sharp decline in wave (4) pullback to correct the rally from 10/03/2019 low before a rally could resume higher again. The internals of that pullback unfolded as zigzag structure where wave A ended at $27740 low. Wave B ended at $27852 high and wave C managed to reach the blue box area at $27392-$27284 100%-123.6% Fibonacci extension area of A-B. Thus offered our members a buying opportunity looking into more highs or for 3 wave reaction higher at least.
$YM_F 1 Hour Elliott Wave Chart
 Elliott Wave: Forecasting The Rally From Blue Box")
We did show the idea of 7 swings lower in wave (4) after the reaction from the blue box but made it clear that after 3 swings in the correction, 7 swings don't need to happen so any longs from blue box would want to stay long with a risk free position. Later on, we discarded the idea of 7 swings lower in the correction based on market correlation and here's $YM_F 1 Hour Elliott Wave Chart from 12/12/2019 Asia update, in which the index is showing reaction higher taking place from the $27392-$27284 blue box area as we expected. Allowed members to create a risk-free position shortly after taking the trade. Since than the index has bounced strongly & managed to made a new high above 12/02/2019 peak confirming the next extension higher.
$YM_F 1 Hour Elliott Wave Chart
 Elliott Wave: Forecasting The Rally From Blue Box")
$YM_F 1 Hour Elliott Wave Chart from 12/03/2019 NY update, in which the cycle from 10/03/2019 low unfolded in an impulse structure where wave 1 ended at $27088. Wave 2 ended at $26588 low, wave 3 ended at $28128 high, wave 4 ended at $27643 low and wave 5 ended at $28197 high thus completed wave (3). Down from there, the index made a sharp decline in wave (4) pullback to correct the rally from 10/03/2019 low before a rally could resume higher again. The internals of that pullback unfolded as zigzag structure where wave A ended at $27740 low. Wave B ended at $27852 high and wave C managed to reach the blue box area at $27392-$27284 100%-123.6% Fibonacci extension area of A-B. Thus offered our members a buying opportunity looking into more highs or for 3 wave reaction higher at least.
$YM_F 1 Hour Elliott Wave Chart
 Elliott Wave: Forecasting The Rally From Blue Box")
We did show the idea of 7 swings lower in wave (4) after the reaction from the blue box but made it clear that after 3 swings in the correction, 7 swings don't need to happen so any longs from blue box would want to stay long with a risk free position. Later on, we discarded the idea of 7 swings lower in the correction based on market correlation and here's $YM_F 1 Hour Elliott Wave Chart from 12/12/2019 Asia update, in which the index is showing reaction higher taking place from the $27392-$27284 blue box area as we expected. Allowed members to create a risk-free position shortly after taking the trade. Since than the index has bounced strongly & managed to made a new high above 12/02/2019 peak confirming the next extension higher.
Elliott Wave view in Alibaba ($BABA) suggests that stock rallies as a 5 waves impulsive Elliott Wave structure from August 5, 2019 low. On the 1 hour chart below, we can see wave 3 of this impulse ended at 202.71. Stock then pullback in wave 4 on December 3, 2019 low at 189.88. Stock has resumed higher in wave 5 with the internal subdivision as another impulse in lesser degree. Up from December 3 low, wave (i) ended at 203.43 and pullback in wave (ii) ended at 197.09. Stock then extended higher in wave (iii) towards 207.85 and wave (iv) ended at 203.77.
Stock has scope to extend higher in the near term but expect wave (v) of ((i)) to end soon. It should then pullback in wave ((ii)) to correct the cycle from December 3, 2019 low before the rally resumes. We don't like selling the proposed pullback and expect buyers to appear in the sequence of 3, 7, or 11 swing as far as pivot at 189.88 low stays intact. Potential target to the upside is 100% - 123.6% Fibonacci extension from January 3, 2019 low which comes at 213 - 229 area.
BABA 1 Hour Elliott Wave Chart

As we have anticipated and communicated in every opportunity, world indices keep trading into new all-time highs. They should still continue to extend in years to come. It is easy to try picking the tops after the rally since 2009 by looking for completion of five waves and pointing at the momentum divergence. At EWF, we always look around the entire Market for clear instrument to provide us with the edge into the next cycle.
We do understand the market does not move in a straight line, and soon cycle degree from December 2018 low might be ending. When this cycle ends, a higher degree correction should happen and it will provide another excellent opportunity to buy for the next leg higher. We are looking for two main points to validate the extension higher the world indices. First, we are looking at the $SPX. We have been waiting for the 3189 levels to be reached to confirm that the grand super cycle is making five waves advance.
$SPX Extends Higher Within Wave (III) - World Indices Remain Bullish

Breaking 3189 supports the the idea that $SPX is still within wave three due to the extension. Therefore, more upside is likely to happen and $SPX can reach over 4000-4500 sometimes into the future. In five waves impulse, typically one of the cycles will extend, and usually it's wave 3 that extends. Breaking 3189 makes the cycle from 2009 low showing extension. 3189 is the 161.8% Fibonacci extension from 0 to year 2000 high, related to year 2009 low. This is the method to measure a wave three extension. We are now trading above that level and should extend still from 2009 low before ending wave (III). This also supports the idea there is further extension in wave (V) later after cycle from 2009 low ends and larger wave (IV) pullback happens.
ASX 200 from Australia Broke Above 2007 High Shows Bullish Sequence

Secondly, we at EWF are looking at Australian Index $XJO-ASX 200. It is a market-capitalization-weighted and float-adjusted stock market index of stocks listed on the Australian Securities Exchange. The Index is maintained by Standard & Poor's and is considered the benchmark for Australian equity performance. This Index is important because the Grand Super Cycle peak in year 2007 happened late compared to other Indices like $SPX, $SPY, which peaked in year 2000.
This discrepancy is critical because ASX 200 is now showing a bullish sequence within the Grand Super cycle against 2009 lows. The Index should reach 7289-8292 area sometimes next year and creates a three waves pullback. This should represent a wave (IV) pullback in $SPX. Despite the pullback, direction and intention remain clear. The chart above suggests extension higher for another ten years after the 2009 cycle ends.
Seeing that our two points are met, we believe that World Indices are here for an up and running extension. Year 2020 might be the end of the cycle from 2009 low, but it's not the crash everyone is waiting.
We do understand the market does not move in a straight line, and soon cycle degree from December 2018 low might be ending. When this cycle ends, a higher degree correction should happen and it will provide another excellent opportunity to buy for the next leg higher. We are looking for two main points to validate the extension higher the world indices. First, we are looking at the $SPX. We have been waiting for the 3189 levels to be reached to confirm that the grand super cycle is making five waves advance.
$SPX Extends Higher Within Wave (III) - World Indices Remain Bullish

Breaking 3189 supports the the idea that $SPX is still within wave three due to the extension. Therefore, more upside is likely to happen and $SPX can reach over 4000-4500 sometimes into the future. In five waves impulse, typically one of the cycles will extend, and usually it's wave 3 that extends. Breaking 3189 makes the cycle from 2009 low showing extension. 3189 is the 161.8% Fibonacci extension from 0 to year 2000 high, related to year 2009 low. This is the method to measure a wave three extension. We are now trading above that level and should extend still from 2009 low before ending wave (III). This also supports the idea there is further extension in wave (V) later after cycle from 2009 low ends and larger wave (IV) pullback happens.
ASX 200 from Australia Broke Above 2007 High Shows Bullish Sequence
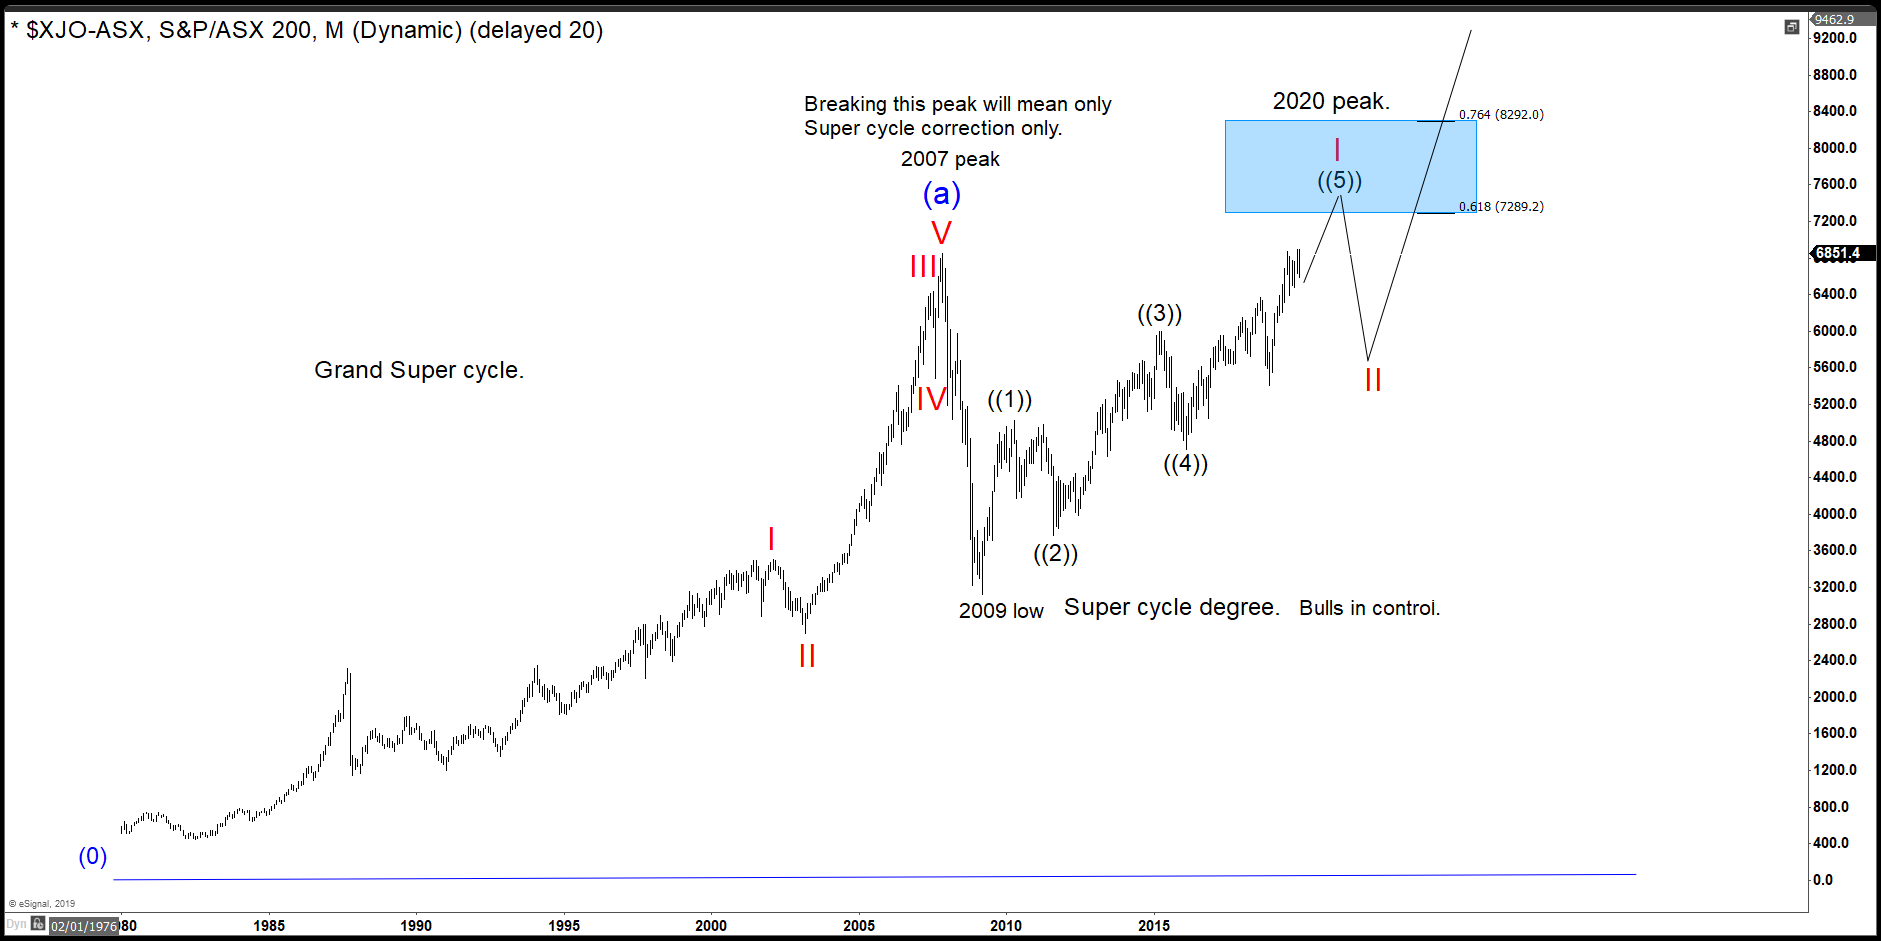
Secondly, we at EWF are looking at Australian Index $XJO-ASX 200. It is a market-capitalization-weighted and float-adjusted stock market index of stocks listed on the Australian Securities Exchange. The Index is maintained by Standard & Poor's and is considered the benchmark for Australian equity performance. This Index is important because the Grand Super Cycle peak in year 2007 happened late compared to other Indices like $SPX, $SPY, which peaked in year 2000.
This discrepancy is critical because ASX 200 is now showing a bullish sequence within the Grand Super cycle against 2009 lows. The Index should reach 7289-8292 area sometimes next year and creates a three waves pullback. This should represent a wave (IV) pullback in $SPX. Despite the pullback, direction and intention remain clear. The chart above suggests extension higher for another ten years after the 2009 cycle ends.
Seeing that our two points are met, we believe that World Indices are here for an up and running extension. Year 2020 might be the end of the cycle from 2009 low, but it's not the crash everyone is waiting.
Similar to most instrument within the energy sector, Chevron (ticker: $CVX) is trading sideways to lower since the peak on 04.08.2019. $CVX is showing a five waves advance since the lows at $69.65, which happened on 08.24.2015. This low is also the same low in Crude Oil, which we believe ended the Grand Super cycle correction and now starts a new cycle into higher levels. The following seminar explains our view in the sector and why soon we will be trading higher. We are looking for opportunities to buy the sector, and we like the waves structure presented in Chevron. The Instrument is showing a nest from 08.24.2015 low, which is a combination of more than five waves in one direction. The follow chart illustrates the nest:
Chevron Shows a Possible Nesting Impulse From 8.24.2015 Low
 Getting Ready for a Rally")
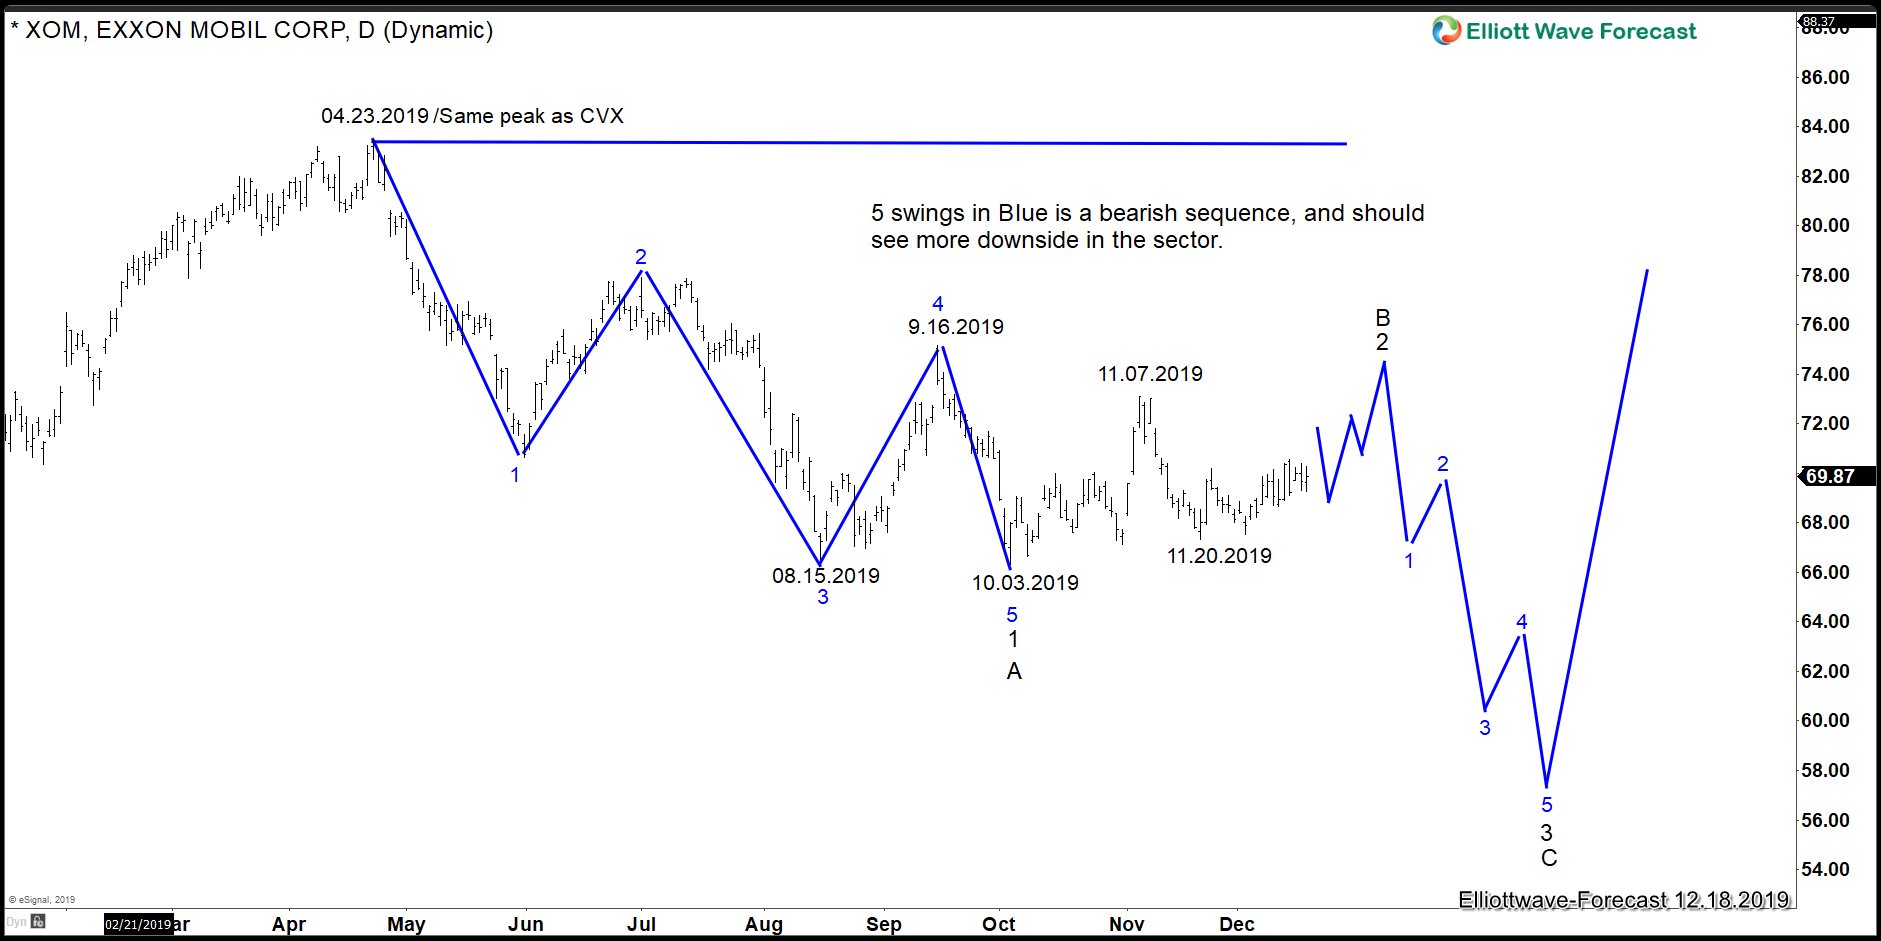
Chevron, like every world Indices, created a wave II low on 12.2018 and makes five waves from lows into a wave ((1)) peak at 04.08.2019. Since then, the stock has been trading sideways to lower. Looking at $XOM (Exxon Mobil) chart below, there are five swings from the peak on 04.23.2019, which is a bearish sequence. This calls for more sideways to downside action in Chevron. The following chart shows the bearish sequence since the peak on 04.23.2019.
Exxon Mobil (XOM) Shows Bearish Sequence from 4.23.2019 High

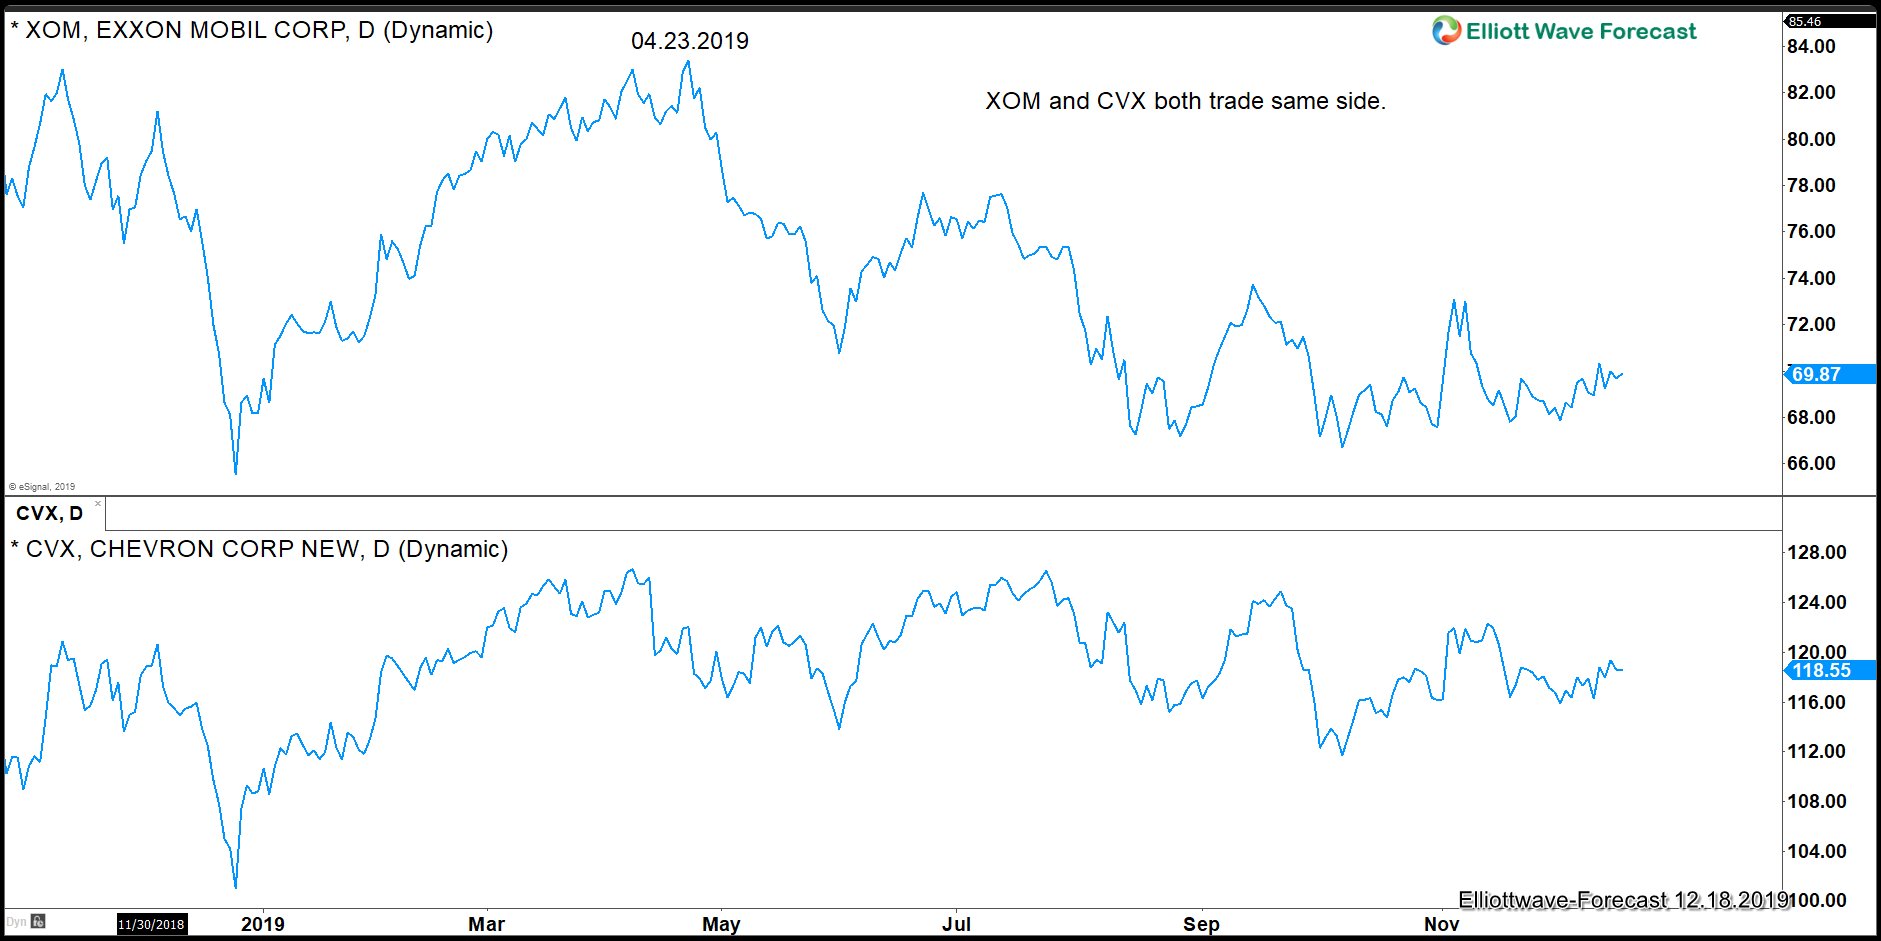
Many traders do not follow the correlation of the market. Exxon and Chevron belong to the same sector and consequently, most of the time follow the same side of the market. The following chart below shows both instrument on the same chart, which lead us to believe Chevron is not yet ready for a rally due to Exxon bearish sequence.

Exxon should see $74.00 and then drop into the $58.00 area, in which case Chevron can be testing the trend-line between 08.24.2015 and 12.2018 low. This will give an excellent opportunity to go long not only in the Chevron but also in instrument like $CHK, $CL#F, $GCC, among others. However, Chevron is showing the best Elliott wave structure.
In conclusion, we see an excellent chance for a swing trade on Chevron into the summer of 2020. We should see the $150.00-175.00 area around that time and it can give a buying opportunity at the trend-line test. Ideally, Exxon at the same time also reaches the 100% extension from 4.23.2019 high in ABC zigzag Elliott Wave structure.
Chevron Shows a Possible Nesting Impulse From 8.24.2015 Low
 Getting Ready for a Rally")
Chevron, like every world Indices, created a wave II low on 12.2018 and makes five waves from lows into a wave ((1)) peak at 04.08.2019. Since then, the stock has been trading sideways to lower. Looking at $XOM (Exxon Mobil) chart below, there are five swings from the peak on 04.23.2019, which is a bearish sequence. This calls for more sideways to downside action in Chevron. The following chart shows the bearish sequence since the peak on 04.23.2019.
Exxon Mobil (XOM) Shows Bearish Sequence from 4.23.2019 High
Many traders do not follow the correlation of the market. Exxon and Chevron belong to the same sector and consequently, most of the time follow the same side of the market. The following chart below shows both instrument on the same chart, which lead us to believe Chevron is not yet ready for a rally due to Exxon bearish sequence.
Exxon should see $74.00 and then drop into the $58.00 area, in which case Chevron can be testing the trend-line between 08.24.2015 and 12.2018 low. This will give an excellent opportunity to go long not only in the Chevron but also in instrument like $CHK, $CL#F, $GCC, among others. However, Chevron is showing the best Elliott wave structure.
In conclusion, we see an excellent chance for a swing trade on Chevron into the summer of 2020. We should see the $150.00-175.00 area around that time and it can give a buying opportunity at the trend-line test. Ideally, Exxon at the same time also reaches the 100% extension from 4.23.2019 high in ABC zigzag Elliott Wave structure.
Shopify (NYSE: SHOP) surged higher this year after a strong Breakout of a Bullish Flag which allowed the stock to rally almost 200%. Despite the 40% correction that took place since August, SHOP managed to recover and it's currently retesting the previous peak aiming for a break to new all time-highs.
The short term cycle taking place since November low is currently in progress as the stock is looking for a 4th wave pullback which can find buyers in 3 or 7 swings around extreme area $382 - $368 before resuming the rally or bouncing in 3 waves at least.

SHOP is expected to remain supported above $281 as the aggressive view is suggesting a nest taking place since IPO and consequently the stock can aim for a higher target at equal legs area $573 - $642 which will allow a 5 waves impulsive structure to take place next year within the cycle from December 2018 low.

The alternative view would suggest a lesser aggressive view with the stock ending the 5 waves move since IPO around $471 area resulting on a larger 3 waves pullback to take place next year before buyers show up again looking to start a new cycle to the upside as the overall structure for the stock remain bullish.

Similar threads
- Replies
- 1
- Views
- 2K
- Replies
- 0
- Views
- 2K
- Replies
- 2
- Views
- 3K