Elliott Wave Analysis by EWF

In this Elliott Wave update, we examine the long-term structure in SLB Limited ($SLB). The stock completed a major bullish cycle in 2014 and then entered a multi-year corrective phase. That decline unfolded as a large zigzag correction and eventually bottomed at 11.87 in 2020.

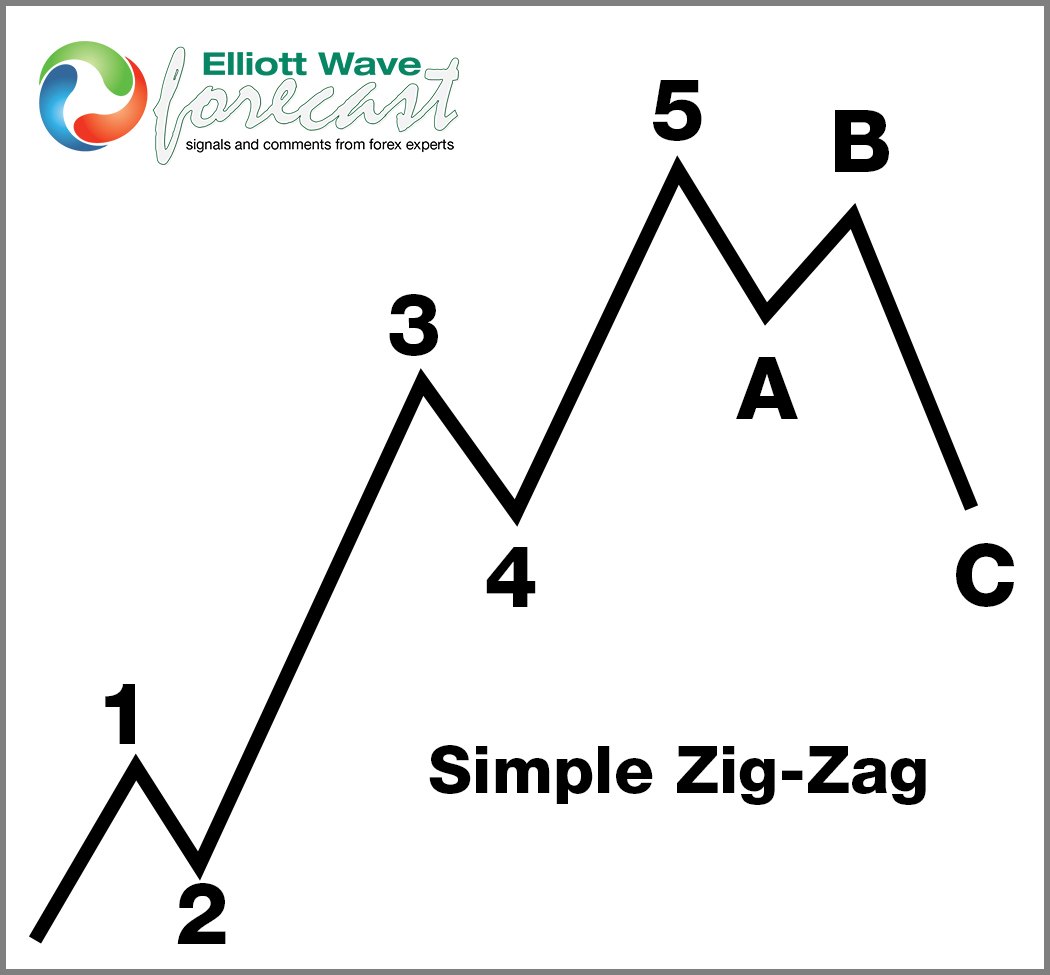
5 Wave Impulse + ABC correction​

$AMD​

Since that low, $SLB has started a new bullish cycle. More importantly, the Elliott Wave structure has continued to build a series of nested wave 1 and wave 2 sequences. Two nests have already been completed, while a third appears close to finding its low. If this structure continues to develop as expected, $SLB could be preparing for a significant acceleration higher over the next few quarters toward the $81–$113 area.

$SLB

Major Cycle From 2014 Ended With a Zigzag Correction​

Looking at the weekly chart, $SLB reached an important long-term peak in 2014. From there, the stock entered a prolonged bearish correction that lasted several years.

The decline unfolded as a large A-B-C zigzag structure. Wave (A) produced the initial decline, wave (B) delivered a corrective recovery, and wave (C) extended sharply lower into the 2020 low.

That correction finally ended at 11.87, marking an important long-term turning point for the stock.

From an Elliott Wave perspective, the 2020 low completed wave II, opening the door for an entirely new bullish cycle.

First Bullish Nest Formed From the 2020 Low​

From the 2020 bottom, $SLB started a strong advance and developed five waves higher. That impulsive move completed wave ((1)), confirming that buyers had regained control of the larger trend.

Afterward, the stock entered a corrective decline that lasted into April 2025. That pullback completed wave ((2)) and formed the first bullish nest.

This is an important feature of the long-term structure. Rather than ending the bullish cycle, the April 2025 decline simply corrected the first impulsive move from the 2020 low.

Second Nest Completed in July 2026​

Once the April 2025 correction ended, $SLB started another strong advance.

Again, the rally developed in five waves, completing another wave (1) at a smaller degree. The market then corrected that move and found another important low in July 2026, completing wave (2).

That sequence created the second nest within the larger bullish structure.

At this point, $SLB had established two separate wave 1–2 formations from the 2020 low. This type of nesting often appears before a market enters the strongest part of a third-wave advance.

Third Nest Is Now Looking for a Low​

Following the July 2026 low, $SLB rallied again and produced another new high, confirming that the bullish sequence remained intact.

The stock has since entered another short-term pullback. This decline is being counted as another wave 2, creating what could become the third bullish nest from the 2020 low.

Most importantly, this pullback appears to be approaching completion. Therefore, $SLB could find its next important low any day now before the next impulsive leg begins.

As long as the current correction remains supported, the structure should continue to favor the upside rather than a larger bearish reversal.

Why the Triple Nest Matters​

A bullish nest forms when the market repeatedly completes wave 1 advances followed by corrective wave 2 pullbacks without invalidating the larger structure.

$SLB now appears to have built:

  • First nest: Five waves up from the 2020 low, followed by the pullback into April 2025.
  • Second nest: Another five-wave rally, followed by the correction into July 2026.
  • Third nest: A new high from the July low, followed by the current pullback that is now searching for completion.
This nested structure can create significant upside acceleration once the smaller-degree wave 2 corrections finish.

In other words, each completed nest increases the potential for multiple third waves to unfold together. That is why the next rally could become substantially stronger than the advances that preceded it.

$81–$113 Becomes the Next Major Target​

The larger bullish sequence points toward the $81.81–$113.11 area over the next few quarters.

The lower end near $81.81 represents an important Fibonacci objective, while the upper target near $113.11 corresponds with the 1.618 extension shown on the weekly chart.

Therefore, once the current third-nest pullback completes, $SLB could begin a much stronger phase of the advance.

The move does not need to occur in a straight line. Smaller pullbacks will likely develop along the way. However, the broader Elliott Wave structure suggests that those corrections should remain supported while the larger bullish sequence continues.

Bigger Picture Remains Bullish​

The most important point is that the new bullish cycle from the 2020 low at 11.87 remains incomplete.

The stock has already created multiple impulsive advances and corrective pullbacks, while each correction has remained above the larger long-term invalidation level.

Furthermore, the development of three potential nests increases the possibility that $SLB is approaching an acceleration phase.

As a result, the next several quarters could become increasingly important for the stock as the larger sequence begins to mature.

Technical Summary​

To summarize, $SLB completed a major long-term cycle in 2014 and subsequently corrected in a large zigzag structure that bottomed at 11.87 in 2020.

Since then, a new bullish cycle has developed:

The first five-wave advance was followed by a correction into April 2025, creating the first nest. Another five-wave advance then corrected into July 2026, forming the second nest. From there, $SLB made another new high and is currently pulling back in what appears to be a third nest.

That latest correction looks increasingly mature and could find a low soon.

Once it does, the combination of multiple nested bullish sequences can set the stage for a significant acceleration higher over the next few quarters, with the next major target coming within the $81–$113 area.

As long as the bullish structure remains intact above the larger 11.87 invalidation level, the right side continues to favor higher prices.

Source: https://elliottwave-forecast.com/st...-low-as-major-rally-toward-81-113-approaches/
 
TLN is nearing the completion of its bearish cycle from the September 2025 high. Additionally, the stock is finalizing a familiar pattern that suggests a significant bullish setup for long-term investors.

Talen Energy (NASDAQ: TLN)
is a leading independent power producer in the United States, operating a diversified portfolio of nuclear, natural gas, coal, and oil-fired generation assets. The company supplies electricity, capacity, and ancillary services to wholesale power markets while expanding its role in powering AI-driven digital infrastructure, making it a key player in the evolving U.S. energy sector.

A profitable investing strategy in the stock market is to buy low and sell high. It's like an unwritten rule. However, despite this popular guide to investing, a lot of investors and traders still get it wrong. From the Elliott wave perspective and especially the way we use it, we like to buy from the blue boxes in a bullish trend. Contrast, when in a bearish market, we like to sell bounces from the blue box as well. This is how our members have been able to make and keep profits for over 20 years. Meanwhile, another blue box setup appears to have emerged on TLN for the long-term positional investors.

TLN Long term Elliott Wave Analysis - The Background (17th August 2026 Update)​

Following its secondary market launch in May 2023 at approximately $46, Talen Energy rallied over 800% in just 29 months. Applying Elliott Wave theory, this price action reflects a textbook impulse structure. The initial bullish cycle began with Wave I, which climbed to $57.30 by August 2023, followed by a corrective Wave II pullback that found support at $50.75 in October 2023.

Following the breakout from the October 2023 low, the stock price rallied significantly from $50.75 to reach $258, completing wave III in January 2025. Subsequently, a wave IV pullback pressured the price down to $158 by March 2025. Wave V of (I) then commenced, driving the stock to an all-time high of $451 in September 2025.

TLN


According to Elliott Wave theory, a 5-wave impulsive cycle is typically followed by a 3-wave corrective cycle. In this instance, the initial bullish phase has concluded as wave (I), while the current pullback from the September 2025 high represents the development of a corrective wave (II). Since third waves are historically stronger than first waves, the completion of wave (II) sets the stage for a significant rally, with wave (III) potentially targeting $950 or higher.

On August 17, 2026, we presented a chart illustrating the ongoing development of the wave (II) pullback. At that time, the stock had completed wave ((W)) of Y of (II) and was nearing the conclusion of wave ((X)). We projected that a subsequent 3-swing decline would follow, guiding the price into the 299.42–206.50 blue box zone, where we advised readers to initiate long positions.

TLN Weekly Elliott Wave Analysis - 21 September 2026 Update​

tln


The latest weekly chart confirms that TLN is currently trading within the blue box zone. The corrective wave (II) may have already concluded, or it could see one final dip deeper into the zone before exhaustion. The critical focus for traders and investors is this blue box, as a potential move toward an impulsive wave (III) could trigger a rapid acceleration. If this cycle is confirmed, it would represent the strongest surge since the stock's inception, signaling a long-term period of dominance for the bulls over the next decade.

Source: https://elliottwave-forecast.com/stock-market/tln-elliott-wave-long-term-setup/
 
Cisco Systems, Inc. (NASDAQ: CSCO) continues to show a strong long-term bullish Elliott Wave structure, with the monthly chart indicating that the stock is progressing within a larger impulsive advance. Despite periods of consolidation and correction, the broader structure remains constructive and suggests further upside as the current bullish sequence develops.

The long-term Elliott Wave count shows that Cisco completed a major wave II low around the $5.21 level in 2002. From that point, the stock began a new long-term impulsive sequence in cycle degree red wave III, with wave ((1)) completing around 2007, followed by a prolonged corrective wave ((2)). Since then, Cisco has developed a substantial advance within wave ((3)), followed by a complex corrective structure in wave ((4)). The correction formed a contracting triangle with subdivisions labeled A-B-C-D-E, eventually completing around the 2024–2025 period.

CSCO_2026-09-22_06-08-19-scaled.png


CSCO Wave ((5)) Points Toward Higher Levels​

Following the completion of wave ((4)), Cisco strongly turned higher and began developing wave ((5)). The internal structure of this advance shows an incomplete bullish sequence win 3 swings with waves (1) and (2) already completed, followed by a powerful wave (3) advance. And, the stock is currently consolidating within wave (4) before another potential impulsive move higher in wave (5).

The projected Elliott Wave path suggests that wave ((5)) could extend toward the $145–$150 area which would mark the completion of wave III before a pullback develops in wave IV. Following that correction, the chart projects another advance as the broader structure continues.

Summary​

The bullish outlook remains valid as long as Cisco stays above the key $5.21 invalidation level. Overall, the Elliott Wave structure continues to favor further upside, with the current correction potentially serving as a pause within the larger bullish trend.

Source: https://elliottwave-forecast.com/stock-market/cisco-systems-elliott-wave-analysis-wave-iii-upside/
 
Hello Traders,

In today’s technical blog, we will take a closer look at the wave count for MicroStrategy, building on the analysis and outlook shared in our previous article published on August 18, 2026.

Back in August, we shared our wave count for MicroStrategy and explained why the stock could attract investors. At the time, price had reached the extreme area between 199.25 - 38.96, with the invalidation level at 13.75.

MSTR-Weekly20260818104832.jpg


Here is the link to the previous blog: https://elliottwave-forecast.com/st...egy-corrective-wave-approaching-final-stages/

The latest outlook after MicroStrategy’s reaction from the Blue Box.

Now that you have gone through the previous article using the link provided above, you should have a clear understanding of what we were expecting. Fast forward to today, MicroStrategy has reacted higher from the June 2026 lows and has already developed five swings from that low.

This suggests that the current cycle is becoming mature and could soon complete wave (1). From there, we expect a corrective move lower in wave (2), with the June 2026 low at 81.97 serving as the invalidation level. See below chart

MSTR-Weekly20260922095209.jpg


Following the wave (2) correction, the rally is expected to extend higher with initial profit‑taking levels around 269.87

Source: https://elliottwave-forecast.com/stock-market/microstrategy-reacting-higher-from-blue-box/
 
Hello traders, In this technical blog, we’ll take a closer look at the Elliott Wave charts for GOLD (XAUUSD) published in the members’ area of our website.

Gold recently completed a 3-wave pullback and rallied from the Equal Legs area as expected. The commodity may still be trading within the cycle that started from the 4233.8 low.

In the analysis below, we’ll examine the current Elliott Wave structure, key technical levels, and how we mapped the path ahead.

GOLD Elliott Wave 1 Hour Asia Chart 09.22.2026​

The current view suggests that GOLD is still correcting the cycle from the 4234.1 low. The commodity is forming a 3-wave correction, which may be unfolding as a Double Three pattern.While price remains below the current peak, marked as (x) blue, we expect another leg lower to complete the (y) blue wave.As our members know, we derive the buying zone by measuring the Equal Legs area with the Fibonacci Extension tool. The ideal target area comes at 4299-4281 (buying zone).

Once GOLD reaches this zone, we expect buyers to step in and take control. From there, we look for a strong bounce in at least three waves, with the potential for the rally to eventually reach new highs.

You can learn more about Elliott Wave Patterns at our Free Elliott Wave Educational Web Page


GOLD Elliott Wave 1 Hour London Chart 09.22.2026​

The commodity made the expected decline and reached our target area at 4299–4281, the buying zone we identified in advance. Price has already found support there, with the pullback now counted as completed at the 4292 low. As long as price holds above 4292, we can consider wave ((ii)) completed, with wave ((iii)) potentially already in progress toward new highs.

However, a break below 4292 would suggest that the pullback may still be unfolding. In that case, the 4234 low would become increasingly vulnerable.

Keep in mind that the market is dynamic, and the outlook may have changed in the meantime. Our member Chat Rooms are open 24 hours a day, Monday through Friday, on trading days, providing ongoing expert guidance on market trends and Elliott Wave analysis. Members can ask questions about market structure and technical setups at any time during trading days.


Source: https://elliottwave-forecast.com/commodities/gold-xauusd-elliott-wave-forecasting-the-path-ahead/
 
Hello fellow traders. In this technical blog, we’ll take a quick look at the Elliott Wave charts for Silver (XAGUSD) published in the members’ area of our website. As our members know, Silver has rallied from our buying zone as expected. The commodity may still be trading within the cycle that started from the 62.27 low. The recent pullback is a textbook example of an Elliott Wave Zig Zag pattern. In the analysis below, we’ll break down the pattern and show how we forecasted the path ahead.

Before we take a look at the real market example, let’s explain Elliott Wave Zigzag.

Elliott Wave Zigzag is the most popular corrective pattern in Elliott Wave theory . It’s made of 3 swings which have 5-3-5 inner structure. Inner swings are A,B,C where A =5 waves, B=3 waves and C=5 waves. That means A and C can be either impulsive waves or diagonals. (Leading Diagonal in case of wave A or Ending in case of wave C) . Waves A and C must meet all conditions of being 5 wave structure, such as: having RSI divergency between wave subdivisions, ideal Fibonacci extensions and ideal retracements.

If you are new to Elliott Wave we recommend you to check out our Free Elliott Wave Educational Web Page and download our Free Elliott Wave Book.

​

SILVER Elliott Wave 1 Hour Chart 09.22.2026​

Silver is forming a 3-wave pullback from the recent highs. At the moment, the structure still looks incomplete. So far, we can count five waves down from the peak, suggesting that the pullback is forming an Elliott Wave Zig Zag pattern. Based on the current structure, we expect another 5-wave leg lower to complete the pullback. As our members know, we derive the buying zone by measuring the Equal Legs area with the Fibonacci Extension tool.

While price remains below the latest short-term high, marked as ((b)) black, the ideal target area comes at 65.15–64.13. Once Silver reaches this zone, we expect buyers to step in and take control. From there, we look for a strong bounce in at least three waves, with the potential for the rally to eventually reach new highs.

90% of traders fail because they don’t understand market patterns. Are you in the top 10%? Put your skills to the test with this advanced Elliott Wave challenge.

You can learn more about Elliott Wave Patterns at our Free Elliott Wave Educational Web Page


SILVER Elliott Wave 1 Hour Chart 09.22.2026​

The commodity made the decline as expected. Price reached our target area at 65.15–64.13, the buying zone, and has already found support there. From this zone, we expect buyers to step in and push Silver higher, with the potential for a further rally toward new highs.


SILVER Elliott Wave 1 Hour Chart 09.23.2026​

The price rallied as expected and made a new short-term high, confirming a bullish structure within the cycle from the 62.3 low. We now expect a 3-wave pullback to develop. The key level to watch is the B red low at 64.58. As long as this pivot holds, further upside can be seen in the C red leg.

Keep in mind that the market is dynamic, and the outlook may have changed in the meantime. Our member Chat Rooms are open 24 hours a day, Monday through Friday, on trading days, providing ongoing expert guidance on market trends and Elliott Wave analysis. Members can ask questions about market structure and technical setups at any time during trading days.


Source: https://elliottwave-forecast.com/co...sd-finds-buyers-after-an-elliott-wave-zigzag/
 
Intercontinental Exchange, Inc., (ICE) provides technology & data to financial institutions, corporations & government entities in the US & globally. It operates through 3 segments: Exchanges, Fixed Income & data services & Mortgage Technology. It comes under financial services sector & trades as “ICE” ticker at NYSE.

ICE proposed ended the larger monthly pullback at $121.79 low (6.29.2026). Above there, it favors rally in ((III)) impulse sequence, which confirms above $191.48 high of 7.29.2025. Buyers can enter the pullback in clear 3, 7 or 11 swings at extremes.

ICE - Elliott Wave Latest 4-Hour View:​

ICE-4H1.jpg

In Monthly, it ended (I) of ((I)) at $38.98 high (2007), (II) at $9.94 (2008), (III) at $139.79 high (2021), (IV) at $88.60 low (2022) & (V) at $191.48 high (2025). Within (V), it ended I at $118.79 high, II at $104.49 low III at $177.45 high, IV at $147.24 low & V at $191.48 high as (V) as ((I)). Below 7.29.2025 high, it placed (a) of ((II)) at $143.17 low (b) as triangle at $161.34 high & (c) at $121.79 low as zigzag structure. Currently, it favors corrective pullback in ((2)) of I of (I) of ((III)) against 6.29.2026 low. It ended ((1)) of I at $164.66 high.

ICE - Elliott Wave Latest Daily View:​

ICE-D1.jpg

Within ((1)), it ended (1) at $138.53 high, (2) at $131.52 low, (3) at $163.39 high, (4) at $156.94 low & (5) at $164.66 high. Below ((1)) high, it favors lower in (A) of ((2)) & expect one more push lower to finish it. It ended 1 of (A) at $154.95 low, 2 at $163.94 high, 3 at $152.08 low 4 at $157.22 high. It expects 5 of (A) to extend towards $150.92 - $148.98 area to end it before bounce in (B) connector. Later it should extend lower in (C) leg in extreme area to finish ((2)) against June low. Buyers/Investors can enter there for next rally or at least 3 swings bounce against July-2025 high. Until it breaks above July-2025 high, it still can do larger double correction, if breaks below $121.79 low in alternate scenario.

Source: https://elliottwave-forecast.com/stock-market/intercontinental-ice-analysis-ready-multi-year-rally/
 
Hello fellow traders,

Our Elliott Wave analysis has identified several well-defined trading setups recently, including the SPY ETF setup discussed below. The analysis showed a three-wave correction developing from the recent peak, with price eventually approaching the Equal Legs area marked as our Blue Box buying zone.

This is the type of setup we closely monitor within our trading service. The Blue Box highlights a specific area where we look for a potential long entry, while the Elliott Wave structure provides a framework for managing risk and identifying potential targets.

In the following sections, we will break down the SPY setup and show how the opportunity developed.

SPY Elliott Wave 4-Hour Chart – 09.09.2026​

SPY is forming a three-wave pullback from the recent high, and the correction still appears to be incomplete. The current view suggests that only the first leg, wave ((w)), has been completed. We expect another leg lower toward the 754.14 -741.73 area.

At this stage, we are not looking to sell SPY. Instead, our focus remains on the long side. With the broader trend still bullish, we expect buyers to potentially step in around the marked Blue Box area. From there, SPY could develop at least a three-wave bounce, with the potential to extend higher and eventually challenge new highs.

A break below the 1.618 Fibonacci Extension at 741.73 would invalidate this setup.

This is the type of opportunity we monitor for our members: a clearly defined buying zone, a specific invalidation level, and a structured plan for managing the trade as price develops.

Rather than chasing the market or trying to predict every short-term move, our members can follow these setups as they unfold and use clearly defined levels to manage the trade.


The official trading strategy for identifying 3, 7, and 11 swings and Equal Legs setups is explained in detail in our educational video. The video is available exclusively to members inside the membership area.

How to Read Our Charts​

  • Red bearish stamp + Blue Box = Selling setup
  • Green bullish stamp + Blue Box = Buying setup
  • Black stamp = No trade zone


SPY Elliott Wave 4-Hour Chart – 09.23.2026​

SPY reached the Blue Box buying area and buyers stepped in, triggering the expected recovery. The ETF has since posted a strong rebound, and we now consider the correction complete at the 749.70 low.

As long as this low holds, the current structure favors further upside, with SPY potentially pushing toward fresh highs. A break below 749.70, however, would suggest that the correction may not be finished. In that case, we would allow the structure to develop further before looking for the next setup.

Keep in mind that the market is dynamic, and the view presented here may have changed in the meantime. Follow our latest charts, trading setups, and target levels inside our membership area.

The best instruments to trade are those with incomplete bullish or bearish swings. These setups are highlighted in our Sequence Report, while the highest-conviction opportunities are presented in the Live Trading Room.


Source: https://elliottwave-forecast.com/etfs/spy-etf-blue-box-buying-zone-delivers-another-rally/
 
Global Payments Inc. (NYSE: GPN) continues to show a constructive long-term Elliott Wave structure on the monthly chart. Despite the significant decline from its 2021 peak, the broader price structure suggests that the stock may still be developing within a larger bullish cycle. The long-term Elliott Wave count began with cycle wave I and wave II in the early 2000s, followed by a prolonged advance into wave III, which peaked around 2006. A complex corrective phase followed, eventually completing wave IVaround 2013. From that low, Global Payments accelerated higher within wave V, developing a strong five-wave structure that culminated near the $200–$210 area around 2021.

Since that peak, GPN has entered a substantial corrective sequence. The current count labels this decline as part of cycle wave (II), with the correction developing through a complex combination structure.

GPN_2026-09-25_06-02-59-scaled.png

GPN Wave II Correction Could Lead to a Larger Rally​

The current Elliott Wave projection suggests that the correction may continue before the next major bullish cycle begins. The chart shows an expected sequence involving waves ((W)), ((X)), and ((Y)), with wave ((X)) potentially producing a recovery toward the $120–$130 area before another decline in wave ((Y)). The projected completion of cycle wave II could occur in the $35–$45 region, although the exact endpoint will depend on the internal wave development. From there, the chart projects a powerful recovery and a potential new long-term impulsive advance.

The broader Elliott Wave structure remains constructive while the larger count stays intact. GPN’s current correction is therefore being monitored as a potential larger-degree wave II before the next major bullish phase develops.

Summary​

Global Payments (NYSE: GPN) remains constructive on the larger timeframe, with wave II still developing after the 2021 peak. The correction could extend toward the $35–$45 region before a potential new long-term bullish advance begins.

Source: https://elliottwave-forecast.com/st...nts-elliott-wave-analysis-wave-ii-correction/
 
Hello fellow traders. Our Elliott Wave analysis has identified several high-quality trading setups recently, including the SPX setup discussed below. The analysis identified a clear three-wave correction from the recent peak, with price eventually reaching the Equal Legs area highlighted as our Blue Box buying zone.

This is the type of setup we closely monitor within our trading service. The Blue Box defines a specific area where we look for a potential long entry, while the Elliott Wave structure helps us manage risk and identify potential targets.In the following sections, we will break down the SPX setup and show how the opportunity developed.

SPX Elliott Wave 1-Hour Chart – 09.09.2026​

SPX is forming a three-wave pullback from the recent high, and the correction still appears incomplete. We expect another leg lower toward the 7545–7416 area.

At this stage, we are not looking to sell SPX. Instead, our focus remains on the long side. With the broader trend still bullish, we expect buyers to step in around the marked Blue Box area. From there, SPX could start at least a three-wave bounce, with the potential to extend higher and eventually make new highs. A break below the 1.618 Fibonacci Extension at 7416 would invalidate this setup.

This is the type of opportunity we look for every day for our members: a defined entry zone, a clear invalidation level, and a plan for managing the trade as the market moves in our favor.

Instead of chasing price or guessing where to enter, our members can follow these setups as they develop in real time.

The official trading strategy for identifying 3, 7, and 11 swings and Equal Legs setups is explained in detail in our educational video. The video is available exclusively to members inside the membership area.

How to Read Our Charts​

  • Red bearish stamp + Blue Box = Selling setup
  • Green bullish stamp + Blue Box = Buying setup
  • Black stamp = No trade zone


SPX Elliott Wave 1-Hour Chart – 09.24.2026​

The Index dropped into our buying zone (Blue Box) and found buyers as expected. The reaction from the zone delivered a solid bounce, and we now consider the correction complete at the 7507.44 low.

Our expectation is for SPX to continue higher and eventually break to new highs, with 7890 as the next target area.

However, a break below the latest low would open the door to a deeper correction. In that case, we would wait for the pullback to develop and look for a new trading opportunity.

You can follow the latest SPX charts, trading setups, and target levels inside our membership area. The best instruments to trade are those with incomplete bullish or bearish swings. These setups are highlighted in our Sequence Report, while the highest-conviction opportunities are presented in the Live Trading Room.

Keep in mind that the market is dynamic, and the outlook may have changed in the meantime. Our member Chat Rooms are open 24 hours a day, Monday through Friday, on trading days, providing ongoing expert guidance on market trends and Elliott Wave analysis. Members can ask questions about market structure and technical setups at any time during trading days.

​

Source: https://elliottwave-forecast.com/in...e-another-trading-setup-presented-to-members/
 
Hello traders. Back in March, QQQ reached a technical area we had been monitoring closely and presented the setup to our members. The ETF has since extended higher, gaining more than 26% and reaching new all-time highs. Now that the move has developed, it is worth going back to the original setup and reviewing what the Elliott Wave structure was showing at the time. Below, we walk through the daily chart and explain how the Blue Box helped define the potential entry and invalidation level.

QQQ Elliott Wave Daily Chart — 03.22, 2026​

At the time, QQQ was correcting from its previous peak in a Double Three pattern. Our analysis suggested that the correction was getting close to an important turning point rather than starting a larger bearish move. The decline reached the 580.13–545.14 area (Buying Zone), which was an important Equal Legs and Fibonacci zone. We marked this area as a Blue Box and expected buyers to appear.

The trade risk was clearly defined below the setup. The 1.618 Fibonacci extension at 545.14 was the invalidation level. After QQQ moved higher and recovered 50% of the decline from the blue (X) peak, the stop could be moved to breakeven, making the trade risk-free.

The same framework can be applied to other corrective structures. Our methodology for identifying 3, 7, or 11 swing patterns and Equal Legs, including how we define the entry and invalidation levels, is covered in detail in our educational video.

Our official trading strategy for How to Trade 3, 7, or 11 Swings and Equal Legs is explained in detail in an educational video available to members inside the membership area.


Quick reminder on how to trade our charts :

Red bearish stamp+ blue box = Selling Setup
Green bullish stamp+ blue box = Buying Setup
Charts with Black stamps are not tradable.
1f6ab.svg


QQQ Elliott Wave Daily Chart — 09.21. 2026​

QQQ completed the correction inside our Blue Box buying zone, where buyers stepped in as expected. The ETF then turned higher and continued to rally, reaching new all-time highs. In less than six months, the move resulted in a gain of approximately 26%.

Keep in mind that the market is dynamic, and the outlook may have changed in the meantime. Our member Chat Rooms are open 24 hours a day, Monday through Friday, on trading days, providing ongoing expert guidance on market trends and Elliott Wave analysis. Members can ask questions about market structure and technical setups at any time during trading days.


This type of market analysis can be useful across different trading styles and time horizons. Active traders can use our intraday and short-term setups to monitor potential opportunities throughout the trading week. Swing traders can focus on larger corrective structures and key technical levels, while longer-term investors can use the analysis to identify areas where a market may offer a more attractive entry after a significant correction.

The goal is not to predict every market move, but to provide a structured view of price action, important technical levels, and potential risk areas. This allows each trader or investor to apply the analysis according to their own strategy, timeframe, and risk management.

Source: https://elliottwave-forecast.com/et...m-our-blue-box-entry-in-less-than-six-months/
 
Goldman Sachs (NYSE: GS) is down 20% from its peak. Investors now wonder if the stock has entered a bear market. In today's article, we examine the current Elliott Wave structure unfolding. Our analysis explains the bullish case supporting a resumption of the uptrend.

GS marked the wave III peak on July 15, 2026, at $1154. Then, it started a corrective decline in wave IV.

The current move from the peak unfolds within a seven-swing structure. This pattern is labeled as a double three (W-X-Y). Wave ((W)) ended at $977, followed by wave ((X)) at $1077. Now, wave ((Y)) remains in progress. The internal short-term structure of wave ((Y)) suggests a zigzag A-B-C pattern. Wave C aims to reach the main Blue Box at the equal legs area $898 - $788 .

This extreme buying area should trigger a market reaction higher. Consequently, Goldman Sachs bulls should enter within this zone. They will create a bullish reaction in the coming weeks. This move should resume the uptrend within wave V toward new all-time highs.

However, until the stock breaks above the July peak, downside risk remains. It could turn lower again after a three-wave bounce instead of the new bullish impulsive five-wave advance. An 11-swing correction to the downside would then unfold within wave IV. That move would create the next buying opportunity.

Goldman Sachs (GS) 8 Hour Chart 9.29.2026​

Goldman Sachs GS 8H Chart 9.29.2026​

Source: https://elliottwave-forecast.com/stock-market/goldman-sachs-gs-buying-zone-below-1000/
 
Wall Street remains generally constructive on AT&T (T) heading into year-end. Investing.com shows 16 Buy, nine Hold, and one Sell rating. The average 12-month target stands near $29.05, above the recent $24.90 price. Moreover, Morgan Stanley raised its target from $27 to $28 on September 28. BNP Paribas also upgraded AT&T to Outperform and raised its target to $30. Therefore, analysts broadly expect additional upside, although some firms remain cautious.

Fundamentally, investors will focus on AT&T’s October 21 earnings and fourth-quarter cash generation. Management still expects more than $18 billion in 2026 free cash flow. Additionally, AT&T expects strong year-over-year free cash flow growth during the fourth quarter. Fiber and wireless growth should remain important catalysts, while share repurchases could provide further support. However, higher leverage and legacy-business weakness remain risks. Overall, current analyst sentiment supports the bullish technical outlook into year-end.

Elliott Wave Outlook: AT&T (T) Weekly Chart July 12th, 2026

Elliott Wave Outlook: AT&T (T) Weekly Chart July 2026


In our July forecast, we expected AT&T (T) to complete wave II within the 20.95–18.32 support area. We also expected that zone to provide the base for the next bullish move. However, we noted that the flat correction could extend deeper before turning higher. Therefore, a decline toward the 1.618 extension at 18.32 remained possible.


Elliott Wave Principle Behind the Market Structure​

Impulse​

An impulse is a clean 5‑wave pattern that drives the trend forward.

  • Waves 1‑3‑5 are strong and directional.
  • No overlap between waves 1 and 4.
  • Wave 3 is usually the strongest.
  • Structure is clear, with increasing momentum.

Impulse
​

Elliott Wave Outlook: AT&T (T) Weekly Chart September 28th 2026

Elliott Wave Outlook: AT&T (T) Weekly Chart September 28th 2026


AT&T (T) reacted higher from the expected support area projected. The rally completed wave (1) near the 26.00 area. Since then, the stock has started a corrective wave (2). The chart favors an ABC structure for this pullback. Wave A can decline toward the 23.00 area before wave B produces a corrective bounce. Then, wave C can resume lower and complete wave (2) near the 20.95 area.

As long as price stays above the wave II low, we expect the bullish sequence to continue. AT&T should eventually break above the wave I high near 30.00. However, a break below the wave II low would open the door to a larger double correction. That correction could extend toward 18.32 or lower. Still, the long-term structure remains bullish while price stays above 13.51.

Source: https://elliottwave-forecast.com/stock-market/att-t-eyes-30-after-key-elliott-wave-support-holds/
 
Assurant Inc. (NYSE: AIZ) is currently approaching a critical support zone, signaling the potential conclusion of a two-month bearish correction. As the stock tests this key level, it appears poised to resume its primary long-term bullish trend.

About AIZ​

Assurant Inc. (NYSE: AIZ) is a leading global provider of risk management and insurance solutions, serving the housing and lifestyle markets. Headquartered in Atlanta, it operates across Global Housing and Global Lifestyle segments, offering products such as mobile device protection, vehicle service contracts, and renters insurance. With operations in over 20 countries, Assurant partners with major financial institutions and retailers, leveraging data-driven innovation to deliver consistent growth and strong shareholder value.

AIZ Long Term Elliott Wave Analysis – Weekly Chart​

The all-time bullish cycle for AIZ began in November 2008 at $12.52. From that low, wave (I) advanced in a clear impulse and peaked in February 2020 at $146.21. It was followed by a sharp correction - wave (II). Wave (II) ended in March 2020 at $76.26. From there, wave (III) is expected to extend higher, with an overall target between $287 and $417. Between March 2020 and April 2022, price completed another impulse wave structure which we can identify as wave I of (III). After that, a 7-swing pullback followed for wave ((II)) which ended in March 2023.

AIZ


Following the March 2023 lows, wave III commenced, completing a clear five-swing impulse structure for wave ((1)) of III in November 2024. This was followed by a seven-swing pullback for wave ((2)) of III, which concluded in April 2025. As shown on the weekly chart, wave ((3)) is currently in progress. Based on Fibonacci technical projections, wave ((3)) could advance toward the $331–$379 range, pointing to a broader wave (III) cycle target of $417. These projections indicate significant bullish potential, suggesting that investors and traders should continue to buy the dips, as every bearish cycle presents a new opportunity for a trade.

AIZ Long Term Elliott Wave Analysis – Daily Chart​

AIZ


The stock has entered a pullback phase after peaking at $303.90 in August 2026. As illustrated on the daily chart, this decline is unfolding as a simple zigzag structure. Wave ((a)) of 4 completed an impulse, followed by a sideways triangle for the wave ((b)) connector. Currently, wave ((c)) is developing as an impulse to finalize wave 4. We identify the 258.14–239.88 range as a blue box support zone where wave 4 can conclude. From this zone, the stage will be set for wave 5 of (3). Should the stock respect this support, we anticipate a recovery that pushes prices above the $300 level, targeting the $320–$330 range.

Following the completion of wave 5 of (3), a wave (4) pullback is expected to initiate a new bearish cycle. Once this correction reaches its extreme, traders and investors can look for buying opportunities within the blue box support zone to capitalize on the subsequent trend.

Source: https://elliottwave-forecast.com/stock-market/aiz-elliott-wave-trade-setup/
 
Hello, fellow traders. In this technical article, we’ll take a quick look at the Elliott Wave charts of Gold (XAUUSD), recently published in the members’ area of our website.

As our members know, GOLD has been declining within the cycle that started from the August peak at 4698.17. Price has now reached the extreme zone and is already showing a reaction from the area.In the following sections, we will walk through the setup and show how we forecasted the path.

XAUUSD Elliott Wave 4 Hour Chart 09.24.2026​

XAUUSD is forming a three-wave pattern from the recent August peak at 4698.17. At the moment, the structure of the pullback appears incomplete, suggesting that further downside could be seen before the next bounce develops. As our members know, the reversal zone is identified by measuring the Equal Legs area using the Fibonacci Extension tool, measuring A relative to B. The ideal target area comes in at 4112.6–4014.2.

From this zone, we expect buyers to step in and take control, potentially driving the price higher in at least a three-wave bounce.

90% of traders fail because they don’t understand market patterns. Are you in the top 10%? Put your skills to the test with this advanced Elliott Wave challenge.

Reminder : Our member chat rooms are open 24/7 and provide ongoing expert guidance on market trends and Elliott Wave analysis. Members are encouraged to ask questions about market structure and technical setups at any time. You can learn more about Elliott Wave Patterns at our Free Elliott Wave Educational Web Page


XAUUSD Elliott Wave 4 Hour Chart 09.24.2026​

GOLD declined as expected and reached the extreme zone at 4112.6–4014.2. The commodity found buyers right at the Equal Legs area, producing a reaction from the zone. At this stage, it is still too early to determine with high confidence whether the cycle has already been completed. The preferred view suggests that the cycle is taking the form of an Elliott Wave Zig Zag pattern, meaning we could potentially see another low to complete five waves within the red C leg. For now, we will continue monitoring the structure and the reaction from the current area.

Keep in mind that the market is dynamic, and the outlook may have changed in the meantime. Our member Chat Rooms are open 24 hours a day, Monday through Friday, on trading days, providing ongoing expert guidance on market trends and Elliott Wave analysis. Members can ask questions about market structure and technical setups at any time during trading days.


Source: https://elliottwave-forecast.com/commodities/gold-xauusd-elliott-wave-price-reaches-equal-legs/
 
Hello fellow traders,

As our members know, we have identified a number of interesting trading setups recently, including the XLV ETF setup. Our Elliott Wave analysis identified a clear three-wave correction from the recent peak, with price eventually reaching the Equal Legs area marked as our Blue Box buying zone.

The Blue Box defines an important area where we look for a potential entry, while the Elliott Wave structure helps us assess the setup, manage risk, and identify potential targets.

In the sections below, we will take a closer look at the XLV setup and walk through how the opportunity developed.


XLV Elliott Wave 4 Hour Chart – 9.9.2026​

The Health Care Select Sector SPDR Fund (XLV) is showing a clear three-wave pullback from the recent high. Price has now reached our Blue Box buying zone at 167.09–162.48, marking an important area to enter the long side. At this stage, we do not favor selling XLV. Our focus remains on the long side, as the broader trend is still bullish. From the Blue Box area, we expect XLV to have an opportunity to start at least a three-wave bounce. If the bullish structure remains intact, the ETF could extend higher and eventually challenge new highs.

The setup also comes with a clearly defined risk-management plan. If the expected bounce reaches the 50% Fibonacci retracement against the black ((b))-wave high, we can move the stop loss to breakeven while taking partial profits. A break below the 1.618 Fibonacci Extension at 162.40 would invalidate the setup.

This is the type of opportunity we look for every day for our members: a clearly defined entry zone, a specific invalidation level, and a plan for managing the trade once the market starts moving in our favor.

Instead of chasing price or guessing where to enter, our members can follow these setups as they develop in real time.

The official trading strategy for identifying 3, 7, and 11 swings and Equal Legs setups is explained in detail in our educational video. The video is available exclusively to members inside the membership area.


XLV Elliott Wave 4 Hour Chart – 9.29.2026​

The ETF found buyers as expected. As a result, long positions taken from this zone are now risk-free, with the stop loss moved to breakeven.

The primary view suggests we may still see a double correction within the blue wave (2). Regardless, we will keep the remaining position open to capture further profits in case the alternative path takes place. The main view remains bullish, and while the proposed double correction is the preferred scenario at this stage, it may or may not develop.

Keep in mind that the market is dynamic, and the outlook may have changed in the meantime. Our member Chat Rooms are open 24 hours a day, Monday through Friday, on trading days, providing ongoing expert guidance on market trends and Elliott Wave analysis. Members can ask questions about market structure and technical setups at any time during trading days.

The best instruments to trade are those with incomplete bullish or bearish swings. These setups are highlighted in our Sequence Report, while the highest-conviction opportunities are presented in the Live Trading Room.


Source: https://elliottwave-forecast.com/etfs/xlv-elliott-wave-another-trading-setup-explained/
 
Taiwan Semiconductor (NYSE: TSM) maintains its bullish cycle from the 2022 low. Bulls continue to seek further upside extension. In today's article, we examine the current Elliott Wave structure unfolding. Our analysis highlights the potential for higher targets ahead.

TSM shows an impulsive advance from its 2022 low. Wave I peaked at $226, followed by a wave II pullback to $134. Currently, wave III remains in progress and enters its final stage. The internal cycle of this rally also shows a three-wave advance. Wave ((3)) ended at $479. Then, a pullback in wave ((4)) reached $372 in August 2026.

As long as this low holds, the stock should continue rallying in wave ((5)). It will target the $504 - $545 area. That zone will likely see some profit-taking. It could also mark the wave III peak. Following that, another pullback will occur within wave IV. Then, the rally will resume again.

Consequently, TSM's weekly cycle remains supported to the upside. The bullish sequence suggests further extension. Buyers will keep seeking entries within daily pullbacks. These will form as 3, 7, or 11 swings within the main trend.

TSM Weekly Chart 9.30.2026​

TSM Weekly 9.30.2026

Source: https://elliottwave-forecast.com/stock-market/taiwan-semiconductor-tsm-aiming-for-a-break-above-500/
 
Hello fellow traders/ Silver ($XAGUSD) has recently moved lower as part of the corrective cycle that started from the August high at 71.20. The current price action is giving us an interesting Elliott Wave structure, which we will examine in this analysis.

Before looking at the current market setup, let’s briefly review the Elliott Wave Zig Zag pattern and how it can help us identify potential areas where a correction may reach completion.

Elliott Wave Zigzag is the most popular corrective pattern in Elliott Wave theory . It’s made of 3 swings which have 5-3-5 inner structure. Inner swings are A,B,C where A =5 waves, B=3 waves and C=5 waves. That means A and C can be either impulsive waves or diagonals. (Leading Diagonal in case of wave A or Ending in case of wave C) . Waves A and C must meet all conditions of being 5 wave structure, such as: having RSI divergency between wave subdivisions, ideal Fibonacci extensions and ideal retracements.


​

XAGUSD Elliott Wave 4 Hour Chart 09.24.2026​

Silver is showing a corrective cycle from the August 28 peak, with the price action currently developing as an Elliott Wave Zig Zag pattern. The initial decline from the peak unfolded in five waves, forming wave ((a)), followed by a three-wave corrective bounce in wave ((b)). This structure supports the view that the cycle is taking the form of an Elliott Wave Zig Zag pattern, which is not yet complete.

Our preferred count suggests that Silver is now developing the final wave ((c)) lower. If the structure continues as expected, wave ((c)) should unfold in five waves and eventually reach the Equal Legs area at 60.41–58.53, where the correction could potentially find support.

Official trading strategy on How to trade 3, 7, or 11 swing and equal leg is explained in details in Educational Video, available for members viewing inside the membership area.

​

XAGUSD Elliott Wave 4 Hour Chart 09.29.2026​

Silver declined as expected and reached the extreme zone at 60.41–58.53. The commodity has already produced a short-term bounce from the Equal Legs area. However, so far, we can only count three waves within the ((c)) leg, suggesting that the cycle remains incomplete. The preferred view still suggests that the cycle is unfolding as an Elliott Wave Zig Zag pattern. Therefore, we could potentially see at least one more low to complete the five-wave structure within the ((c)) leg.

For now, we will continue to monitor the internal structure and the reaction from the current area.

Keep in mind that the market is dynamic, and the outlook may have changed in the meantime. Our member Chat Rooms are open 24 hours a day, Monday through Friday, on trading days, providing ongoing expert guidance on market trends and Elliott Wave analysis. Members can ask questions about market structure and technical setups at any time during trading days.

​

Source: https://elliottwave-forecast.com/el...sd-elliott-wave-tracking-a-potential-zig-zag/
 
Launched in 2010, the Global X Silver Miners ETF (SIL) provides investors with diversified exposure to leading silver mining companies worldwide. By tracking the Solactive Global Silver Miners Total Return Index, it offers a straightforward entry into the sector through a single trade. The fund has become a useful vehicle for those seeking to participate in the performance of the broader silver mining industry without the need to select individual stocks.

SIL (Silver Miners ETF) Monthly Elliott Wave Chart​


SIL-Monthly20260930165758.jpg


On the monthly Elliott Wave chart, SIL registered a new all‑time high in January, reinforcing a bullish outlook. A major low was established in January 2016 at $14.94, identified as Grand Super Cycle wave ((II)). From this foundation, the ETF advanced into the nesting phase of wave ((III)). The initial rally in wave I reached $54.34, followed by a corrective decline in wave II that bottomed at $16. The ETF then surged in wave ((1)) to $52.87, with the subsequent retracement in wave ((2)) ending at $21.26. A powerful advance in wave ((3)) carried prices to $119.24. The pullback in wave ((4)) is proposed complete at $69.68, after which the ETF resumed higher. A decisive break above $119.24 remains necessary to confirm continuation of the larger bullish cycle.


Silver Miners ETF Daily Elliott Wave Chart​


SIL-Daily20260930170941.jpg


On the daily chart, wave ((3)) has concluded, with wave ((4)) completing at $70.04 in a double three structure. From this low, SIL turned higher into wave ((5)). Within the rise, wave (1) peaked at $104.49. A retracement in wave (2) is unfolding, with potential support between $73.10 and $82.50, defined by the 100%–161.8% extension of wave W. This zone is expected to attract buyers and set the stage for the next upward leg.

Source: https://elliottwave-forecast.com/elliott-wave/silver-miners-sil-looking-for-a-double-correction/
 
In this Elliott Wave update, we examine the long-term structure in the Invesco S&P 500 Equal Weight Energy ETF ($RSPG). The ETF continues to display a strong impulsive structure from the March 2020 low, while the April 2025 low created another important bullish nest within that larger cycle.

More recently, $RSPG completed another 5-wave advance and has started a corrective pullback. Once that correction runs its course, the nested Elliott Wave structure should support another strong leg higher, with $130+ becoming the next major upside objective.

$RSPG​

Looking at the weekly chart, $RSPG established a major low in March 2020 and began a new long-term bullish cycle.

The advance from that low developed impulsively rather than as a corrective bounce. A sequence of higher highs and higher lows formed through multiple degrees of Elliott Wave structure, confirming that buyers remained in control of the larger trend.

This impulsive behavior is important because it suggests the rally from 2020 represents part of a larger bullish cycle rather than simply a temporary recovery.

March 2020 Low Created the First Major Nest​

From the March 2020 low, $RSPG completed an initial wave ((1)) advance before pulling back in wave ((2)).

The ETF then resumed higher and continued to build additional impulsive waves. This wave 1–2 structure created the first important bullish nest within the larger sequence.

From there, price accelerated substantially higher as the nested third-wave structure unfolded.

April 2025 Low Created the Second Nest​

The next major development came during the correction into April 2025.

$RSPG declined in an A-B-C corrective structure and completed another important wave II low. Rather than damaging the larger bullish trend, this correction created another wave 1–2 relationship at a higher degree.

Therefore, the March 2020 and April 2025 lows now form a double-nest structure.

This setup is significant because nested 1–2 formations often precede some of the strongest portions of an Elliott Wave advance. Once the smaller-degree corrections finish, several third waves can begin unfolding together and create stronger upside momentum.

Five Waves Up From April 2025 Are Complete​

Following the April 2025 low, $RSPG turned sharply higher and developed another clear 5-wave impulsive sequence.

Waves (1) through (5) pushed the ETF toward the recent high near the $120 area and completed wave ((1)).

As a result, a correction against that rally is now due. The preferred Elliott Wave path calls for the current decline to develop as an A-B-C correction in wave ((2)) before buyers return.

Importantly, this pullback should be viewed within the context of the larger bullish double nest rather than as the start of a new bearish trend.

Wave ((2)) Pullback Should Set Up the Next Rally​

The current correction can continue to develop in three swings.

Wave (A) represents the first move lower, followed by a corrective bounce in wave (B). Afterward, another decline in wave (C) can complete wave ((2)).

Once that structure finishes, $RSPG should be positioned to start the next impulsive advance.

This is where the double nest becomes particularly important. A completed wave ((2)) would leave several bullish degrees aligned to the upside, creating the conditions for stronger acceleration.

$130+ Becomes the Next Major Objective​

After the current correction finishes, the next bullish cycle should take $RSPG back toward the recent high and eventually beyond it.

The weekly chart supports an advance toward $130+ as the next meaningful upside objective.

A break above the previous high would confirm that the next impulsive sequence is underway and strengthen the case for continued upside beyond $130 over time.

Therefore, short-term weakness should primarily be viewed as a corrective reset before the larger bullish trend resumes.

Bigger Picture Remains Bullish​

The larger Elliott Wave structure remains constructive.

$RSPG has developed an impulsive advance from the March 2020 low, followed by another important nested structure from the April 2025 low. More recently, another five-wave rally has reinforced the bullish character of the sequence.

Consequently, once the current wave ((2)) correction completes, the next leg higher should have room to accelerate.

The long-term bullish structure remains valid above the 15.91 invalidation level, keeping the broader right side pointed higher.

Technical Summary​

To summarize, $RSPG continues to display an impulsive bullish structure from the March 2020 low.

The March 2020 cycle established the first major bullish nest, while the April 2025 low created another wave II correction and completed the second nest.

From April 2025, $RSPG rallied in another 5-wave impulse, which now appears complete in wave ((1)). The ETF is currently expected to correct that advance in wave ((2)).

Once this pullback finishes, the double-nest structure should support another strong bullish leg, with $RSPG expected to challenge its previous high and extend toward $130+ in the next phase of the advance.

Video Analysis​

[video width="1920" height="1080" mp4="[URL]https://elliottwave-forecast.com/wp-content/uploads/2026/09/Debut-2026-09-30-12_18_05.mp4[/URL]" poster="[URL]https://elliottwave-forecast.com/wp-content/uploads/2026/09/rspg.png[/URL]"][/video]

Source: https://elliottwave-forecast.com/vi...2020-and-april-2025-sets-up-rally-toward-130/