"The near-term balance of risk appears to favor JPY strength."
– Scotiabank (based on FXStreet)
Pair's Outlook
The USD/JPY pair's behavior fell in line with expectations yesterday, as the exchange rate remained relatively unchanged and no level of significance was pierced. Technically, the Greenback should rebound today, with the weekly S1 providing the required bullish momentum, but with the immediate resistance, namely thee 55-day SMA and the weekly PP, still remaining intact. On the other hand, technical indicators suggest the given pair is to decline today, which would make it the fifth consecutive drop. Poor ADP figures today could be the catalyst for a possible loss, however, it should not exceed 50 pips.
Traders' Sentiment
There are 53% of traders holding short positions today, compared to 57% on Wednesday. At the same time, the share of sell orders edged significantly higher, namely from 45 to 70%.
"Investors around the world are seeking safe havens ahead of tomorrow's Non-Farm payrolls and into next week's U.K. elections which have gone from a one horse race to an emotionally close one if you believe the polls."
– Market Pulse (based on Investing.com)
Pair's Outlook
The yellow metal has started this trading session with slight losses against the US Dollar. The pair is kept between the weekly R1 and the weekly PP at 1,275.49 and 1,261.80, respectively, leaving enough potential to trade either way. Contrary to the bearish momentum in the morning, the base scenario favours the pair trading higher, aiming fort the 1,275.49 mark. This assumption is likewise confirmed by bullish technical indicators. Nevertheless, it is not expected that the rate manages to push above this the weekly PP.
Traders' Sentiment
SWFX traders have increased their bullish sentiment, as 52% of open positions are long. In addition, 58% of set up orders are to buy the metal—a slight decrease from 59% on Wednesday.
"The euro retained its resilience and stayed close to an one-week high hit during the Asia session despite softer manufacturing data out of France and Italy."
– Vassilis Karamanis, Bloomberg
Pair's Outlook
On Friday morning the common European currency traded in the range of the previous trading session against the US Dollar. Namely, the currency exchange rate was located just above the support of the weekly PP, which is located at the 1.1204 level. Meanwhile, it faced the resistance, which kept the pair from surging on Thursday, in the form of the weekly R1 at the 1.1248 mark. From a technical perspective on the daily chart it looks like the pair will break out to the upside. The reason for such a hypothesis is the fact that the weekly PP is supported by the close by located 61.80% Fibonacci retracement level at the 1.1190 level.
Traders' Sentiment
SWFX traders remain bearish, as 60% of open positions are short. Meanwhile, 53% of pending orders are to buy the Euro.
GBP/USD attempts to break out from its trading range
"The narrowing in the polls has clearly dented sterling's performance and continues to weigh on the currency, and is probably likely to do so in the near term."
– Barclays (based on Business Recorder)
Pair's Outlook
Thursday ended with the Cable remaining flat, despite downside volatility initially prevailing. The 1.29 major level has proven to be a might foe, as the Pound struggled to climb over it through all of the week. With today's US NFP data due, the GBP/USD pair could breach the broadening rising wedge's support line, leaving the 1.28 psychological demand level to limit the losses. However, technical studies are still unable to confirm this possibility, meaning there is a chance the pair could burst through the 1.29 mark, thus, prolonging the wedge pattern.
Traders' Sentiment
Market sentiment is still neutral, as 51% of all open positions are long. At the same time, the number of orders to acquire the Sterling dropped from 57 to 53%.
"A stronger dollar and firming U.S. equity markets, along with weaker oil are all headwinds that could hamper gold's advance over the short-term."
– Edward Meir, INTL FCStone (based on Reuters)
Pair's Outlook
The yellow metal suffered its biggest losses of the week on Friday morning. Once more the commodity price had retreated below the support of the weekly PP, which is located at the 1,261.80 level. Due to that fact it can be assumed that the metal once more faces the possibility of falling down to the levels near the 1,250 mark. Although, on Friday morning the closest support level after the weekly PP was the 55-day SMA at 1,255.90. However, during the week gold had retreated more than once below the weekly support and rebounded just near the 1,260 level, which might possibly occur once more.
Traders' Sentiment
SWFX traders have decreased their bullish sentiment, as 51% of open positions are long. In addition, 57% of set up orders are to buy the metal—a slight decrease from 58% on Thursday.
After scoring major gains against the US Dollar during the second half of Friday's trading session the common European currency had retreated on Monday morning. The EUR/USD currency pair had jumped on Friday at 12:30 GMT when the worse than expected fundamental US data was released. It is most likely that the currency exchange rate will continue its short decline until it encounters the support of the 55-hour SMA. On Monday morning the SMA was moving higher near the 1.1240 mark, and it was supported by the lower Bollinger band of the hourly chart. In the case of a surge the pair would then begin the ascent to the weekly R1, which is located at the 1.1344 level.
Friday ended with the Cable edging moderately higher, amid the disappointment brought by the US NFP data. The rally caused another confirmation of the two-week down-trend, which now acts as the resistance line of a triangle pattern. This pattern is nearing its apex, with a breakout to occur by mid-Tuesday. The lower border of the triangle is much stronger, as it is a support line of a much larger pattern—the broadening rising wedge. Moreover, it is supported by a larger number of significant levels than the down-trend. Technical indicators are also in favour of the bullish scenario, thus, the GBP/USD pair is likely to take another shot at climbing over the 1.29 mark this week and pierce the resistance around that area, which is represented by the monthly pivot point.
It can be observed on the hourly chart of the EUR/USD currency exchange rate that the pair has found support. It was expected that the rate will reach the 1.13 mark during Monday's trading session. However, that event has been delayed due to the pair changing its direction just above the 1.1280 mark. The fall was concluded when the currency exchange rate encountered the support of the 55-hour SMA and a short term ascending channel pattern's lower trend line near the 1.1240 level. As a result a surge began, which lasted into early Tuesday trading. The target of the 1.13 mark remains in force, as it is expected that the Euro might continue to gain against the Greenback in the next two trading session due to them being quiet in regard to fundamental data releases.
Not only did the rally on Monday cause the two-week down-trend to be pierced, but also help the Cable stabilise above the monthly pivot point. Nevertheless, the GBP/USD pair could still fall under the 1.29 mark in order to retest the up-trend, where the bullish momentum is expected to be reacquired. As a result, a bearish correction today would not be a surprise, but losses are unlikely to exceed yesterday's gains. Overall, technical indicators support the possibility of the bullish trend lasting through the week, at least from the technical perspective. Other factors, such as the elections in the UK on Thursday are also likely to have a serious impact on the Cable's exchange rate, with risks skewed to the downside, as it would confirm the rising wedge's end.
During the early hours of Wednesday's trading session the common European currency remained below the 1.13 mark against the US Dollar. The currency exchange rate fluctuated near the previous range of Tuesday. However, by looking into the charts some differences can be spotted. It can be noted that the pair has revealed that the 20 and 55-hour SMAs just below the 1.1270 level do not have enough supporting strength to keep the rate down from falling and pushing it higher. Instead the rate had retreated down to the combined support of the 100-hour SMA and the lower Bollinger band near the 1.1250 mark. In general, it is highly possible that the pair will remain in the range between the 1.1250 mark and the 1.13 level until the ECB events take place on Thursday.
The Cable experienced minor volatility on Tuesday, with the exchange rate mostly gravitating towards the monthly pivot point.[/ANNOUNCE] Flat trade could indicate that the Pound's bullish momentum is nearing its end, even though technical studies suggest the opposite. In either case, the Sterling is likely to consolidate for another day, with trade anchored around the 1.29 major level and the three-month up-trend remaining a strong support, which is to limit any losses should those occur today. Gains, however, are unlikely to exceed the 1.2940 handle, as the British currency struggled to climb over this area through all of the previous week. Meanwhile, traders retain a neutral outlook towards the GBP/USD pair, as 52% of all open positions are long.
The USD/JPY pair behaved in accordance with expectations yesterday, being that the monthly S1 at 109.22 was the level that managed to prevent the pair from edging lower. Although the monthly S1 managed to limit the losses on Tuesday, risks remain skewed to the downside, meaning that the given demand level could fail today. A breach of this support would open the door for a drop beyond 109.00, with the second closest strong support being only under 108.00. Technical studies do suggest the bearish momentum is to prevail today, but given the latest USD movements, a positive development would not be a surprise. The recovery, however, would just be a bullish correction from the recent declines and could well take place if the given trend-lines prove to be viable.
On Wednesday morning the yellow metal was in a decline down to the 1,290 mark. The reason for that from a technical perspective could be explained by the fact that the commodity price had overextended its gains. Such a fact is hinted by the fact that the only notable resistance, which the metal faced, when it changed its direction, was the upper Bollinger band of the hourly chart. Most likely this is the beginning of a short consolidation, as the metal had been trading in limbo between the various support levels that were providing resistance on Tuesday. Due to these reasons combined the previous target of the weekly R3 near the 1,307 mark remains intact. However, market participants should watch closely, where the rebound occurs.
Although on Thursday morning the common European currency traded against the US Dollar near the previous two trading session levels, which is above the 1.1250 mark, there is an additional detail to the rate. The currency exchange rate plummeted in the hour, which began at 10:00 GMT. The pair fell as low as the 1.12 level, and that event most likely triggered a lot of orders, as during the fall, which was clearly fundamental, the rate retreated below all this week’s relevant levels of significance. However, by 14:00 GMT the Euro was back above 1.1250 mark against the US Dollar. It is most likely that the fundamentals will continue to dictate the pair’s movements during the day, as the ECB is publishing their updated rate and hosting a press conference.
The British Pound continued to outperform the US Dollar on Wednesday, but with gains limited by the newly-formed ascending channel’s resistance line. The channel supports the possibility of the Cable edging lower today, with both trend-lines near 1.29 likely to be retested. The bearish development was long expected, but technical indicators began showing rather strong bullish signals recently, suggesting the channel could be broken to the upside. A continued recovery could suggest the pair is on the path to the larger scale pattern’s resistance line just under the 1.35 mark. However, the Sterling is first required to stabilise above 1.30, as supply around this area kept it away from posting more gains since October 2016.
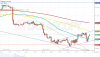
USD/JPY risks falling uder 109.00
As was anticipated, the US Dollar outperformed the Japanese Yen on Wednesday, with the exchange rate nearing the 110.00 mark. Another rally today would confirm the birth of a new ascending channel, but technical indicators imply the Greenback is to sustain heavy losses. The key support is still the monthly S1 at 109.22, which should be sufficient to limit the losses. In case this area fails, the next target would become the trend-line around 108.80. Nevertheless, due to the falling wedge getting pierced to the upside yesterday, a small possibility of the USD/JPY pair resuming its bullish trend exists. On the other hand, no other signs point to a potential recovery, thus, risks remain skewed to the downside.
Attached File(s)
USDJPY ASK 1H since 0015 2017-06-02 to 1752 2017-06-08.png
Gold declines on Thursday
The decline of the yellow metal’s price has extended itself, as the bullion continue to search for a strong enough support level to continue the surge. On Thursday morning the commodity price still remained in the middle of the medium term ascending channel pattern. There the metal faced the resistance of the 55-hour SMA at the 1,289.49 mark, while, meanwhile, being supported by the weekly R1 at 1,286.87. It is highly possible that the bullion will remain below the 1,300 mark until additional support is found. The additional support could come in the form of the 100-hour SMA, which on Thursday morning was located at the 1,282.73 level. In addition, the just mentioned SMA was supported by the lower Bollinger band of the hourly chart.
EUR/USD falls below 1.12 mark
The European Central Bank did not change its policy on Thursday. However, the release of the suspense was enough to cause the reveal of the future direction of the EUR/USD currency exchange rate. The pair began to move lower, as it passed the support of the weekly PP at 1.1227 until it reached the support of the 38.20% Fibonacci retracement level at the 1.1188 mark. By having a glance at the movements of the pair during the past few trading sessions it can be assumed that the rebound from the retracement level is a marking of the first point in a short term pattern. The pattern is most likely going to guide the pair lower to the medium term ascending channel’s lower trend line, which on Friday was close to the 1.1140 level.
GBP/USD plummets after election results
The UK Parliamentary Election results had a devastating effect on the Pound, causing it to trim all previous month’s gains against the Buck. Even though the bearish momentum should now persist, the Sterling still has a chance to undergo a corrective recovery. The RSI indicator is near its lower border, which suggests the bullish trend is about to return. However, no solid supports are present to help achieve this goal, the only nearest one being the monthly S1 at 1.2624. On a larger scale the bearish development is not a surprise, as the breach of the wedge’s support line was anticipated. In case losses do continue to take place, a solid turnaround points are around 1.26 and 1.2550.
USD/JPY to slide back to 110.00
The USD/JPY currency pair confirmed the ascending channel pattern with its recovery from the 109.40 area, with the exchange rate now continuing to test the upper boundary. The trend-line is now also coinciding with the 200-hour SMA, which altogether should cause the Buck to slightly weaken against the Yen, allowing the pair to slide back to 110.00, thus, retesting the pattern’s support line. Technical indicators in all timeframes support this possibility, but before this scenario plays out temporary volatility breaches to the upside could occur, due to yesterday’s excessive USD-buying. The majority, namely 62%, are still buying the Greenback, although it is still far from being overbought, which could mean bad news for the channel, as upside breakout risks emerge.