Volume Profile - Daily Analysis

Trader Dale

Active Trader
Oct 5, 2016
143
13
44
43
Switzerland
www.trader-dale.com
How to do an Intraday VWAP Analysis

In my recent VWAP webinar, I showed two trading setups you can use with the VWAP indicator. One setup which you can use when there is a rotation and the other setup

Today, I would like to show you how you can apply those setups in your trading.
I will demonstrate this on a 60 Minute AUD/JPY chart. I will use a Weekly VWAP – which means that every new week a new VWAP gets calculated anew.

Trend vs. Rotation
The first thing you need to do is to identify whether there is a trend or a rotation. Why? Because in the trend you will want to use the “Trend VWAP setup” and in rotation the “Rotation VWAP setup”.
As I said at the webinar – it is best to use VWAP deviations to identify a trend from a rotation. When deviation (the grey line) moves vertically, then there is a trend. When it moves horizontally, then there is a rotation.
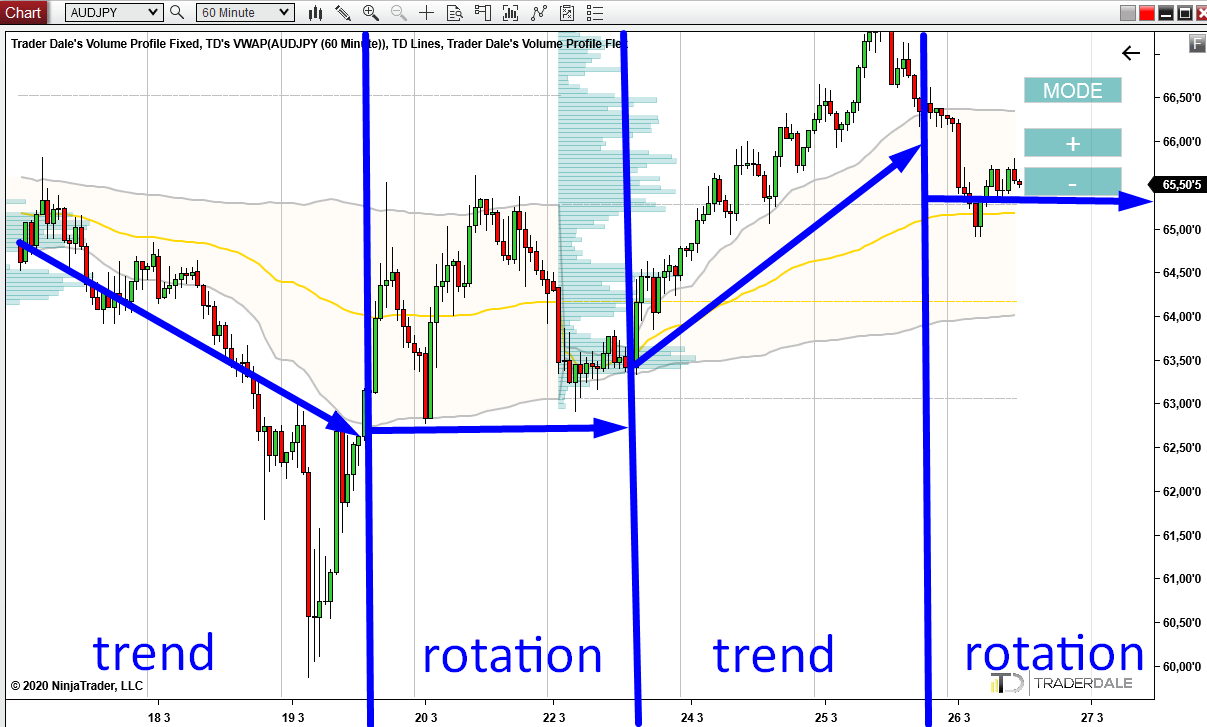
In the picture below, I divided the chart into four sectors.
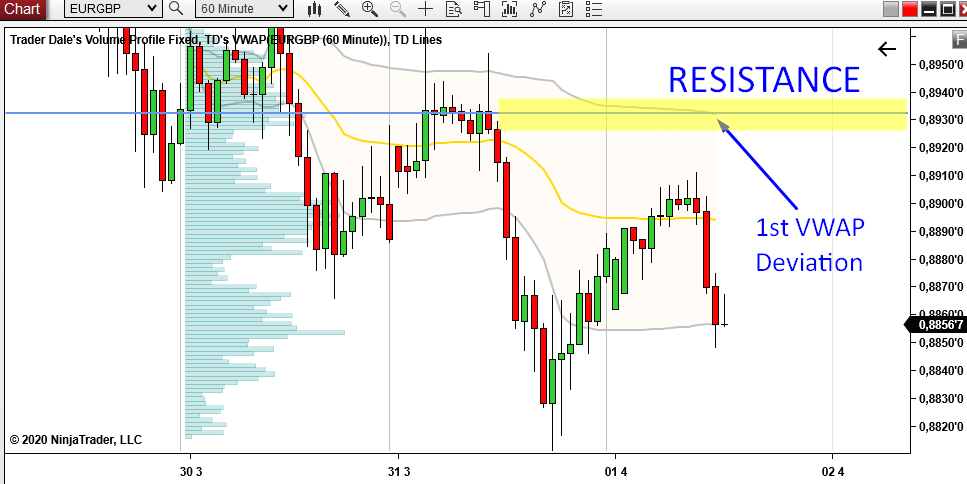
In the first one, the 1st deviation (grey line) moves downwards – so there is a trend and we want to trade the “Trend VWAP setup
In the second section, the 1st deviation moves horizontally. This means there is a rotation and we want to look for the “Rotation VWAP setup“.
The third section shows a trend again, so we want to look only for the “Trend VWAP setup“.
The most recent section shows a rotation, so now I am looking for the “Rotation VWAP setup”.
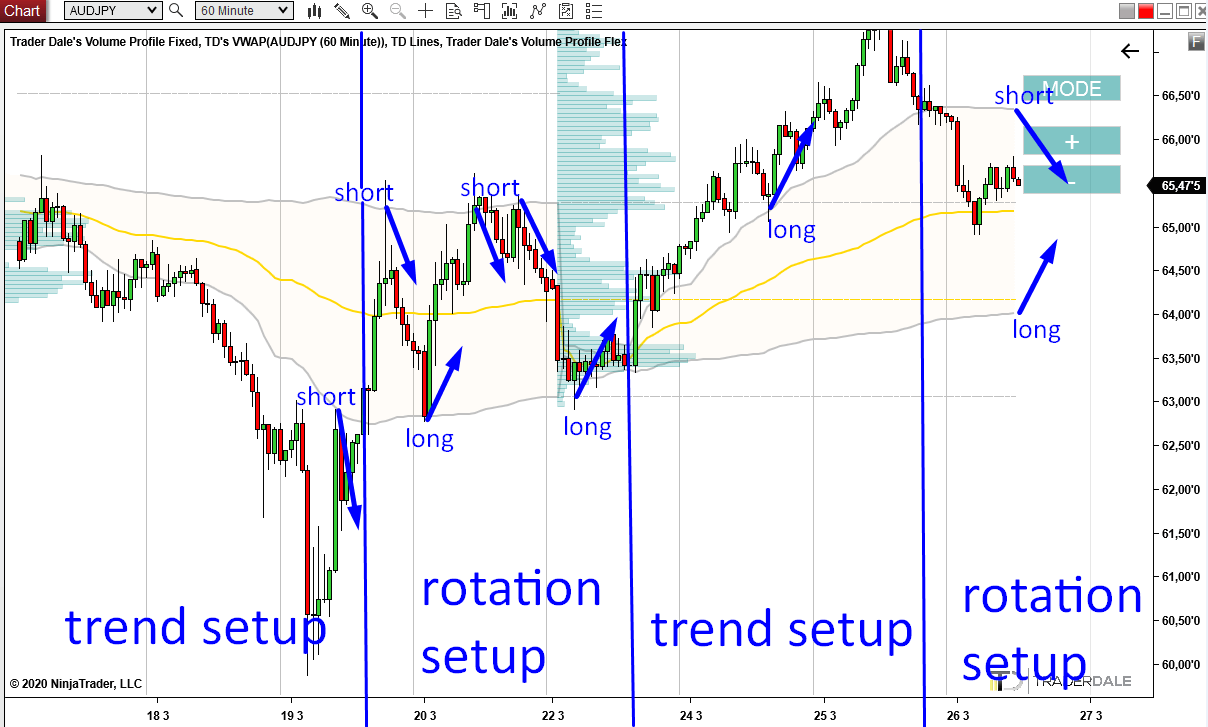


Trade entries
The picture below shows the same chart. This time I indicated possible trade entries. Those trade entries are based on the two VWAP setups.
The first trade is a short and it is based on the “Trend VWAP setup”. Then the second trade is also a short but this time it is based on the “Rotation VWAP setup”. The same goes for the next four trades (all based on “Rotation VWAP setup”). Then the market goes into a trend again so the next trade is a long and it is based on the “Trend VWAP setup”.

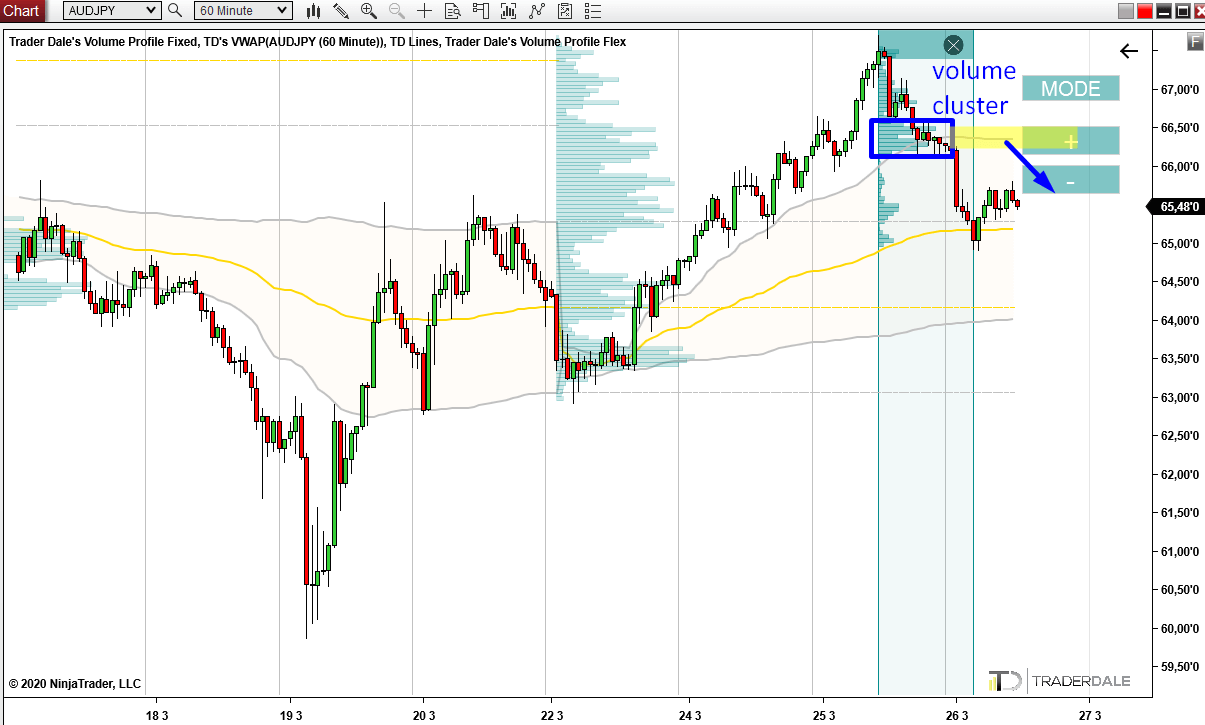
The current rotation
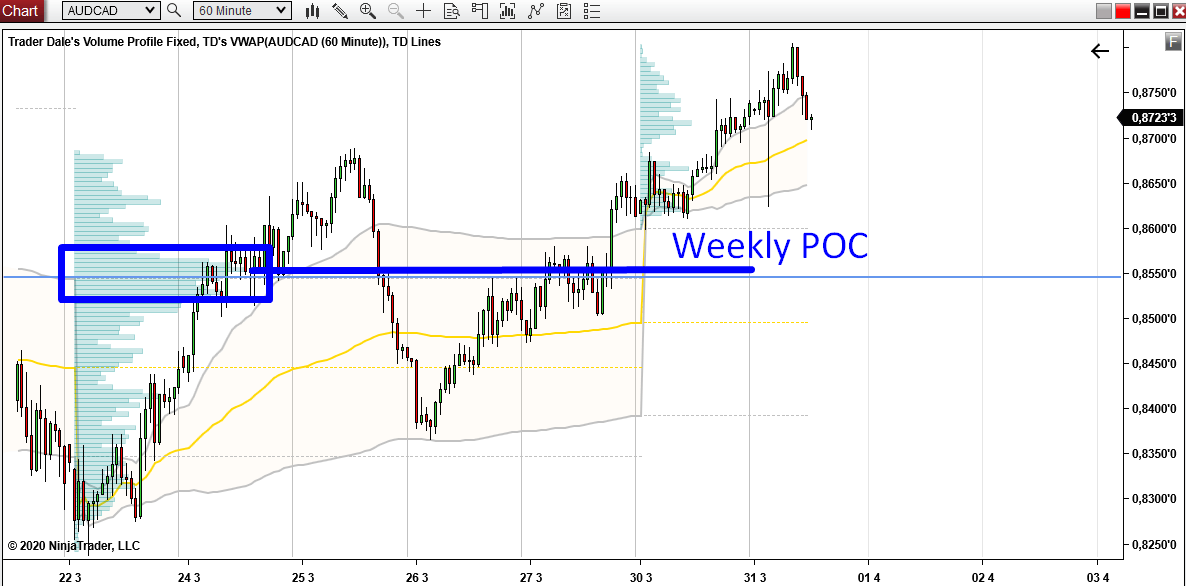
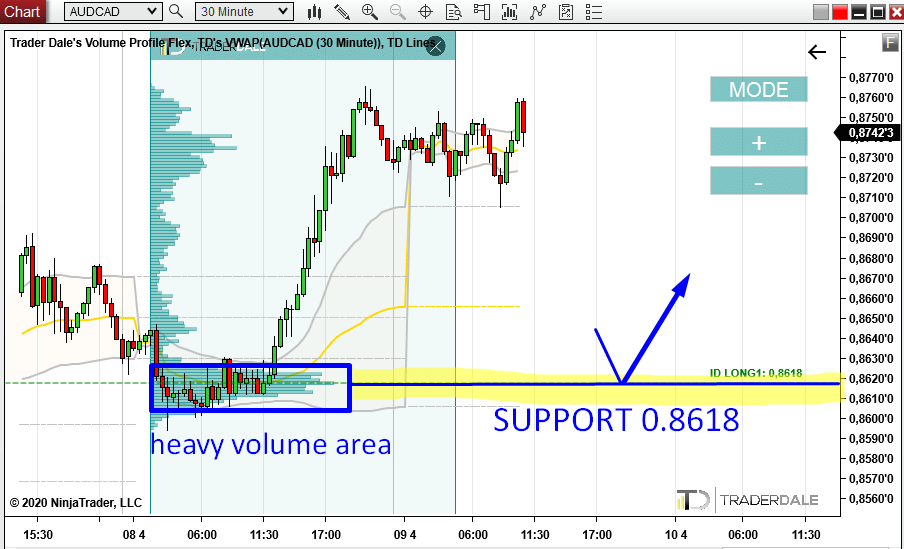
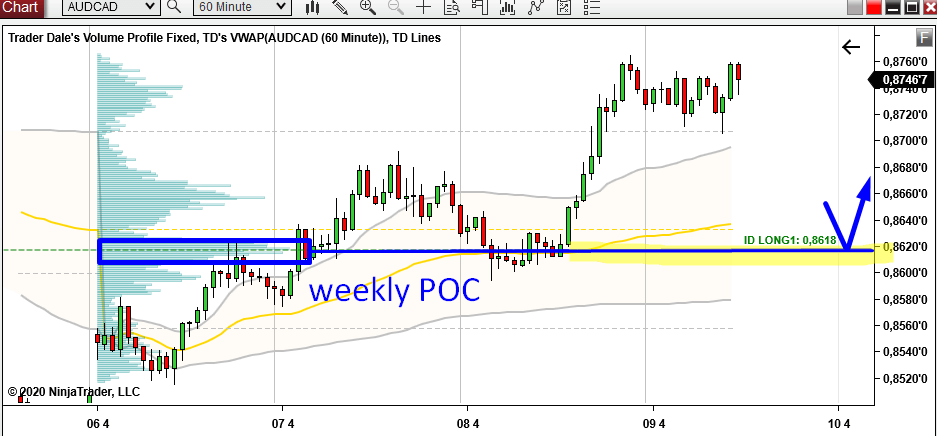
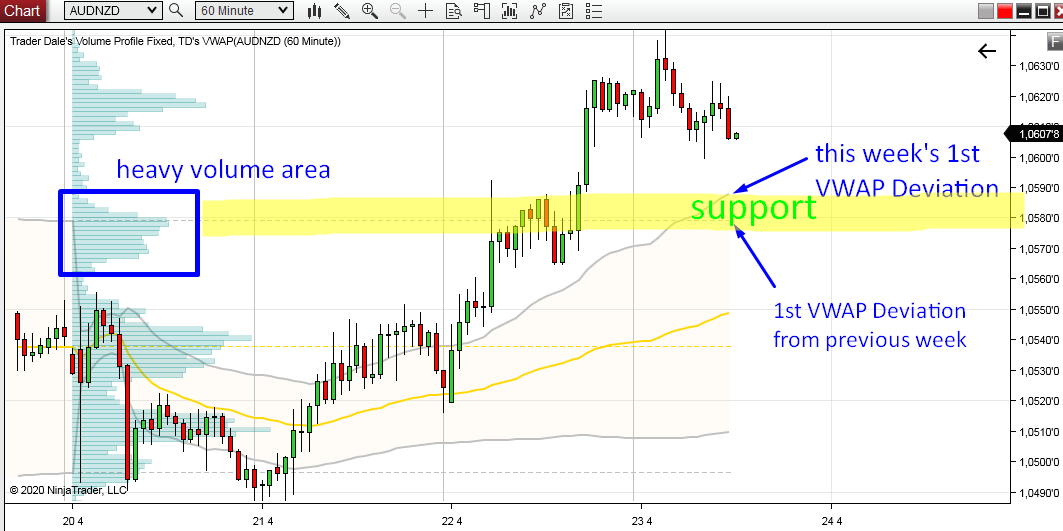
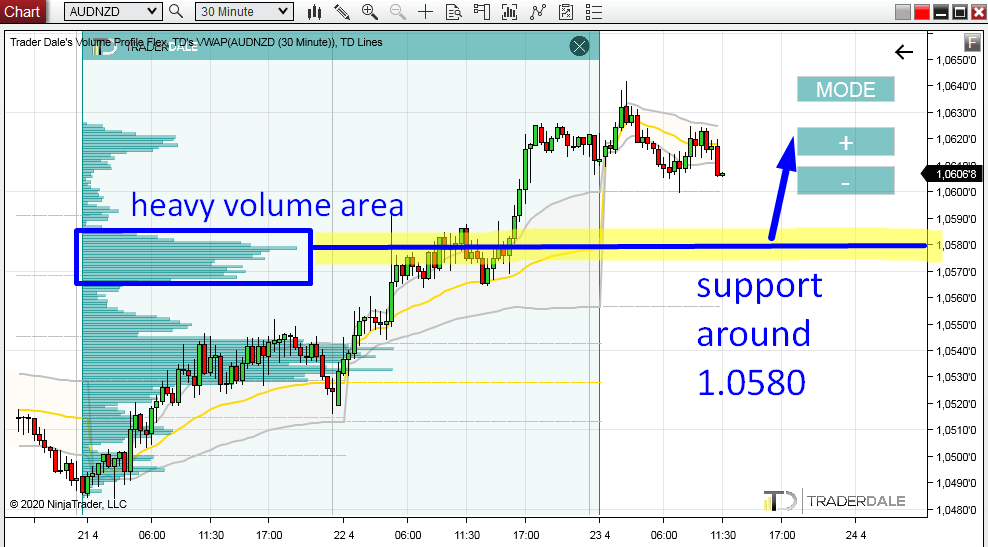
Currently, there is a rotation and there are two areas where we could trade from – long and short.
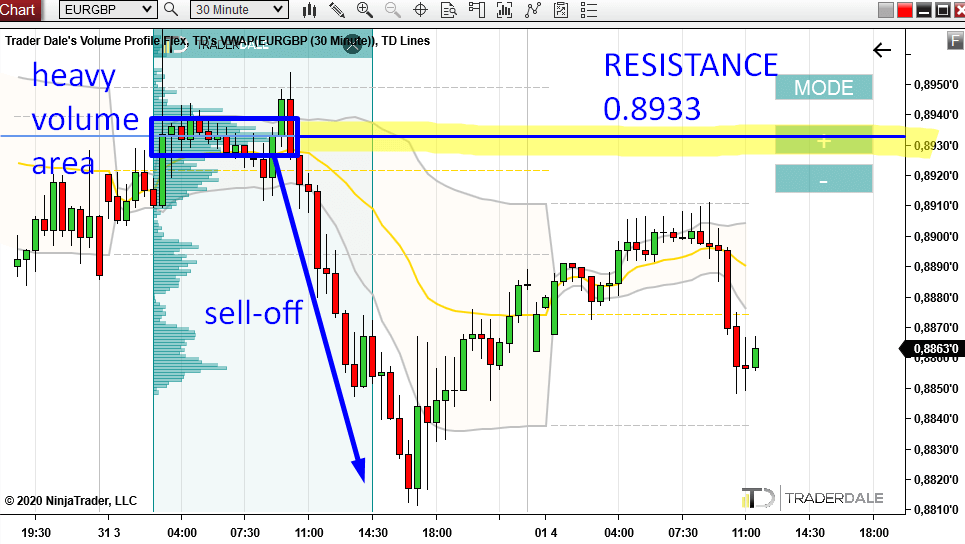
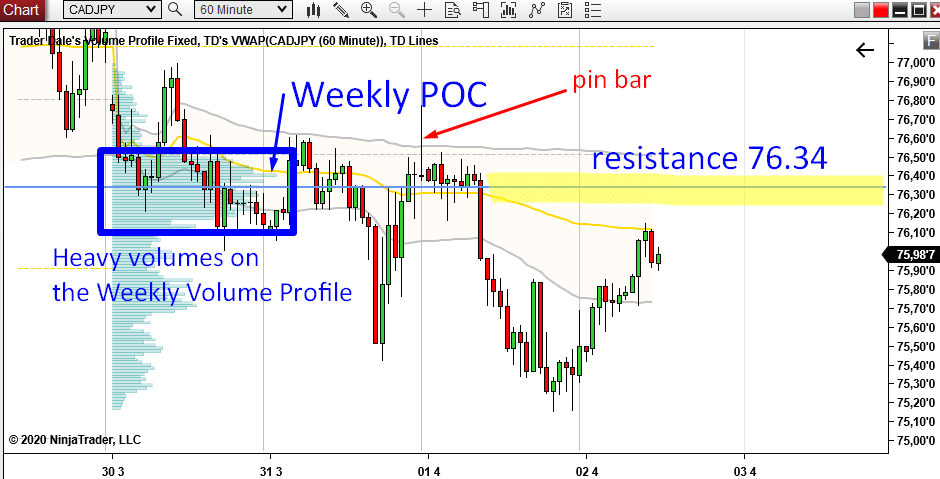
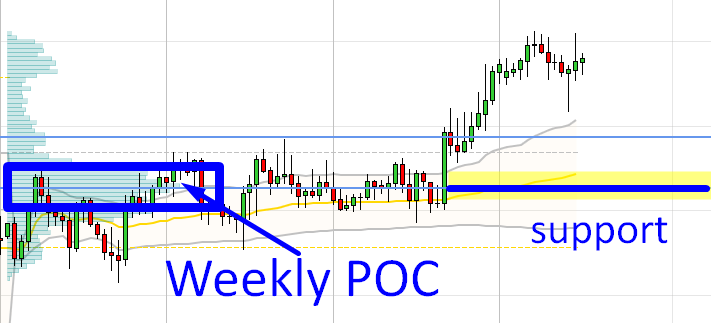
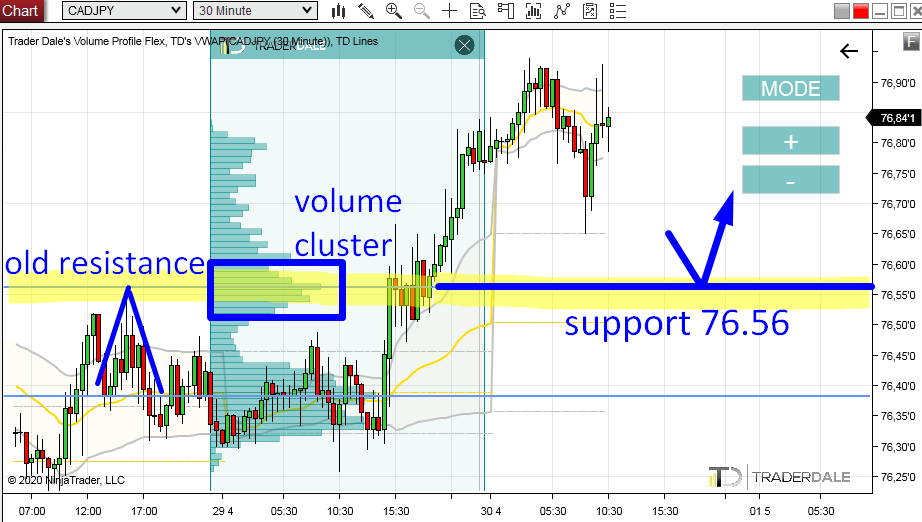
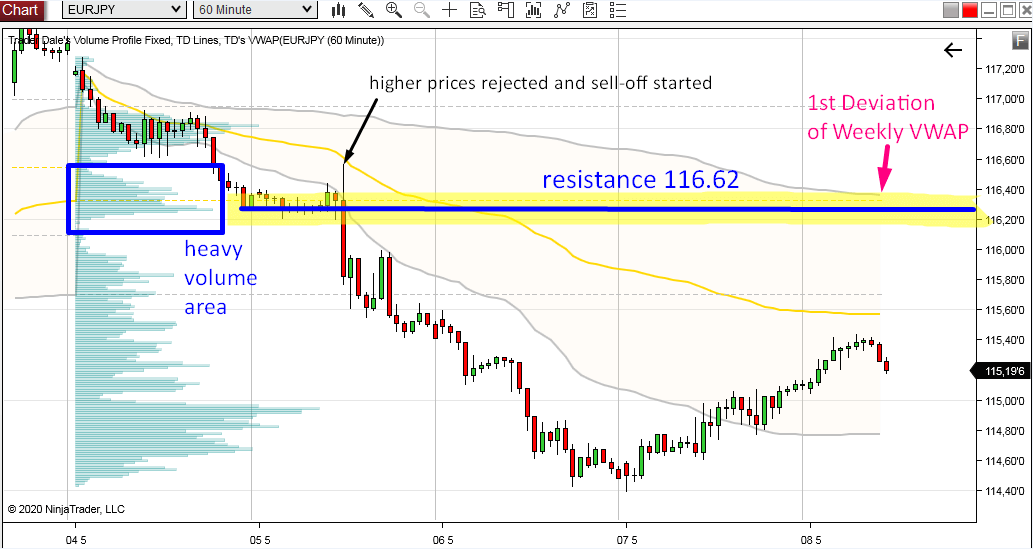
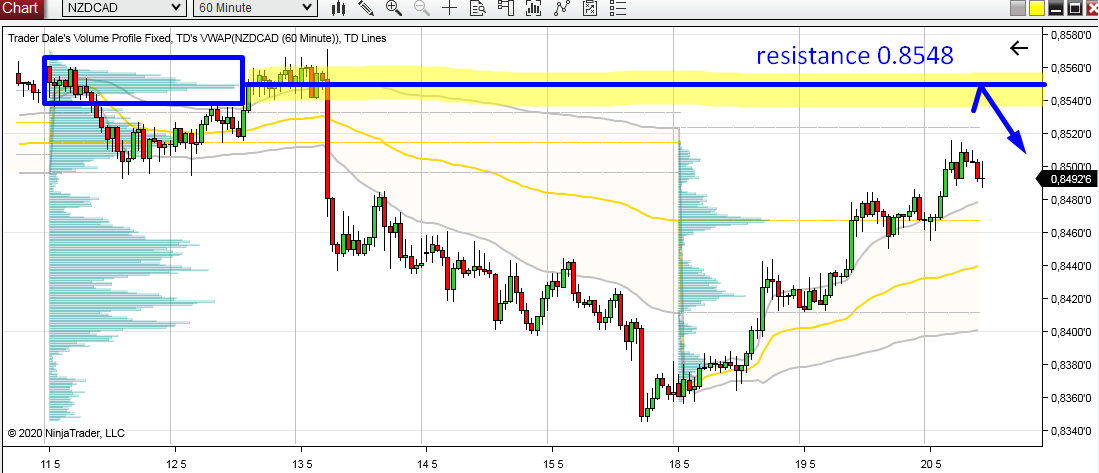
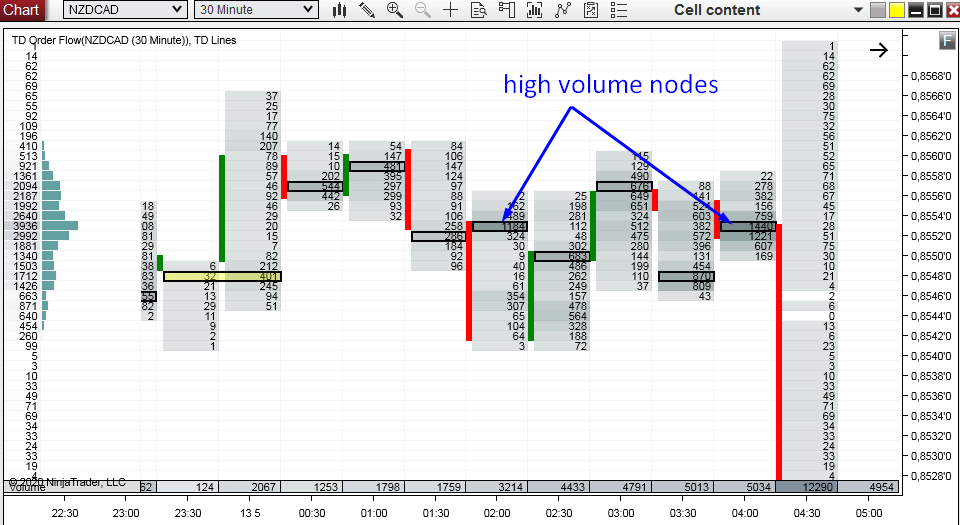
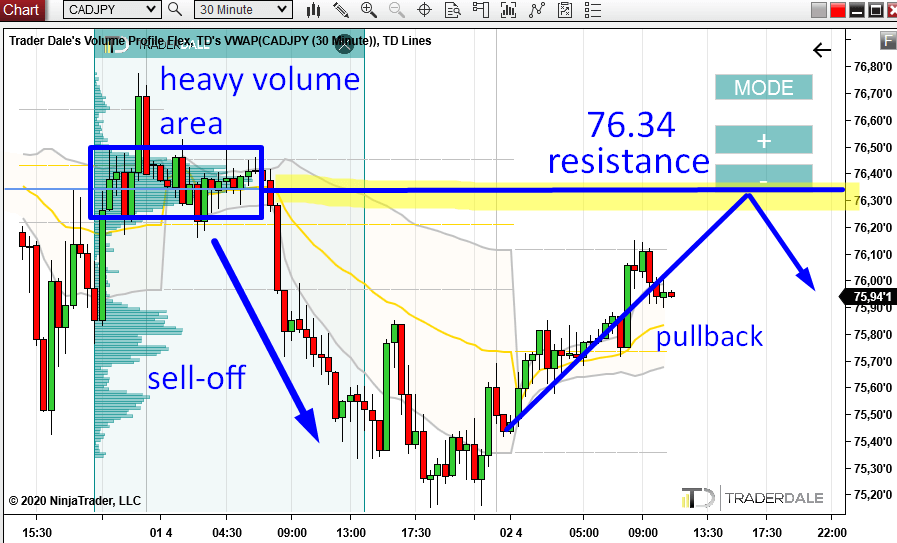
What I like about the short is a confluence with Volume Profile Indicator. If you use the Volume Profile to look into the recent selling area, then you can see that there is a “volume cluster“. This means heavy volumes got traded there. Quite possibly volumes of aggressive sellers who are currently pushing the price downwards. If the price makes it back to this area again, then those sellers could start selling aggressively again and defend their short positions. This would help to move the price downwards again.
This makes this area (around 66.30) an interesting place for a short trade. I marked it in the 60 Minute chart below:


Stay safe and happy trading!
-Dale
 

Trader Dale

Active Trader
Oct 5, 2016
143
13
44
43
Switzerland
www.trader-dale.com
AUD/CAD: A Complete Volume Profile Analysis

Today, I would like to do an intraday analysis of the AUD/CAD. What caught my eye here were two things. First, strong buying activity (uptrend). Second, rotation areas created within the uptrend. There are usually heavy volumes traded in rotation areas like these so I used my Volume Profile to check them out.
Significant volume areas
The Volume Profile shows two significant volume areas here. The first one at 0.8629 and the second (the lower one) at 0.8546.
What happens when there is such a heavy volume area created in an uptrend? This usually indicates that strong buyers were adding to their long positions there (in the rotation areas) and then pushing the price even higher.
When the price makes it back to these levels again (in a pullback) then those strong buyers will most likely defend their longs and they will push the price upwards again. This is what I expect to happen at those two heavy volume levels.
If you look at the first one, then you can see that it actually got tested today in the Asian session. There was a fast and precise reaction to it. This makes this level spent and I don’t really expect any more reactions to it. Well, in fact, there could be another reaction to it but the chances are lower now…
The second level at 0.8546 is still intact. It hasn’t been tested yet and I expect a buying reaction from it (when there is a pullback).
Below is the AUD/CAD chart; 30 Minute time frame:


Resistance turns into a Support
There is also another thing I like about this 0.8546 level. The thing is that it worked as a resistance in the past – the price bounced twice off this level. I marked this in the picture above. When the price went through this resistance, it then became support. This is a simple Price Action setup which I like to use.
So, not only we have the Volume-based setup but we also have a resistance→support setup which confirms the 0.8546 level.


Weekly Point Of Control
That’s not all! There is one more confluence to all this. This confluence is on a Weekly Volume Profile. This Weekly Volume Profile tool shows how the volumes got distributed throughout the whole week. The picture below shows a Weekly Volume Profile from the previous week (the profile on the left). As you can see, the Point Of Control (= place where most of the volumes got traded) was just a bit above our 0.8546 level.
Pretty cool, right? This adds one more confluence to our level!
Weekly POC is definitely a very important place in any chart. Every institutional trader who works with this or a similar time frame knows where the weekly POC is. And so should we!
Below is the AUD/CAD chart; 60 Minute time frame; Weekly Volume Profiles.


I hope you guys liked today’s analysis. Let me know what you think in the comments below!
Stay safe and happy trading!
-Dale
 

Trader Dale

Active Trader
Oct 5, 2016
143
13
44
43
Switzerland
www.trader-dale.com
EUR/GBP: Intraday Analysis With Volume Profile and VWAP


Today, I will focus on the intraday analysis of the EUR/GBP. What caught my eye here was a rotation from which a strong sell-off started yesterday.
Why it caught my eye? Because in a rotation, heavy volumes are usually traded (accumulated). Big trading institutions need a rotation to accumulate their big trading positions. They need time and liquidity. The rotation takes some time so that suits them. When a price rotates then it also means that the market found its fair price (fair value) – at least temporarily. And this means traders are willing to buy and sell there = there is liquidity.
When there is a sell-off after such a rotation, then it indicates that the big guys (institutions) were building up their positions in that rotation. They were doing so unnoticed and without their intentions being revealed. After that, they started manipulating the price aggressively (with market orders) to start a trend.
Volume Profile analysis
When I see a rotation from which a trend starts, then I look into that rotation using my Volume Profile. I look for a place where the volumes were the heaviest because this is the place where the big guys placed most of their positions. This is an important place, because when the price makes a pullback into this area again, then it is likely that those big guys will start defending their positions.
How will they defend them? They will start to sell aggressively again to push the price downwards. And that’s what I want to see. That’s what I want to participate in!
So, what I do is that I wait for the pullback and then enter a short from the place where they accumulated most of their positions. In this case, it is 0.8933. This is currently the strong intraday resistance on EUR/GBP.
You can see it in the picture below.
EUR/GBP; 30 Minute chart:


VWAP analysis
There is one more thing I like about this 0.8933 resistance. The thing is a VWAP Trend Setup. With this setup you want to see the 1st VWAP deviations go sideways and you use them as support and resistance zones.
As you can see from the picture below, the 1st Deviation (the upper grey line) is moving sideways and it is currently exactly at the 0.8933 resistance. If it stays somewhere around this area then it will be a very nice confirmation of the volume-based level.
In the picture below I am using the Weekly VWAP. I find its signals stronger then the Daily VWAP. I like trading with the Weekly VWAP more then with the Daily.

EUR/GBP; 60 Minute chart, Weekly VWAP:


I hope you guys liked today’s intraday analysis. Let me know what you think in the comments below!
Stay safe and happy trading!
-Dale
 

Trader Dale

Active Trader
Oct 5, 2016
143
13
44
43
Switzerland
www.trader-dale.com

CAD/JPY: Volume Profile Analysis


Let’s have a look at the CAD/JPY, intraday chart analysis today, okay? There was a nice rotation followed by a strong sell-off in the European session.
I used my flexible Volume Profile to look inside the rotation and I found what I expected – heavy volumes accumulated there. So to me, it seems that sellers were accumulating their shorts in this area at the end of the US session and in the Asian session.
What they did next was that they started a sell-off. That’s how institutions work. They accumulate their positions without being noticed in a rotation and then they start a trend. It is the same thing over and over again. It is the trend where they are making money from the positions they accumulated in the rotation.
As you can see from the picture below, the price is slowly getting back into the rotation area again. To the area where the sellers entered their short positions.
CAD/JPY; 30 Minute chart:

What will happen when the price gets there?
Two factors to push the price down
1) The sellers will want to defend their shorts. They have two options – to fight or let their shorts run into red numbers. So, yeah – they will fight! They will try to push the price downwards again. They will do it by sell market orders (aggressive orders).
2) Another thing that will happen is that the buyers who are currently pushing the price upwards (pullback) will be afraid to fight the sellers. Those buyers are not stupid, they know about the sellers and their heavy volumes accumulated around 76.34. So instead of risking a fight, these buyers will back off. They will get rid of their longs. Where? At the resistance (which is the heavy volume area).


What if buyers become aggressive?
What could also happen is that there could be some fundamental change in the market sentiment and that the buyers will actually want to fight with the sellers no matter what. They would start aggressively pushing the price upwards by market buy orders and if they are strong enough they push through. This would mean the resistance would get broken.
In a case like this it is best to use a Reversal trade strategy (enter a Long).

Weekly POC
Let’s now get back to the chart because there are two more things I wanted to show you there. The first thing is a Weekly Point Of Control. This POC is very close to the resistance we found (76.34). It tells us that there were massive volumes accumulated throughout this whole week there. This adds to the strength of the resistance level.

Pin bar
The second thing is just a little confirmation, but still it is worth noticing. It is the pin bar created within the rotation area. This pin bar shows the aggressivity of the sellers who rejected higher prices (when the price was rotating and sellers were accumulating shorts)


I hope you guys liked today’s analysis. Let me know what you think in the comments below!
Stay safe and happy trading!
-Dale
 

Trader Dale

Active Trader
Oct 5, 2016
143
13
44
43
Switzerland
www.trader-dale.com
AUD/CHF: Intraday Trading Opportunities

Today’s buying on the AUD created some nice trading opportunities on the AUD related pairs. Like for example on the AUD/CHF which I am going to analyze in this article. I am going to focus on an intraday analysis using 30 Minute and 60 Minute charts.
When there is a trend like now, I always use my Volume Profile indicator to look into the trend. What I am interested in most are places where heavy volumes got traded. I call those places “volume clusters“.
Volume Clusters
Volume clusters are a sign that buyers or sellers were adding or building up their trading positions. If there is an uptrend like in this case, then it was buyers who were adding to their long positions. They wanted to make most of the uptrend.
When the price makes it back to those volume clusters then it is likely that they will work as support zones. Why? Because those buyers who accumulated their longs in the volume clusters will want to defend those areas.
Below is a 30 Minute chart of the AUD/CHF where you can see two significant volume clusters. Both make a nice volume-based supports. The first is at 0.5976 and the second is at 0.5956. When the price makes a pullback to them then the buyers should step in and push the price upwards again.


Resistance becoming a Support
There is also a very nice confluence which I always like to see with this trend setup The confluence is at the 1st support (0.5976).
The picture below shows the same chart, now with 60 Minute time frame. As you can see, there was a really strong rejection of this price level in the past. The price reacted to this level aggressively and it is pretty obvious that this level worked as a strong resistance.
On Monday the price reacted to this level again. Not so strongly this time but the reaction was there.
Today the price went past this twice tested resistance. When it did the resistance became a support.
What I like about this is that this setup points me to the same level as the 1st volume cluster (0.5976). That’s a nice confluence I am always happy to see and trade.


Screenshot_1401.png

I hope you guys liked today’s analysis! Let me know what you think in the comments below!
Stay safe and happy trading!
-Dale
 

Trader Dale

Active Trader
Oct 5, 2016
143
13
44
43
Switzerland
www.trader-dale.com
A Strong Support On Oil

On Friday, I wrote an article on long-term investment in Oil. I talked about the prices dropping crazy low and making Oil very attractive for a long-term investment.

Today, I am going to look more into intraday Oil analysis. You know, even an intraday trade could prove a good starting point for a swing (or long-term) trade. So, if you are looking for an ideal price to jump in a long-term long on Oil, then this analysis could prove helpful.

Buying activity on Oil
The first significant buying activity on Oil occurred a few days ago (2nd April) when Donald Trump made a statement that he made an agreement with Saudi Arabia (Oil gained around 25% immediately).
I believe that this could be the start of a new uptrend. For this reason, I am looking for significant volume clusters created within the newly formed trend.
What I did was that I used my flexible Volume Profile on the most significant trend day – the day of the announcement (2nd April). It revealed a nice volume cluster (around 22.20) that occurred before the news came out.
Now, do you think that the big guys who move and manipulate the markets did not know beforehand about this announcement? I am not really sure. I guess that they knew and I think they were jumping into longs in this volume cluster area.
What will happen when the price makes it back to this volume cluster again? I think that it is pretty likely that those big guys will try to defend their longs. They will try and push the price upwards again. That’s why I think it will work as a support.
30 Minute Oil chart below:

Another confirmation
There is also one more confirmation here. If you look at the picture below, then you can see that the price reacted quite nicely to this 22.20 area in the past. It worked as a resistance.
It was not exactly the 22.20 level, but it does not matter. The important thing is that it was somewhere in this area.
When the price went past the resistance it then became a support.
So, we have a Trend Setup based on the volume cluster and a Resistance becoming a Support setup.
60 Minute Oil chart below:


OPEC meeting tomorrow
There is an OPEC meeting scheduled on Thursday (tomorrow). This could really make the Oil prices very volatile. You should be very careful trading the Oil at that time tomorrow. My advice would be to avoid trading it. At least avoid doing intraday trades on Oil. The situation on Oil is now very tense.


I hope you guys liked today’s analysis. Let me know what you think in the comments below!

Stay safe and happy trading!
-Dale
 
  • 👍
Reactions: Enivid

Trader Dale

Active Trader
Oct 5, 2016
143
13
44
43
Switzerland
www.trader-dale.com
AUD/CAD: Volume Profile Analysis

Today I will look into an intraday trade analysis of the AUD/CAD. There was a strong buying activity all across the AUD related pairs yesterday and it created some nice trading opportunities.
Volume Accumulation
What I always like to see is a price rotation which is followed by a trend. I call this the Volume Accumulation Setup.
First, volumes get accumulated in the rotation and then the big guys push the price into the trend to make money.
Why do volumes get accumulated in a rotation? Because the big guys can hide there. They don’t want to show their intentions. They want to enter their positions slowly and unnoticed.
Instead of entering for example 1.000 lot position, they do it like this: 1+1+1+1+1+1+1… Even if they do this super fast entering such a big position this way takes time. Why do they do it like this? Because this way they can hide their intentions! They don’t want to send a message which would say that “a big guy has just entered a trade”.

AUD/CAD Volume Accumulation
In today’s example, there was a rotation on AUD/CAD. Heavy volumes got accumulated in this rotation.
The big guys entered their longs unnoticed in the rotation and then they started the uptrend.
What happens when the price makes it back to this volume accumulation area? Those big guys will most likely try and defend their long positions. In order to do that they will start aggressive buying to push the price upwards again.
This is what will make this area around 0.8618 a strong support.
Below is the AUD/CAD; 30 Minute chart:


Weekly POC
There is one more confirmation to this support level. It is the Point Of Control of this week. This means that the heaviest volumes throughout this whole week got traded at this level (0.8618).
The Weekly POC is always an important thing to watch because every institutional trader who trades using volume indicators (most of them) know where the POC is.
In my opinion, the POC is the most important information the Volume Profile indicator gives you.
Below is a 60 Minute chart of AUD/CAD and with Weekly Volume Profile:

I hope you guys liked today’s analysis. Let me know what you think in the comments below!
Stay safe and happy trading!
-Dale
 

Trader Dale

Active Trader
Oct 5, 2016
143
13
44
43
Switzerland
www.trader-dale.com
AUD/NZD: VWAP and Volume Profile Analysis

Today, I will do an intraday analysis of the AUD/NZD and I will use VWAP and Volume Profile just the way I showed you in the article yesterday.
Identify the Trend
The first thing to do is to identify whether there is a rotation or a trend. In this case it is pretty simple. The 1st VWAP deviation (Weekly VWAP) is moving upwards. This means that the price and volumes are shifting upwards and that there is an uptrend.
In this case you could also tell by just looking at the price action without using the VWAP. Sometimes it is not so clear as here though…
VWAP Trend Setup
When there is a trend you want to see the price moving above the 1st Deviation and make pullbacks to it. Then you want to trade longs from those pullbacks.
If you look at the picture below, you can see that the 1st Deviation is trending nicely and that the price is moving above it. When the price hits the 1st Deviation, then chances are there will be a buying reaction!
Another thing to notice here is that the 1st Deviation from the previous week ended very close to the area of the current 1st Deviation. This adds strength to the support.
You can also notice a significant volume area around this support on the Weekly Volume Profile. I will talk bit more about it later.
Below is a 60 Minute chart of AUD/NZD, with Weekly VWAP and Weekly Volume Profile:


Volume Profile analysis
Let’s now have a look some more into the volume distribution in this trend area.
I used my flexible Volume Profile to the whole trend area to identify places where significant volumes were traded.
There are two significant volume areas visible. The first one (around 1.0580) corresponds with the support from the VWAP Trend setup (the picture above).
As the price was moving upwards, buyers were adding to their long positions in those heavy volume areas.
It is likely that when there is a pullback into those heavy volume areas, buyers will want to defend their longs and they will try to push the price upwards from those areas again.
Below is 30 Minute chart of AUD/NZD with Flexible Volume Profile:

What I like about all this the most is the confluence. 1st VWAP Deviation points us to a trading level and Volumes point us to the same place too!
This is how I like to use VWAP and the Deviations – as a combo with the Volume Profile. That’s where the VWAP strategies shine the most!
I hope you guys liked today’s analysis! Let me know what you think in the comments below!
Stay safe and happy trading!
-Dale
 

Trader Dale

Active Trader
Oct 5, 2016
143
13
44
43
Switzerland
www.trader-dale.com
CAD/JPY: Volume Profile Analysis

Price Action Analysis
Today, I will do an intraday analysis of CAD/JPY.
What caught my eye when I went through the charts in the morning, was that there was a rotation from which strong buying activity started.
This usually means that there were buyers entering their long positions in that rotation. After they have entered their longs, they started aggressive buying to push the price upwards – to make money on the longs which they placed in the rotation.
I am always interested when I see Price Action like this.

Volume Profile Analysis
My next step was that I used my Flexible Volume Profile to look at how the volumes were distributed yesterday.
The heaviest volumes were in the rotation area, and the heaviest volume peak (where most of the trades got placed) was around 76.38.
This is where the buyers placed most of their longs.
This is a support they will want to defend.
So, if the price makes a pullback to this area I think that those buyers will be defending their longs and they will start aggressive buying again to push the price upwards again.


Weekly POC
A nice addition to all that is that this support is also a Weekly POC (Point Of Control). This means that the heaviest volumes were traded at this price level this week!
You can see that on a 60 Minute chart with a Weekly Volume Profile below:


Volume Cluster at 76.56
As the price was moving upwards, more buyers were jumping in to make money on that up-move.
Most of them jumped in around 76.56. You can see that on the Flexible Volume Profile – there is a significant volume cluster around the 76.56 area.
When the price makes it back to this area again, it is pretty likely that those buyers will want to defend their longs which they placed in that Volume Cluster (76.56 area).
In order to do that they will need to start buying again – aggressive buying! This should drive the price upwards again and this is what makes this level a strong support.

Resistance → Support
There is also one nice confluence to the Volume Cluster. If you look at the picture above, you can see that the 76.56 level also worked as a resistance in the past. The price got rejected there aggressively.
The price went through this resistance yesterday, and it turned into a support. This is an old but pretty effective Price Action setup which I really like to see in a combination with the Volume Cluster – like in this case.
You can learn more about this setup here:
Resistance → Support (Price Action Setup)

I hope you guys liked today’s analysis! Let me know what you think in the comments below.
Stay safe and happy trading!
-Dale
 

Trader Dale

Active Trader
Oct 5, 2016
143
13
44
43
Switzerland
www.trader-dale.com
Today, I will do an intraday analysis of CHF/JPY. It will be a bit different this time because I will also use Order Flow.
Let’s first talk about what the Price Action and Volume Profile show.
There has been a strong downtrend since the beginning of this week. There haven’t been any major pullbacks and the price has been heading downwards steadily.
Volume Profile analysis
When there is a trend like this I like to use my Volume Profile to look in that trend area. What I look for are significant Volume Clusters (areas where heavy volumes were traded).
The reason CHF/JPY caught my eye today was because there are THREE Volume Clusters! Three very nicely visible and easy to identify heavy volume areas.
I believe that the volumes we see in those three areas were aggressive sellers, who were adding to their selling positions.
After each volume accumulation, those sellers pushed the price aggressively downwards – to make money on those positions they have entered in the Volume Cluster areas.
Those Volume Clusters now represent significant resistance zones. If there is no change in the market sentiment those zones should hold and reverse the price (when there is a pullback).
The logic behind Volume Clusters
The logic behind this is that the sellers who have entered their short positions in those Volume Clusters will want to defend their shorts. And if there is a pullback, then those guys are most likely to start selling and pushing the price downwards again. That’s why I think those three areas will work as resistances.
You can see all that in the screenshot below. It shows 30 Minute chart of CHF/JPY along with those three resistances:


Order Flow
The Order Flow software is usually used with Futures. However, my software has some special features which allows you to use it on Forex too! The functions are limited because Forex is decentralized but still it is pretty helpful!
I used the Order Flow to look into detail how the 109.51 resistance area looks like – how exactly the volumes were distributed there.
Heavy volume nodes (HVN)
The most important thing to notice is how the heavy volume nodes were distributed (HVN = those numbers in black rectangles showing where the heaviest volumes were traded in the given footprint).
What I want to see is heavy volume nodes created very close to each other – in one price level area. In the picture below, you can see that many of them were created around the 109.51 area.
This gives me another confirmation that the sellers were interested especially in this area. It also helps me identify the best place for a short trade.
In this case, it would be exactly 109.51 because this is where two heavy volume nodes were next to each other. To me this is the most important level which I was able to pin-point with Order Flow.


This is an effective way how you can use Order Flow on Forex to look into detail how support and resistance areas were formed.
If you see heavy volume nodes very close to one price level, then this makes the support/resistance stronger. It confirms it. It also makes your trade entry more precise (you want to enter your trade at the price level where heavy volume nodes were created).
I hope you guys liked today’s analysis! Let me know what you think in the comments below!
Stay safe and happy trading!
-Dale
 

Trader Dale

Active Trader
Oct 5, 2016
143
13
44
43
Switzerland
www.trader-dale.com
Today, I would like to show you a nice confluence of two trading strategies on EUR/JPY.
The analysis I am going to do will be an intraday trade analysis and I will do it on a 60 Minute chart.
Volume Profile analysis
The thing which got me interested first in this chart was a tight rotation, which was followed by a rejection of higher prices and then an immediate sell-off.
The reason why it caught my eye was that a tight rotation followed by a sell-off is what I look for in my Volume Accumulation trading strategy.
What I also want to see with this strategy is heavy volumes traded in the rotation.
In this case, those volumes were really easy to spot because they show very nicely on the Weekly Volume Profile.
If this wasn’t as easily visible on the Weekly Volume Profile then I would use my Flexible Volume Profile to look just into this rotation area. However, in this case, there was no need for that.


So, what I think happened there was that sellers were accumulating their selling positions in the rotation area (blue rectangle). Then they rejected higher prices aggressively, and then they started the sell-off.
Now the price is slowly making its way upwards. If the price gets in the heavy volume area again, then those sellers who were accumulating their shorts there will want to defend this area. They will want to defend their short positions!
What I think will happen is that those sellers will start aggressively selling again and they will push the price downwards again.
This is why I think this will work as a resistance (around 116.62)
There doesn’t need to be another sell-off from there again, maybe just 15-20 pip reaction. But even if it is only this small reaction then it should be enough to take an intraday trade there and grab a quick profit.

Weekly VWAP confluence
What I also like about this resistance area is the Weekly VWAP, and mostly it’s First deviation (the grey line). The upper first deviation of this week hasn’t been tested yet and it is almost exactly at the resistance which I identified using the Volume Profile!
If the price touches this 1st deviation then I expect a selling reaction. And it does not need to be today. It can also be the next week…
This is the kind of trading signal I like to see most! When a Volume Profile strategy points to the same level as VWAP trading strategy then this creates the strongest trading levels.


I hope you guys liked this analysis, let me know what you think in the comments below!
Have a nice weekend, stay safe and happy trading!
-Dale
 

Trader Dale

Active Trader
Oct 5, 2016
143
13
44
43
Switzerland
www.trader-dale.com
Today, I would like to have a closer look at NZD/CAD. What caught my eye here was a strong sell-off thatoccurred last week (13th May).
Such a strong sell-off is a sign of aggressive sellers jumping in and pushing the price downwards.
In this case, it is pretty easy to spot where those sellers were accumulating their selling positions before they started the aggressive sell-off.
Price Action
Price Action shows that there was a rotation before the sell-off started. Such a rotation is an ideal place for position accumulation.
The reason is that in a rotation those sellers could easily hide their intentions (of starting a sell-off) and slowly, unnoticed accumulated their short positions.
Volume Profile

If you look at the Weekly Volume Profile (on the left) then you can see massive volumes accumulated exactly in that rotation area.
In fact, the heaviest volumes throughout the whole week got accumulated there! (= Weekly Point Of Control).
After those volumes got accumulated → BOOM! A sell-off! It is this sell-off where the sellers were making money.
Now the price is slowly retracing back into this area (to test the Weekly POC at 0.8548).
I think that it will work as a strong resistance and that those sellers will want to defend their short positions.
It is likely, that they will start selling again and try and push the price downwards again.
Below is a 60 Minute chart of NZD/CAD with Weekly Volume Profiles:


Order Flow
We can also identify those sellers using Order Flow!
I zoomed into the rotation area which was formed before the sell-off started to show you how it looked like in there.
The thing which I think is the most important here is the High Volume Nodes. They are easy to identify (at last with my software) because they are printed in darker shades and put into a frame.
There are two especially strong ones, and the strongest one (1440) was formed just before the sell-off started.
Those were without any doubt strong sellers getting ready!
That’s a nice confirmation of the resistance we initially found using the Volume Profile! We can actually see the big guys getting ready here! Cool, right?

Below is NZD/CAD Order Flow. The footprints show 30 Minute candles and the volumes traded in them:


I hope you guys liked today’s analysis! Let me know what you think in the comments below!
Happy trading!
-Dale