Awesome! No rush at all. I just wanted to know where you were at with this.This will be added in the future. I don't have any release date, but probably in the summer.
Thank you for adding this in and thank you for letting me know.
Awesome! No rush at all. I just wanted to know where you were at with this.This will be added in the future. I don't have any release date, but probably in the summer.
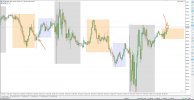
@EnividVersion 1.01 of the Trading Session Time indicator is now out. It implements multiple improvements, including the candlestick display (@trade3925).


You can add 12 instances of the Trading Session Time Indicator (set time ranges to 0-3, 2-4, 5-7, 6-8, and so on) to get that effect.hi can you create an option so that the v lines are drawn for a specific time period ie 60 minute candle and it prints behind x nr of periods and forward x nr of periods. I use a v line each 60 minute interval to identify visually a 60 min swing low on the 5 and 1 min chart heres an example on TV https://www.tradingview.com/x/NXgiI8oN/
The existing Trading Sessions Time indicator can do similar to that. Besides, why make a totally similar indicator when that one already exists?Could you please make a Sessions indicator separate like this. The days of the week and trading sessions are different.
I don't know How to do it?. It shows only the days. There is no option like sessions high, low,start,end lines,The existing Trading Sessions Time indicator can do similar to that.
This indicator have some bugs. If we set 1 hr the old sessions disappear. Only the future sessions shows. And the older sessions goes grayed out. The developer didn't share the code. If he share the code we can try to bend as we like to.Besides, why make a totally similar indicator when that one already exists?
The idea is that you enter the start and end time for one session per indicator instance. So, if you trade Tokyo and London, you add two indicators to the chart, setting their respective start/end times and enabling the respective days (for example, you want to trade Tokyo every day except Monday and London - every day except Friday).I don't know How to do it?. It shows only the days.
If you set both start and end time for the session, it will draw a rectangle around.There is no option like sessions high, low,start,end lines,
Thanks for reporting! This will be fixed soon.Hello, I tested your program in MT5, but there's an issue. When I have moving averages on the chart, it becomes messy.
View attachment 28002
Hello, I appreciate your work, but after I downloaded through this link https://www.earnforex.com/mt5-forex-indicators/MQLTA MT5 Trading Session Time.zip, it is still the old version.Trading Session Time has been updated to version 1.02 to address issues raised by @lsso and @aBillvn.
The files downloaded via the link are definitely of the new version. Please make sure that you are copying the correct files and overwriting the old files when installing the updated version. Please also make sure you are also running that updated version.Hello, I appreciate your work, but after I downloaded through this link https://www.earnforex.com/mt5-forex-indicators/MQLTA MT5 Trading Session Time.zip, it is still the old version.

