Price Action Swing Trading - The PAST Strategy

fortunatus

Trader
Jul 8, 2013
17
0
17
Hi fortunatus, Good question. The timeframes are very much a matter for personal preference. And your situation too. For instance, if you can only check your charts a few times a day, you probably shouldn't be planning and executing your trades on a 1 minute chart.

But there is a broader point here that I think people sometimes miss. Say for instance you are standing on top of a mountain and there is a spectacular view in front of you. You want to take a photograph to remind yourself of the scenery. You take out your camera - you will adjust focus, zoom, orientation, angle, etc, to try to make sure you get the best shot possible. Did anything in front of you actually change as a result of you fiddling with your camera? No, of course not.

Price is the same. It follows the same path no matter what timeframe you choose to show it on. What size is your screen? Maybe a 1 hour chart might look terrible on my small screen but beautiful and clear on yours. It is simply a matter of presentation.

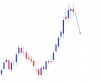
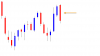
Below is the chart from today on the 30 min timeframe instead of the 4 hour. It's a bit more scrunched up but the levels are still the same. Some people like to look at a chart like this, some people like to have a chart with big candles, some people like OLHC bars, some Heiken Ashi, some just line charts. They are all just different ways of presenting the same information.

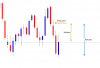
When you say "manage" trades, I am presuming that you mean where I get out when I am wrong. Well, my main reference point on the chart is usually the trendline, and that should come at roughly the same price no matter what the timeframe - as I said, the levels are the same no matter what chart you are looking at.

Notwithstanding all of the above though, I do recommend when people are starting out that they don't really go much below the one hour chart, because on the lower timeframes it is sometimes easy to lose perspective a bit. Four hour is a nice compromise too.

But other than that, use whatever timeframe you are most comfortable with. Personally I check out a few and just use whichever one fits the price best on my screen.

Hope this helps :D


Clearly Understood. "Risk is off the table now and I am playing with the market's money". Hnnmm Fair enough :) :)
 

myknees

Trader
Jun 26, 2013
93
0
22
No worries myknees, glad you liked it.


As far as today is concerned, I don't envisage much happening on Eur/Aud that is likely to interest me in terms of new trades. I have two positions open at the moment and I don't really see any good trendlines that look like they might offer any opportunities.

Let's consider what can happen and how we might deal with the different possible situations:

Option 1: Price could just continue lower. This obviously would be the preferable option for me, as I am already in the market short.

Option 2: After the sharp drop yesterday price could just consolidate quietly sideways/slightly upwards for a while. This could develop into a trendline on the shorter term timeframes that could offer a selling opportunity over the next few days - we would have to wait and see.

Option 3: Price could stage a short-covering rally back up to the underside of the trendline. This could well take my stop out at breakeven on my second position, but I could look for new selling opportunities on the retrace to the trendline. It would offer people who aren't in the market short yet the chance to sell at a pretty good price.

Option 4: The bulls could stage a spectacular comeback, steam through the trendline and on to new bull market highs. This obviously would be the worst scenario for me, but I have to always concede that anything is possible. It has happened before and it will happen again. Frustrating? Definitely. However, at the same time I would lose nothing, because my stops are at breakeven.

Risk is off the table now and I am playing with the market's money.

See you soon :D

Again, thanks for the update and always nice to have a risk free trade :)
 

Nigel Price

Master Trader
Jun 26, 2013
836
4
64
www.forexuseful.com
Evening All

No trendline is a match for Bernanke and his FOMC! Unfortunately my second position was taken out at breakeven and the trendline is broken. If the market fell sharply yesterday, it made the ground back today, and more.

Disappointing, but if you can't take these volatility hits on the chin and get on with it, you will find trading the markets very difficult. They are a fact of life. You simply have to limit the damage when they go against you and take advantage when they go for you.

Here's something to think about. Today I am telling you that my position was taken out at breakeven and I made nothing. What does that make you think of my abilities as a trader? Poor? Mediocre?

What if I logged in this evening and told you that the market had fallen another 300 pips today and I was sitting on an unrealised profit of 1,000 pips? Wow, that's impressive? That guy knows his stuff! How did you do that?

I didn't have any power or special insight or knowledge into what happened today in the market, or indeed any other day. All I do is control risk first, and seek reward second. Some days the market rewards me, other days I give money back. I just have to make sure that the first figure is bigger than the second.

The updated chart is below. Market has moved from bearish to neutral. I will probably let it settle down a bit before taking any more trades. I prefer to wait until I see a nice clear trendline, and there's not much jumping out at me now.

All the best for now :D
 

Attachments

  • eawed2.png
    eawed2.png
    43.7 KB · Views: 180

fortunatus

Trader
Jul 8, 2013
17
0
17
No Pain No Gain

Hi Nigel,
Sure, Having the last trade taken out at break even is a proof that the system works the way you explained. As i am so much comfortable with the last trade taken out at break even, i remain optimistic that sooner or later big gains will come. The only time i can put up a red flag is when losses get big and unbearable:p, but with the outlined concepts of this strategy, i don't see that coming :D:D
So far so good, your system is doing what you sent it to do. Therefore, I am "IN"
Fortunatus
 
Last edited:

Nigel Price

Master Trader
Jun 26, 2013
836
4
64
www.forexuseful.com
Hi Fortunatus

Yes, people do not like taking a lot of losses in a row. But there are ways of managing this risk and making sure you stay in the game long enough to see a large winner. Probably the most important one is to make sure that you are trading with an appropriate position size relative to your account.

Another is to manage your trading with this in mind. For instance, the position I had that was taken out at breakeven yesterday was at one stage over 140 pips in profit. Some people might decide at that stage to close some of the position out, leaving the rest open to target larger gains.

Personally I just like to keep the whole position open, but it's up to the individual trader. The only requirement is that you continually ask yourself - "How can I control my risk while taking maximum advantage of this opportunity?"

As long as every trading decision is taken within that context, you'll not go far wrong. :D
 

fortunatus

Trader
Jul 8, 2013
17
0
17
In waiting times like this, and before a trade opportunity re surfaces; I think I'd get busy by reading some good books on Traders psychology and Money management. I wouldn't mind if you have some books to suggest too
Good Night


Hi Fortunatus

Yes, people do not like taking a lot of losses in a row. But there are ways of managing this risk and making sure you stay in the game long enough to see a large winner. Probably the most important one is to make sure that you are trading with an appropriate position size relative to your account.

Another is to manage your trading with this in mind. For instance, the position I had that was taken out at breakeven yesterday was at one stage over 140 pips in profit. Some people might decide at that stage to close some of the position out, leaving the rest open to target larger gains.

Personally I just like to keep the whole position open, but it's up to the individual trader. The only requirement is that you continually ask yourself - "How can I control my risk while taking maximum advantage of this opportunity?"

As long as every trading decision is taken within that context, you'll not go far wrong. :D
 

Nigel Price

Master Trader
Jun 26, 2013
836
4
64
www.forexuseful.com
Last potential set up of the week that I'm looking at - this is on the one hour chart and it is quite aggressive. It's a Friday during the summer too so we might not get that much movement later on in the day. Trade at your own risk!

Remember keep the risk limited and controlled - if you get a position moving into profit make sure to let it stretch its legs.

Fortunatus - everyone says read Reminiscences of a Stock Operator by Jesse Livermore, and it's for good reason. If you haven't read it already you should take a look at it, it's a great read.
 

Attachments

  • Untitled.png
    Untitled.png
    49.6 KB · Views: 176

Nigel Price

Master Trader
Jun 26, 2013
836
4
64
www.forexuseful.com
Out with a 31 pip loss. That's the last trade of the week for me!

As we can see price moved higher very aggressively just there, over 100 pips in an hour. On some occasions those moves go for us, sometimes they go against us. We cut the ones that are moving against us and we ride the ones that are moving for us for as long as we can. Simple as that! :D
 

fortunatus

Trader
Jul 8, 2013
17
0
17
Explain

Bravo,
30 Pips is bearable. Nigel, would you spare some time to explain the reasons why you took that trade especially on an Intra day scale?. 'Cos as far as i am concerned, that set up is not peculiar with your orginal PAST approach.


Out with a 31 pip loss. That's the last trade of the week for me!

As we can see price moved higher very aggressively just there, over 100 pips in an hour. On some occasions those moves go for us, sometimes they go against us. We cut the ones that are moving against us and we ride the ones that are moving for us for as long as we can. Simple as that! :D
 

Nigel Price

Master Trader
Jun 26, 2013
836
4
64
www.forexuseful.com
The following chart shows why 30 pip losses like this morning do not concern me.

The chart below is the weekly chart of EUR/AUD, without this week's candle.

It's showing a reversal signal that I like to trade. Long wicks and a bearish candle. I was anticipating that price was going to fall, something like the blue arrow.

Do you know how many pips the blue arrow covers?

650 pips.

I trade trendline breaks on the lower term timeframes, keeping my risk controlled, but targeting reward on longer term timeframes, keeping my reward very large.

Price earlier this week made a large move down in the right direction and I was sitting on a large unrealised profit over two positions. Things were going well. But during the week price reversed and burst higher. But I have lost very little.

Sooner or later a longer timeframe signal will work out, they always do.

Put yourself in a position to make a lot if you are right and lose very little when you are wrong. Add a little patience and you are well on your way :D

Have a good weekend.
 

Nigel Price

Master Trader
Jun 26, 2013
836
4
64
www.forexuseful.com
Here is a chart from a trade a few weeks ago. This is a one hour chart.

It is a simple trendline break. Nothing fancy.
 

Attachments

  • Untitled.png
    Untitled.png
    31.8 KB · Views: 187

Nigel Price

Master Trader
Jun 26, 2013
836
4
64
www.forexuseful.com
This what the weekly chart looked like at the time. I like to see big candles like the one with the orange arrow pointing at it.
 

Attachments

  • Untitled3.png
    Untitled3.png
    10.5 KB · Views: 161

Nigel Price

Master Trader
Jun 26, 2013
836
4
64
www.forexuseful.com
Bravo,
30 Pips is bearable. Nigel, would you spare some time to explain the reasons why you took that trade especially on an Intra day scale?. 'Cos as far as i am concerned, that set up is not peculiar with your orginal PAST approach.

Hi Fortunatus, I look for reversal signals on larger timeframes and I then I trade trendline breaks on lower timeframes in the direction of the reversal.

I keep my risk very small and controlled on the lower timeframe and I aim for reward on the weekly timeframe, so it can be very large.

That's pretty much it! Don't get too hung up on what timeframe to use, how to draw a trend line, etc. The most important thing is that you keep your risk small and your reward large. Be prepared to take a few small losing trades before you get a big winner. You will have losers no matter what strategy you use!

That's it for me this week, have a good weekend :D
 

basilc

Trader
Jul 3, 2013
19
0
17
Ireland
Good afternoon Nigel,

I am truly delighted to meet you sir.

As an avid sceptic of technical analysis I was recently revisiting Jon McFarlane's NITS when I stumbled across PAST. The result was this OAP (sans pension) can now see a faint glimmer down the tunnel so maybe just maybe, the missus, the cat and moi, will not one day end up in the poorhouse. Only joking but PAST is exactly what I need at this stage of my life.

As tour guide (curraghmorehouse.ie) I cannot watch trades for lengthy periods so analysing Month and Week charts when necessary is ideal. I intend becoming a regular visitor to this forum to learn from the master and to hopefully make useful contributions in time.

Please know a warm welcome awaits should you ever find yourself in this neck of the woods.

Sláinte,

Basil Croeser. (Ireland)
 

basilc

Trader
Jul 3, 2013
19
0
17
Ireland
I will do a more detailed report on the week's trading later, but for now, here is one more bearish EUR/AUD setup. Be careful though, because the NFP is out later today. I have a couple of short positions open already from earlier in the week with their stops at breakeven, so if this breaks I will probably sit it out.

Maybe if it breaks today we could get a retest sometime next week. There will always be another trade!
EURAUD looks interesting.
For, while the 4H chart shows a potential bounce Southward, the last Week chart ends with a new high and a strongish bull candle.