What is the Mouteki Indicator for MT4?
The Mouteki Indicator for MT4 is a smart charting tool built for technical analysis on MetaTrader 4, designed to help traders visually identify key market turning points. By mapping dynamic trendlines and critical support/resistance levels, it allows for better decision-making during trend continuation or reversal phases.
At its core, this indicator connects significant price highs and lows to draw two main diagonal trendlines on the chart. Additionally, it marks horizontal levels based on past reaction points, serving as potential entry or exit zones.
It also displays useful data like UTD (Upward Trend Direction) and LTD (Lower Trend Direction) in the upper-left corner of the chart, making real-time analysis easier and more informed.
Key Features of the Mouteki Indicator
How the Mouteki Indicator Works
Settings Overview
The Mouteki Indicator offers a comprehensive settings panel for precise customization:
Who Should Use the Mouteki Indicator?
This indicator is a versatile tool for:
✅ Day Traders
✅ Swing Traders
✅ Scalpers
✅ Beginner to Intermediate Analysts
It works effectively across various markets:
Conclusion
The Mouteki Indicator for MT4 offers a structured approach to technical trading by automating the detection of trendlines and reaction levels. Whether you're trading breakouts, reversals, or continuations, this tool equips you with the visual edge needed to make precise decisions in volatile markets.


The Mouteki Indicator for MT4 is a smart charting tool built for technical analysis on MetaTrader 4, designed to help traders visually identify key market turning points. By mapping dynamic trendlines and critical support/resistance levels, it allows for better decision-making during trend continuation or reversal phases.
At its core, this indicator connects significant price highs and lows to draw two main diagonal trendlines on the chart. Additionally, it marks horizontal levels based on past reaction points, serving as potential entry or exit zones.
It also displays useful data like UTD (Upward Trend Direction) and LTD (Lower Trend Direction) in the upper-left corner of the chart, making real-time analysis easier and more informed.
Feature | Description |
| Trendlines | Automatically draws two major trendlines based on historical highs and lows |
| Support/Resistance Levels | Highlights horizontal key price levels |
| Multi-Timeframe Use | Supports analysis across various timeframes |
| Color-Coded Visuals | Uses red and green lines to clearly differentiate price movements |
| Live Chart Comments | Shows helpful data directly on the chart |
| Customizable Settings | Fully adjustable inputs for colors, alerts, line width, and display preferences |
| Download Link | Mouteki Indicator for MT4 Download – Free |
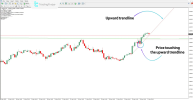
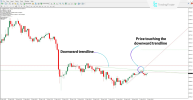
- Uptrend Example (NZD/USD, 1H Chart):
The indicator draws a red upward trendline, aligning with bullish market behavior. Traders can monitor price interaction with this line to find potential buy opportunities. - Downtrend Example (ETH/USD, 15-Min Chart):
A downward trendline forms, and once the upward trendline is breached, it signals bearish momentum, suitable for initiating sell positions.
The Mouteki Indicator offers a comprehensive settings panel for precise customization:
- AlertsOn – Activate on-chart alerts
- Comments – Toggle trend direction comments
- TrendLine, TrendLineStyle, TrendLineWidth – Modify the visual style of trendlines
- UpperTrendLineColour, LowerTrendLineColour – Set custom colors for trendlines
- ProjectionLines, ProjectionLineStyle, ProjectionLinesWidth – Control projection visuals
- UpperProjectionLineColour, LowerProjectionLineColour – Customize projection line colors
- HorizontLine – Enable or disable horizontal support/resistance levels
This indicator is a versatile tool for:
✅ Day Traders
✅ Swing Traders
✅ Scalpers
✅ Beginner to Intermediate Analysts
It works effectively across various markets:
- Forex
- Cryptocurrency
- Commodities
- Indices
- Stock CFDs
The Mouteki Indicator for MT4 offers a structured approach to technical trading by automating the detection of trendlines and reaction levels. Whether you're trading breakouts, reversals, or continuations, this tool equips you with the visual edge needed to make precise decisions in volatile markets.


