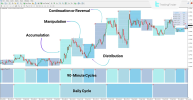
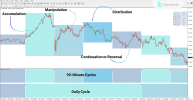
The Quarterly Theory ICT 01 Indicator in MT4 is a professional trading tool that applies ICT methodology and fractal time division to market analysis. By splitting each selected timeframe into four equal quarters (Q1–Q4), it helps traders identify high-probability entry and exit zones with greater precision. A built-in visual table also provides quick reference for the active cycle phase.
Indicator Specifications


Indicator Specifications
- Category: ICT MT4 Indicators, Smart Money MT4 Indicators, Trading Assist MT4 Indicators
- Platform: MetaTrader 4
- Skill Level: Advanced
- Type: Reversal Indicator
- Timeframe: Multi-Timeframe
- Trading Styles: Day Trading, Scalping, Swing Trading
- Markets: Forex, Stocks, Cryptocurrency
- Download: https://cdn.tradingfinder.com/file/502618/quarterly-theory-ict-01-mt4-by-tflab.zip
Market Phases in ICT Quarterly Theory
The indicator structures market activity into four phases:- Q1 – Accumulation: Price consolidates, preparing for direction.
- Q2 – Manipulation: Liquidity sweeps and volatility initiate the main move.
- Q3 – Distribution: Price expands and distributes across the market.
- Q4 – Continuation/Reversal: Trend either extends or shifts direction.
Bullish Example
On the USD/CAD 5M chart, price developed from consolidation in Q1 to manipulation in Q2, expanded upward in Q3, and continued the bullish leg in Q4.Bearish Example
In the AUD/USD 1M chart, phases aligned with a steady downtrend. Each quarter reinforced bearish momentum, clearly marking continuation and potential reversal areas.Customizable Parameters
The Quarterly Theory ICT 01 Indicator allows adjustments such as:- Activating micro, daily, weekly, monthly, or yearly quarters
- Displaying Q1–Q4 labels and the visual cycle table
- Using dual subpanels for higher/lower cycle comparison
- Setting UTC offset for time accuracy
- Defining history depth for calculations
Conclusion
By dividing market timeframes into structured phases, the Quarterly Theory ICT 01 Indicator provides traders with a systematic way to read price cycles. It adapts to multiple time horizons, from intraday to yearly, and enhances decision-making for both trend continuation and reversal strategies. Its clear chart visuals and flexible settings make it an essential ICT-based analysis tool.


