


The Quarterly Theory ICT 02 Indicator in MT4 is a specialized analytical tool built on ICT (Inner Circle Trader) concepts and fractal time models. Its purpose is to break down market activity into structured cycles, allowing traders to recognize and forecast recurring price phases with higher precision.
This indicator divides the market into four repeating stages – Q1, Q2, Q3, and Q4 – that consistently appear across all timeframes. Traders can track these phases in micro, daily, weekly, and even yearly cycles, making it a versatile solution for both short-term and long-term strategies.

One of the standout features of the Quarterly Theory ICT 02 Indicator is its emphasis on the “True Open” – the precise opening point of each cycle. This level becomes visible at the start of the Q2 phase and acts as a critical reference for trend identification.
The True Open is plotted directly on the chart as a line, helping traders quickly determine whether the market is more likely to continue bullish or bearish momentum. This simple yet powerful reference point often aligns with institutional price action, giving traders an edge in timing their entries.
On the USD/CAD 1-hour chart, the price holds above the True Open while the market progresses through Q2 and Q3. As long as price remains above this key level, the bullish trend structure is preserved.
On the GBP/USD chart, price stability below the True Open typically signals strong distribution and bearish continuation. Unless the market reclaims this level, bearish momentum is expected to dominate.
These conditions demonstrate how the indicator visually separates bullish from bearish environments, removing much of the guesswork from manual analysis.
The settings panel provides complete flexibility, allowing traders to customize cycle visibility, True Open levels, colors, and cycle divisions.
Display Settings:
Quarter Cycle Settings:
The Quarterly Theory ICT 02 Indicator is more than just a timing tool—it’s a structured framework that integrates ICT’s fractal time concepts into practical trading decisions. By focusing on the True Open level, it allows traders to define clear bias, monitor recurring phases, and align their strategy with institutional order flow.
For traders looking to merge time-based cycle analysis with smart money concepts, this indicator offers a reliable and adaptable solution across multiple markets and timeframes.

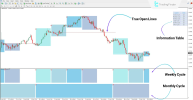

This indicator divides the market into four repeating stages – Q1, Q2, Q3, and Q4 – that consistently appear across all timeframes. Traders can track these phases in micro, daily, weekly, and even yearly cycles, making it a versatile solution for both short-term and long-term strategies.
Indicator Specifications
- Category: ICT – Smart Money – Trading Assist
- Platform: MetaTrader 4
- Skill Level: Advanced
- Indicator Type: Reversal
- Timeframe: Multi-Timeframe
- Trading Style: Day Trading, Scalping, Swing Trading
- Markets: Forex, Stocks, Cryptocurrency
- Download: https://cdn.tradingfinder.com/file/493104/quarterly-theory-ict-02-true-open-mt4-by-tflab.zip
True Open – Core Concept
One of the standout features of the Quarterly Theory ICT 02 Indicator is its emphasis on the “True Open” – the precise opening point of each cycle. This level becomes visible at the start of the Q2 phase and acts as a critical reference for trend identification.
The True Open is plotted directly on the chart as a line, helping traders quickly determine whether the market is more likely to continue bullish or bearish momentum. This simple yet powerful reference point often aligns with institutional price action, giving traders an edge in timing their entries.
Trend Conditions
✅ Bullish Trend
On the USD/CAD 1-hour chart, the price holds above the True Open while the market progresses through Q2 and Q3. As long as price remains above this key level, the bullish trend structure is preserved.
❌ Bearish Trend
On the GBP/USD chart, price stability below the True Open typically signals strong distribution and bearish continuation. Unless the market reclaims this level, bearish momentum is expected to dominate.
These conditions demonstrate how the indicator visually separates bullish from bearish environments, removing much of the guesswork from manual analysis.
Settings of Quarterly Theory ICT 02 Indicator
The settings panel provides complete flexibility, allowing traders to customize cycle visibility, True Open levels, colors, and cycle divisions.
Display Settings:
- TRUE_OPEN_MICRO: Show True Open for micro cycles
- TRUE_OPEN_MIN90: Show True Open for 90-minute cycles
- TRUE_OPEN_DAILY: Show True Open for daily cycles
- TRUE_OPEN_WEEKLY: Show True Open for weekly cycles
- TRUE_OPEN_MONTHLY: Show True Open for monthly cycles
- TRUE_OPEN_YEARLY: Show True Open for yearly cycles
- Customizable colors for all True Open levels
Quarter Cycle Settings:
- MICRO_QUARTERS: Split micro cycles into Q1–Q4
- MIN90_QUARTERS: Split 90-minute cycles into quarters
- DAILY_QUARTERS: Enable daily Q1–Q4 view
- WEEKLY_QUARTERS: Enable weekly Q1–Q4 view
- MONTHLY_QUARTERS: Divide monthly cycle into quarters
- YEARLY_QUARTERS: Divide yearly cycle into quarters
- DISPLAY_LABELS: Show Q1–Q4 labels on chart
- DISPLAY_TABLE: Show phase status table for all cycles
- SUBPANEL_QUARTER_TOP / BOTTOM: Choose table bar alignment
- UTC_TIME_OFFSET_HOURS: Adjusts chart time to market time
- HISTORY_LIMIT: Controls how many candles are used for data display
Final Thoughts
The Quarterly Theory ICT 02 Indicator is more than just a timing tool—it’s a structured framework that integrates ICT’s fractal time concepts into practical trading decisions. By focusing on the True Open level, it allows traders to define clear bias, monitor recurring phases, and align their strategy with institutional order flow.
For traders looking to merge time-based cycle analysis with smart money concepts, this indicator offers a reliable and adaptable solution across multiple markets and timeframes.