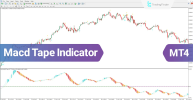
The MACD Tape Indicator in MT4 is an upgraded version of the classic MACD, designed to give traders a clearer view of trend strength and market momentum. Unlike the traditional histogram, this tool uses color-coded bars (light/dark blue for bullish trends, red/orange for bearish trends) to help traders quickly assess the strength of ongoing price movements.
The MACD Tape Oscillator improves upon the standard MACD by providing valid buy and sell signals through arrow markers, alongside colored histograms that confirm momentum.
This dual confirmation (arrows + histogram colors) makes the MACD Tape a valuable tool for trend-following strategies.
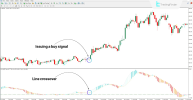
On the 1-hour Binance Coin (BNB) chart, the MACD Tape identified a bullish crossover between the MACD and signal lines.
This combination gave traders high confidence in entering a long trade.
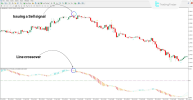
On the 30-minute GBP/USD chart, the indicator detected a bearish crossover.
This helped traders align with the downward market flow.
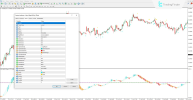
The indicator offers a wide range of customizable options, including:
These settings make it highly flexible, adaptable to different trading strategies.
The MACD Tape Indicator is a powerful upgrade of the classic MACD, offering traders a clear visual representation of momentum shifts through colored histograms and directional arrows.
By combining crossover signals with momentum confirmation, it helps traders make more confident entry and exit decisions across multiple markets and timeframes.


MACD Tape Indicator Specifications
- Indicator Categories: Oscillators, Signal & Forecast, Momentum
- Platform: MetaTrader 4
- Skill Level: Elementary
- Indicator Type: Reversal
- Timeframe: Multi-Timeframe
- Trading Style: Day Trading, Scalping, Swing Trading
- Markets: Forex, Stocks, Indices, Commodities, Cryptocurrency
- Download: https://cdn.tradingfinder.com/file/510823/macd-tape-mt4-by-tflab.zip
Overview
The MACD Tape Oscillator improves upon the standard MACD by providing valid buy and sell signals through arrow markers, alongside colored histograms that confirm momentum.
- Blue arrows indicate a buy opportunity.
- Yellow arrows indicate a sell opportunity.
- Histogram colors strengthen the signal by showing whether the market is gaining or losing momentum.
This dual confirmation (arrows + histogram colors) makes the MACD Tape a valuable tool for trend-following strategies.
Buy Signal Example
On the 1-hour Binance Coin (BNB) chart, the MACD Tape identified a bullish crossover between the MACD and signal lines.
- A blue arrow appeared, signaling a buy opportunity.
- The continuous light blue histogram bars confirmed bullish strength.
This combination gave traders high confidence in entering a long trade.
Sell Signal Example
On the 30-minute GBP/USD chart, the indicator detected a bearish crossover.
- A yellow arrow was displayed, signaling a sell opportunity.
- Red and orange histogram bars confirmed strong bearish momentum.
This helped traders align with the downward market flow.
⚙️ MACD Tape Settings
The indicator offers a wide range of customizable options, including:
- Core Parameters: History (candles analyzed), TimeFrame, Fast MA, Slow MA, Signal MA, Method, Price type.
- Display Options: ShowZero line, ShowLines, ShowCrossovers, ShowTape histograms.
- Colors: TapeColorUp / Up2 for bullish, TapeColorDown / Down2 for bearish.
- Arrows & Alerts:
- ArrUP/ArrDN (arrow colors), ArrGap, ArrSize.
- Alerts via message, sound, email, or mobile.
- Custom sound file support.
These settings make it highly flexible, adaptable to different trading strategies.
✅ Conclusion
The MACD Tape Indicator is a powerful upgrade of the classic MACD, offering traders a clear visual representation of momentum shifts through colored histograms and directional arrows.
By combining crossover signals with momentum confirmation, it helps traders make more confident entry and exit decisions across multiple markets and timeframes.


