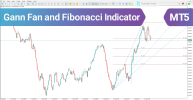
The Gann Fan and Fibonacci Indicator in MT5 is an advanced technical analysis tool that merges the predictive power of Gann angles with the precision of Fibonacci retracement ratios. By combining these two methods, traders can detect critical time–price zones where market reversals or continuations are most likely to occur.
Unlike indicators that focus only on price, this tool analyzes both the geometric structure of time and price. When Fibonacci levels intersect with Gann angles, the resulting overlap marks a highly sensitive trading area suitable for strategic entry or exit points.
Indicator Categories:

Within MetaTrader 5, the Gann Fan and Fibonacci Indicator maps both diagonal and horizontal levels:
When these two structures intersect, they signal zones of confluence, which act as potential high-probability trade entry areas.
For example, on the CHF/JPY 30-minute chart, a bullish setup appears when:
This overlap creates a strong reversal zone. If price reacts upward, it validates a buy entry signal, providing traders with an edge in intraday strategies.
On the Dow Jones Index (DJI) 4-hour chart, a bearish setup forms when:
This confluence highlights a high-pressure area, often leading to a downward reversal. Traders typically confirm this signal using candlestick patterns or trendline breaks.
The customizable settings in MT5 allow traders to fine-tune the indicator for precise analysis:
ZigZag Settings: Depth, Deviation, Backstep, Maximum Bars
Fibonacci Retracement: Display levels (0%, 38.2%, 50%, 61.8%, 100%, plus extended ratios like 14.6%, 23.6%, 76.4%, 88.6%, 127.2%), customizable style, colors, width, and price labels.
Fibonacci Fan: Display fan angles (38.2%, 50%, 61.8%, plus extras), with adjustable colors, line styles, and widths.
These parameters ensure flexibility, allowing the indicator to adapt across different markets and timeframes.
The Gann Fan and Fibonacci Indicator for MT5 is a sophisticated tool that combines time and price analysis to identify support, resistance, and reversal zones.
By using both diagonal Gann angles and horizontal Fibonacci retracements, it highlights areas of strong market confluence. For traders, these intersections represent high-probability opportunities for entering or exiting positions with greater confidence.


Unlike indicators that focus only on price, this tool analyzes both the geometric structure of time and price. When Fibonacci levels intersect with Gann angles, the resulting overlap marks a highly sensitive trading area suitable for strategic entry or exit points.
Gann Fan and Fibonacci Indicator Overview
Indicator Categories:
- Platforms: MetaTrader 5 Indicators
- Trading Skills: Intermediate
- Indicator Type: Reversal MT5 Indicators
- Timeframe: Multi-Timeframe MT5 Indicators
- Style: Intraday MT5 Trading
- Markets: Forex, Crypto, Stocks, Commodities, Indices, Shares
- Download: https://cdn.tradingfinder.com/file/503801/gann-fan-and-fibonacci-mt5-by-tflab.zip

How the Indicator Works
Within MetaTrader 5, the Gann Fan and Fibonacci Indicator maps both diagonal and horizontal levels:
- Gann Angles: Represent the relationship between price movement and time cycles.
- Fibonacci Levels: Horizontal retracements that highlight zones of correction or continuation.
When these two structures intersect, they signal zones of confluence, which act as potential high-probability trade entry areas.
Indicator in Uptrend Conditions
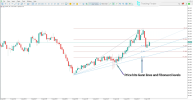
For example, on the CHF/JPY 30-minute chart, a bullish setup appears when:
- Price touches a Gann support line, and
- Aligns simultaneously with a Fibonacci retracement level.
This overlap creates a strong reversal zone. If price reacts upward, it validates a buy entry signal, providing traders with an edge in intraday strategies.
Indicator in Downtrend Conditions
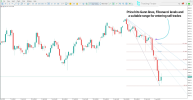
On the Dow Jones Index (DJI) 4-hour chart, a bearish setup forms when:
- Price reaches a Gann resistance line that coincides with a Fibonacci retracement level.
This confluence highlights a high-pressure area, often leading to a downward reversal. Traders typically confirm this signal using candlestick patterns or trendline breaks.
⚙️ Settings of the Gann Fan and Fibonacci Indicator
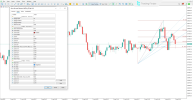
The customizable settings in MT5 allow traders to fine-tune the indicator for precise analysis:
ZigZag Settings: Depth, Deviation, Backstep, Maximum Bars
Fibonacci Retracement: Display levels (0%, 38.2%, 50%, 61.8%, 100%, plus extended ratios like 14.6%, 23.6%, 76.4%, 88.6%, 127.2%), customizable style, colors, width, and price labels.
Fibonacci Fan: Display fan angles (38.2%, 50%, 61.8%, plus extras), with adjustable colors, line styles, and widths.
These parameters ensure flexibility, allowing the indicator to adapt across different markets and timeframes.
✅ Conclusion
The Gann Fan and Fibonacci Indicator for MT5 is a sophisticated tool that combines time and price analysis to identify support, resistance, and reversal zones.
By using both diagonal Gann angles and horizontal Fibonacci retracements, it highlights areas of strong market confluence. For traders, these intersections represent high-probability opportunities for entering or exiting positions with greater confidence.


