Elliottwave-Forecast

Master Trader
Feb 17, 2017
2,453
9
84
www.elliottwave-forecast.com
In the previous articles from March and November 2021, we have discussed the price action and the outlook for the Frozen Concentrated Orange Juice. As it has been expected, the soft commodities have advanced. In particular, we saw commodities like coffee, cocoa, cotton and sugar extending higher. Hereby, orange juice futures OJ #F have rallied as well. Now, we see a higher high in Weekly view confirming our bullish view. Short-term pullbacks should and will happen providing an opportunity both for investors and traders.

Orange Juice Monthly Elliott Wave Analysis 10.02.2022​

The monthly chart below shows the FCOJ front contract OJ #F at NYBOT (e-Signal ticker: JO). From the important low in May 2004, the prices have developed a cycle higher in blue wave (I) of a super cycle degree. Hereby, wave (I) has demonstrated a leading diagonal pattern and has ended in October 2016 at 227.50. From the all-time highs, a correction lower in wave (II) has unfolded as an Elliott Wave double three pattern. In 2.5 years, OJ #F has become cheaper by 60% reaching 90.60 level. It is the preferred view that an important bottom in May 2019 has been set and the correction has ended. From the lows, a new rally in prices within blue wave (III) may have already started.

For 2023-2030, the expectations are to break to the new all-time highs. The target for wave (III) will be 264.00-371.20 area. From current levels, the orange juice can, therefore, double in price.

Orange Juice Elliott Wave Monthly

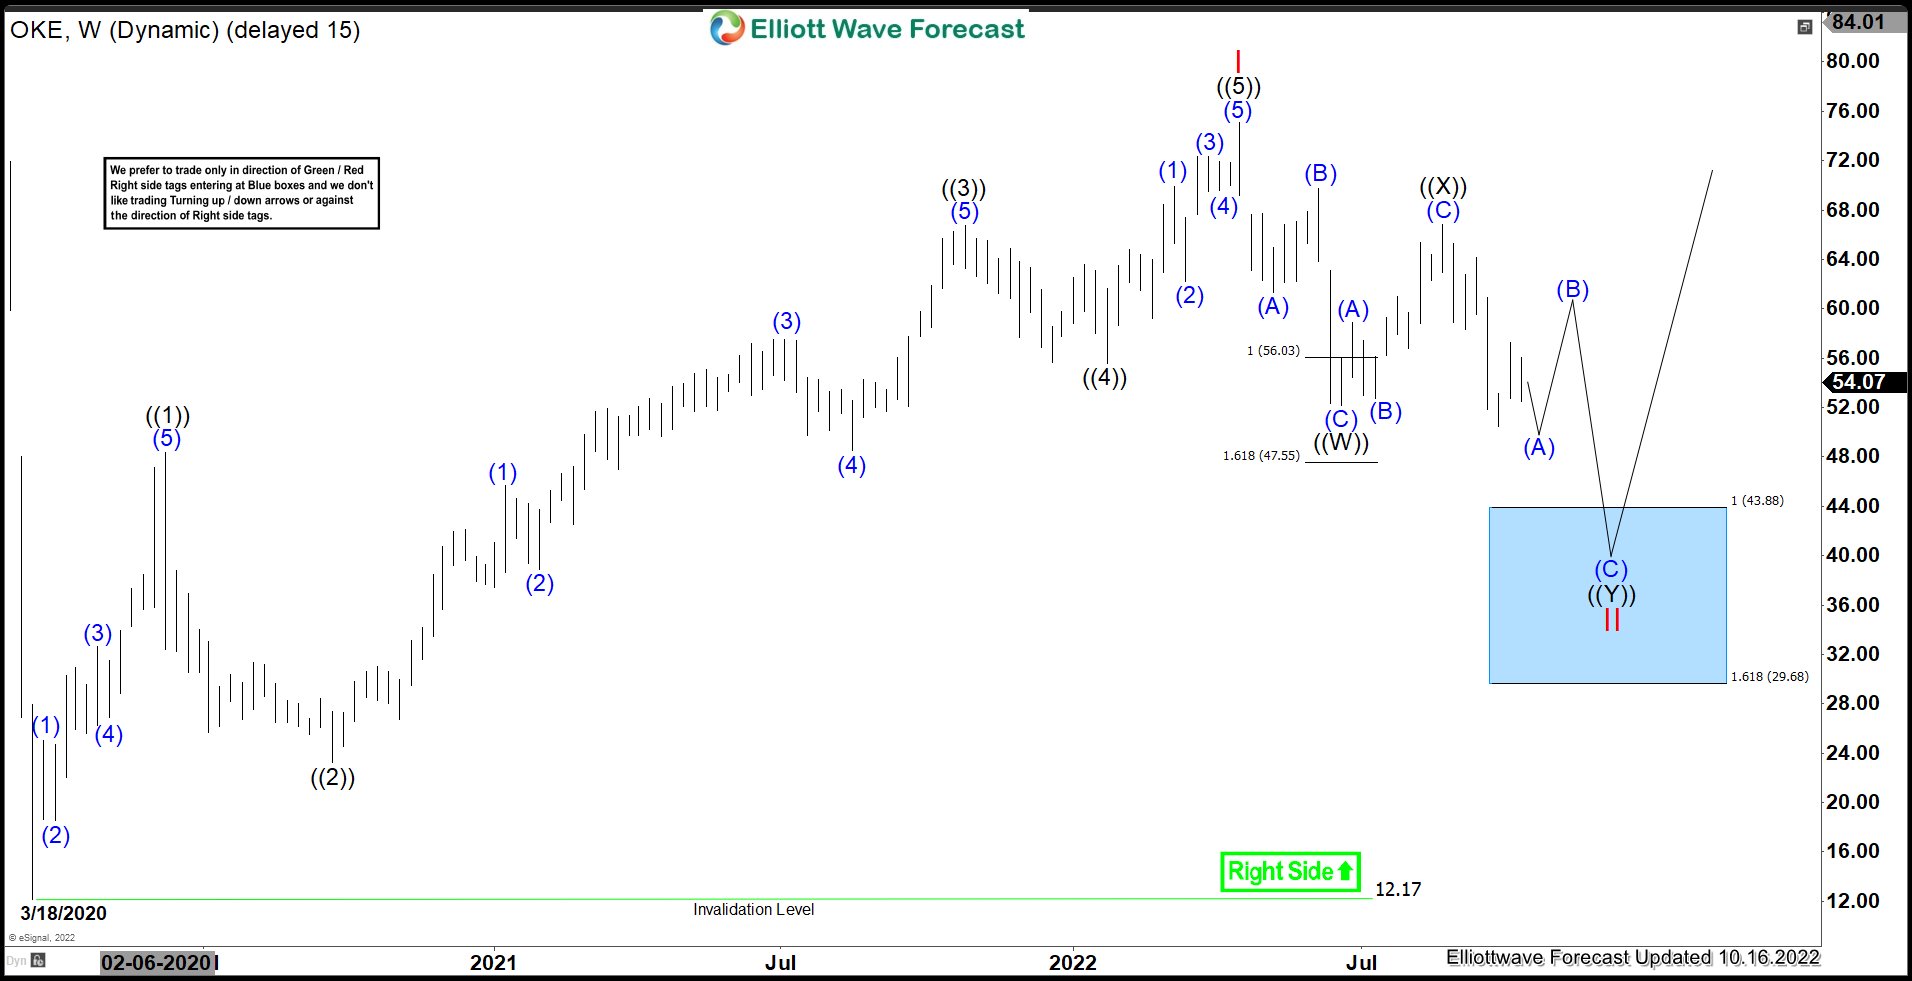
Orange Juice Weekly Elliott Wave Analysis 10.02.2022​

The weekly chart below shows in more detail the decline lower in wave (II) and the initial cycle within red wave I of the blue wave (III). From the 90.60 lows, we see the advance higher as a leading diagonal in wave I demonstrating a 3-3-3-3-3 structure. Recently, we saw a new high with a divergence. As a matter of fact, divergence does not mean that it should pullback. Orange juice can accelerate higher. Correlation with the entire market tells, however, that a pullback should happen. It can correct the cycle from May 2019 lows in 3, 7, 11 swings before upside resumes.

Investors and traders can be, therefore, looking to buy FCOJ in a pullback against 90.60 low targeting 264.00-371.20 area in medium to long term time perspective.

Orange Juice Elliott Wave Weekly
Source: https://elliottwave-forecast.com/commodities/orange-juice-bullish/
 

Elliottwave-Forecast

Master Trader
Feb 17, 2017
2,453
9
84
www.elliottwave-forecast.com
Hello Everyone! In this technical blog, we are going to follow up on our initial article from July 2022 and take a look at the Elliott Wave path in ARK Invest ($ARKK).

Summary of the Fund:​

ARK Invest (ARKK) is an actively managed Exchange Traded Fund (ETF). It seeks long-term growth of capital by investing in domestic and foreign equity securities of companies that are relevant to the Fund’s investment theme of disruptive innovation.

ARK defines ‘‘disruptive innovation’’ as the introduction of a technologically enabled new product or service that potentially changes the way the world works.


$ARKK – Elliott Wave Latest View Oct 2nd 2022 (Weekly):​

ARKK

In our initial article from July 2022, we were expecting the bounce in ((4)) to fail and continue lower which took place sooner than expected. Above is the latest Weekly Elliott wave count. As long as the 08/11/2022 peak at $53.86 remains intact, ARKK is favoured to continue lower in 5 swings to reach $31.02 - 24.01 where buyers can appear for a reaction higher.

$ARKK – Elliott Wave View Oct 2nd 2022 (Daily):​

arkk

The ETF is favoured to be unfolding in the final swing lower in ((5)) of c of (II). Looking at the reaction from 08/11/2022 peak you can see the 5 wave impulse that took place to end red 1. The bounce in red 2 failed on 9/13/2022 and made a new low in red 3 which is a bearish sequence in the shorter cycles. To conclude, ARKK has more downside to be seen and can reach $30.30 - 23.03 before buyers appear and start the next leg higher.

Source: https://elliottwave-forecast.com/uncategorized/ark-invest-arkk-near-term-favours-downside/
 

Elliottwave-Forecast

Master Trader
Feb 17, 2017
2,453
9
84
www.elliottwave-forecast.com
The Global X Lithium & Battery Tech ETF (LIT) invests in the full lithium cycle, from mining and refining the metal, through battery production. The Global X Lithium & Battery Tech ETF (LIT) seeks to provide investment results that correspond generally to the price and yield performance, before fees and expenses, of the Solactive Global Lithium Index.

LIT Weekly Chart from September 2022


Lithium ETF (LIT) ended a bullish cycle in November 2021, and we call it wave (I). Wave I ended at 41.19 and we had a 3 waves correction to end wave II at 17.82. Then in March 2020, we saw a strong bounce toward 74.95 to complete wave III and a pullback as wave IV ending at 55.00. The latest rally made 5 new waves to finish at 97.26 and complete wave V and wave (I).

From this point the downward movement started, and it seems that it should complete a double correction before continuing with a rally. We can clearly see 3 swings down to complete wave w at 61.50. Then the x-connector ended at 82.15 and continue lower. We now need 3 more swings lower towards the blue box in the 46.61 – 24.62 area to finish the double correction.

LIT Weekly Chart from September 2022 Alternative


Another alternative for the Lithium ETF (LIT), it is that after finish the connector x it could build a double correction structure as we can see in the chart. It should reach the same 46.61 - 24.62 area and continue a rally. (If you want to learn more about double correction or Elliott Wave Theory, follow these links: Elliott Wave Education and Elliott Wave Theory).

Something important to keep in mind is that for either of these two ideas to be valid, the market must break 61.50. And another important thing, in case LIT does not reach the blue box, keep an eye of 55.00, which is the low of wave IV. From this value Lithium could continue to rise without problems.

Source: https://elliottwave-forecast.com/stock-market/lithium-lit-pressure-market-downtrend/
 

Elliottwave-Forecast

Master Trader
Feb 17, 2017
2,453
9
84
www.elliottwave-forecast.com
Assurant Inc., (AIZ) together with its subsidiaries, provides lifestyle & housing solutions that support, protect & connect consumer purchases in North America, Latin America, Europe & Asia Pacific. The company operates through two segments: Global lifestyle & Global housing. It is based in New York, Comes under Financial services sector & trades under “AIZ” ticker at NYSE.

AIZ seen the biggest correction since 2009 low at $76.27 during March-2020 global sell-off. But after that, it made an ATH at $194.12 as impulse sequence. While below there, it favors correcting lower against March-2020 low in proposed double correction.

AIZ - Elliott Wave Latest Daily View:​

Since March-2020 low, it placed ((1)) at $114.74 high on 4/09/2020. Below there, it ended ((2)) correction at $83.89 low on 5/14/2020 as 0.764 Fibonacci retracement of ((1)). Later it extends ((3)) higher & ended at $172.22 high. Below there, it favored ended ((4)) at $144.18 low on 1/24/2022. Finally, it placed ((5)) at $194.12 high on 4/21/2022 high as wave I impulse sequence. Below there, it favors correcting lower in wave II as double correction.

Below $194.12 high, it placed ((W)) at $149.50 low on 8/04/2022 & ((X)) at $172.99 high on 8/17/2022. It already breaks below ((W)) low, calling for more downside continue in ((Y)) leg. Currently, it favors lower in (A) leg & expect two more lows before a bounce in (B) leg followed by further weakness in (C). Ideally ((Y)) leg, expect to extend towards $127.93 – $100.15 area to finish II correction before upside resumes. We like to buy the dips towards blue box area for upside or at least larger 3 swing bounce.

Source: https://elliottwave-forecast.com/stock-market/aiz-expect-double-correction-upside-resumes/
 

Elliottwave-Forecast

Master Trader
Feb 17, 2017
2,453
9
84
www.elliottwave-forecast.com
In this technical article we’re going to take a look at the Elliott Wave charts charts of Apple AAPL stock published in members area of the website. As our members know Apple stock has recently given us recovery against the 176.13 high that has unfolded as Irregular flat pattern. Once the stock completed flat correction, it made decline toward new lows as expected.

Before we take a look at the real market example of Expanded Flat, let’s explain the pattern in a few words.

Elliott Wave Expanded Flat Theory​

Elliott Wave Flat is a 3 wave corrective pattern which could often be seen in the market nowadays. Inner subdivision is labeled as A,B,C , with inner 3,3,5 structure. Waves A and B have forms of corrective structures like zigzag, flat, double three or triple three. Third wave C is always 5 waves structure, either motive impulse or ending diagonal pattern. It’s important to notice that in Irregular Flat Pattern wave B completes below the starting point of wave A. Wave C ends above the ending point of wave A . Wave C of Flat completes usually between 1.00 to 1.236 Fibonacci extension of A related to B, but sometimes it could go up to 1.618 fibs ext.

At the graphic below, we can see what Expanded Flat structure looks like

AAPL

Now, let’s take a look what Elliott Wave Flat Pattern looks like in the real market

Apple AAPL 4h Hour Elliott Wave Analysis 09.12.2022.​

The stock has made 5 waves down from the 176.13 peak which suggests cycle from the peak is not done yet. After 3 waves correction we expect to see further decline. Currently AAPL is correcting the cycle from the 176.13 high. Elliott wave view suggests recovery is unfolding as Irregular Flat Pattern. When we downgrade charts to lower time frames , we can see waves inner subdivisions of ( A) and (B) blue are having corrective sequences. Wave B has broken the starting point of (A) while (C) has broken ending point of A which is characteristic of Irregular flat. Wave C red leg should complete as 5 waves soon.

You can learn more about Elliott Wave FLAT and other Patterns at our Free Elliott Wave Educational Web Page

AAPL

Apple AAPL 4h Hour Elliott Wave Analysis 09.26.2022.​

Apple stock ended ((B)) black recovery at 164.25 high and made turn lower as we expected. Eventually the price has broken previous low confirming next leg down is in progress. Now AAPL stock is showing lower low sequences from the 176.13 peak, suggesting further weakness toward 141.54 - 127.07 area.

Keep in mind that market is dynamic and presented view could have changed in the mean time. You can check most recent charts in the membership area of the site. Best instruments to trade are those having incomplete bullish or bearish swings sequences. We put them in Sequence Report and best among them are shown in the Live Trading Room.

AAPL

Source: https://elliottwave-forecast.com/elliottwave/apple-aapl-decline-elliott-wave-flat/
 

Elliottwave-Forecast

Master Trader
Feb 17, 2017
2,453
9
84
www.elliottwave-forecast.com
Chevron Corporation (CVX) is an American multinational energy company. It is the second largest oil company in the United States and has operation in more than 180 countries. Chevron is involved in the entire spectrum of supply chain within the oil and natural gas industries from exploration, production, refining, marketing, transport, and sales. The stock shows a bullish sequence from all-time low but now is in the process of correcting cycle from March 2020 low. Below is the Elliott Wave outlook for the stock.

Chevron Monthly Elliott Wave Chart​


Monthly Elliott Wave of CVX above shows a higher high bullish sequence in the stock. Rally to $135.1 ended wave ((I)). Pullback in wave ((II)) ended at $51.60 with internal subdivision as a zigzag structure. Down from wave ((I)), wave (A) ended at $69.58, rally in wave (B) ended at $133.88, and final leg lower wave (C) ended at $51.60 which completed wave ((II)). The stock has resumed higher in wave ((III)). Up from wave ((II)), wave (I) ended at $182.40. Pullback in wave (II) is in progress to correct cycle from March 2020 low in 3, 7, or 11 swing before the rally resumes. As far as pivot at $51.6 low stays intact, expect dips to find support in 3, 7, or 11 swing for further upside.

Chevron Daily Elliott Wave Chart​


Daily Chart of CVX above suggests that the stock still has scope to extend lower to correct cycle from 3.19.2020 low in larger degree 3 swing towards $87.7 - #116.4 blue box area. From this area, the stock should extend higher to new high or rally in 3 waves at least. As far as pivot at $51.6 low stays intact, expect dips to find support in 3, 7, or 11 swing for further upside.

Source: https://elliottwave-forecast.com/st...s-still-correcting-cycle-from-march-2020-low/
 

Elliottwave-Forecast

Master Trader
Feb 17, 2017
2,453
9
84
www.elliottwave-forecast.com
In this technical blog, we will look at the past performance of 1-hour Elliott Wave Charts of USDCAD. In which, the rally from 11 August 2022 high is unfolding as an impulse sequence and showed a higher high sequence. Therefore, we knew that the structure in USDCAD is incomplete to the upside & should see more upside. So, we advised members to buy the dip in 3, 7, or 11 swings at the extreme areas. We will explain the structure & forecast below:

USDCAD 1-Hour Elliott Wave Chart​

USDCAD Reacting Higher From The Equal Legs Area

Here’s the Elliott wave Chart from the 10/03/2022 New York Midday update. In which, the rally to $1.3833 high ended the cycle from the 13 September 2022 low in wave (3) & made a pullback in wave (4). The internals of that pullback unfolded as Elliott wave flat structure where wave A ended at $1.3600 low. Then a bounce to $1.3838 high ended wave B & started the next leg lower in wave C towards $1.3602- $1.3456 equal legs area. From there, buyers were expected to appear looking for new highs ideally or for a 3 wave bounce minimum.

USDCAD Latest 1-Hour Elliott Wave Chart​

USDCAD Reacting Higher From The Equal Legs Area

Above is the latest Elliott wave Chart from the 10/06/2022 New York update. In which the pair is showing a reaction higher taking place from the equal legs area. Right after ending the flat correction. Allowed members to create a risk-free position with the minimum reaction higher towards 50%- 61.8% Fibonacci retracement from the wave B peak at $1.3669- $1.3709 area. However, a break above $1.3838 high is still needed to confirm the next extension higher & avoid a double correction lower.

Source: https://elliottwave-forecast.com/forex/usdcad-reacting-higher-equal-legs-area/
 

Elliottwave-Forecast

Master Trader
Feb 17, 2017
2,453
9
84
www.elliottwave-forecast.com
Hello fellow traders. In this technical blog we’re going to take a quick look at the Elliott Wave charts of Natural Gas $NG_F . As our members know, Natural Gas futures has been showing incomplete bearish sequences in the cycle from the August 23rd peak. We recommended members to avoid buying the commodity. Cycle from the 10.036 peak was incomplete and we knew the drop was coming . In the further text we are going to explain the Elliott Wave Forecast.

Natrual Gas $NG_F Elliott Wave Analysis 09.18.2022​

Natural Gas futures is trading within the cycle from the 10.036 peak. Recently we got break of the 8th September low which made incomplete bearish sequences. First important technical zone comes at 7.844-7.515 area from where we can see 3 waves bounce B red. Then after B red completes, further decline should ideally follow. The commodity is targeting 6.983-6.451 area. From there we expect to see further rally or larger bounce in 3 waves at least.

Reminder: You can learn about Elliott Wave Rules and Patterns at our Free Elliott Wave Educational Web Page.

NG 09.18.

Natrual Gas $NG_F Elliott Wave Analysis 09.22.2022​

The commodity made 3 waves bounce in B red as expected. Decline resumed and we are approaching our target area 6.983-6.461 which can act as support again. It's important that price holds above 5.595 level, which is 1.618 fib ext from the 10.036 peak which will be invalidation level for the proposed view.

Keep in mind market is dynamic and presented view could have changed in the mean time. You can check most recent charts in the membership area of the site. Best instruments to trade are those having incomplete bullish or bearish swings sequences.We put them in Sequence Report and best among them are shown in the Live Trading Room.

Natural Gas

Source: https://elliottwave-forecast.com/commodities/natural-gas-ng_f-bearish-sequences/
 

Elliottwave-Forecast

Master Trader
Feb 17, 2017
2,453
9
84
www.elliottwave-forecast.com
MTU Aero Engines AG is a German aircraft engine manufacturer. It develops, manufactures and provides service support for civil and military aircraft engines. Founded in 1934 and headquartered in Munich, Germany, it can be traded under the ticker $MTX at XETRA in Frankfurt. MTU is a part of DAX40 index. In the initial article back in April 2021, we have forecasted a new cycle higher. The last article from December 2021 has called a nest in place and an acceleration higher to happen. In fact, we saw a bounce from 166.25-140.96 area towards 221.10 highs. However, the stock price of MTU Aero Engines has decided to perform a double correction. Here, we provide an update.

MTU Monthly Elliott Wave Analysis 10.09.2022​

The monthly chart below shows the MTU stock $MTX traded at XETRA in Frankfurt. From the all-time lows, the stock price has developed a cycle higher in blue wave (I) of a super cycle degree. MTU has printed the all-time highs in January 2020 at 289.30. Without any doubt, the advance is a textbook quality impulsive move up in 5 waves. From January 2020 highs, a sharp straightdown correction in the blue wave (II) has retraced 2/3 of the price. An important bottom has been printed in March 2020 at 97.76 low. From there, a new cycle in wave (III) might have started. Investors can be expecting MTU stock to reach into the new all-time highs. The target will be 388-568 area.

In shorter cycles, from March 2020, one can observe a nest forming. First, wave I of (III) has ended in June 2021 at 224.90. From there, a double correction in wave II is currently in progress and should find support above 97.76 lows. Then acceleration higher in wave III of (III) should take place.

MTU Elliott Wave Weekly

MTU Daily Elliott Wave Analysis 10.09.2022​

The daily chart below shows in more detail the double three correction from the June 2021 highs. Firstly, three swings of black wave ((W)) have reached into 166.25-140.96 area. There, a reaction higher took place. However, it has not broken to the new highs above June 2021. In fact, a connector in wave ((X)) has printed a top in February 2022 at 221.10 highs. Then, black wave ((Y)) has been confirmed by breaking the November 2021 lows. It has reached already the minimum target of 157.50 being 100% extension of the wave ((W)). Now, using the internal structure of the wave ((Y)), blue wave (Y) can reach 100% extension of the blue wave (W) within black ((Y)). Hereby, one can keep an eye on the 137.60 level.

Investors and traders can be looking to buy $MTX from 157.50-118.23 area for an acceleration higher in red wave III of blue wave (III) or for a bounce in 3 waves as minimum.

MTU Elliott Wave Daily

Source: https://elliottwave-forecast.com/stock-market/mtu-aero-double-correction/
 

Elliottwave-Forecast

Master Trader
Feb 17, 2017
2,453
9
84
www.elliottwave-forecast.com
Extra Space Storage Inc (EXR) is a self-administered & self-managed REIT. The company owned &/or operated 1,906 self-storage stores in 40 states. The company offers customers a wide selection of conveniently located & secure storage units across the country, including boat storage, RV storage & business storage. It is based in Salt Lake City, Utah, comes under Real Estate sector & trades as “EXR” ticker as NYSE.

As mentioned in the previous article, EXR made all time high at $228.84 in the impulse sequence started from March-2020 low. Below there, it favors correcting lower in double correction in wave II & confirms below 156.70 low of proposed ((W)).

EXR - Elliott Wave Latest View since March-2020 Low:​

It placed ((1)) at $105.02 high & ((2)) at $80.86 low. ((2)) was 0.764 Fibonacci retracement against ((1)). Above there, it started third wave extension of third wave extension. It finished ((3)) at $194.67 high on 9/08/2021. While below there, it placed ((4)) at $165.97 low as 0.236 retracement against ((3)). Finally, it favored ended ((5)) at $228.84 high on 12/31/2021 as wave I.

EXR - Short term Daily View :​

Below $228.84 high, it placed ((W)) at 156.70 low. Above that level, it favored ended ((X)) at $216.52 high on 8/18/2022. Currently, it favors (A) of ((Y)) leg down & expect small downside before a bounce in (B) leg. ((Y)) will confirms, when breaks below ((W)) low. Ideally, it expect ((Y)) leg to extend lower towards $144.30 - $99.57 area to finish II correction before upside resumes. We like to buy the dips towards blue box area, when reached. As expected from the last updates back on 5/29/2022, it was bounced off from the blue box area.

EXR - Elliott Wave View from 5/29/2022 update:​

Source: https://elliottwave-forecast.com/stock-market/exr-expect-correction-rally-resumes/
 

Elliottwave-Forecast

Master Trader
Feb 17, 2017
2,453
9
84
www.elliottwave-forecast.com
Coinbase Global, Inc., branded Coinbase (COIN), is an American company that operates a cryptocurrency exchange platform. Coinbase is a distributed company; all employees operate via remote work and the company lacks a physical headquarters. It is the largest cryptocurrency exchange in the United States by trading volume. The company was founded in 2012 by Brian Armstrong and Fred Ehrsam.

COIN Daily Chart May 2022

COIN Daily Chart May 2022

In May, we seek to complete a double correction ((W)), ((X)) and ((Y)) from the 369.22 high of wave x, and thus end the entire corrective cycle as wave (II) that began in the peak of 2021. Wave ((Y)) ended at 40.72; however, the rebound has not had the necessary momentum to estimate that the new rally has started. Rather COIN has developed a corrective structure that indicates that it will continue bearish.

COIN Daily Chart Oct 2022​

COIN Daily Chart Oct 2022

As we can see on the chart, COIN bounce shows only 3 bullish waves forming a flat correction. Wave (A) ended at 83.73. Wave (B) finished at 45.74; and from here, we see an expanding ending diagonal to complete wave (C) at 116.70. This structure tells us that it is better to forecast at least 3 more waves to the downside to complete the entire cycle of wave (II) than to look for more upward movement.

Therefore, the structure that started from wave x in red, we change it to a triple correction instead of a double correction. That is why we have labeled the high of 116.70 as wave ((XX)) and we need to break the low of 40.72 to complete wave ((Z)) and wave ((II)) and wait for the rally.

At the moment, we are placing wave (A) as a leading diagonal. Even if we break much lower to complete wave (A), any rally should fail as wave (B). Then, we should look to break 40.72 to finish the whole cycle that started in 2021. This could reach the 23.00 – 30.00 area before continuing the rally.

Source: https://elliottwave-forecast.com/stock-market/coin-continue-lower-cryptos-follow/
 

Elliottwave-Forecast

Master Trader
Feb 17, 2017
2,453
9
84
www.elliottwave-forecast.com
ONEOK, Inc., (OKE) together with its subsidiaries, engages in gathering, processing, storage & transportation of natural gas in the United States. It operates through Natural gas gathering & processing, Natural gas liquids & Natural gas pipelines segments. The company is headquartered in Tulsa, Oklahoma, comes under Energy sector and trades as “OKE” ticket at NYSE.

As discussed in previous blog, below $75.07 high of wave I, it was expected a bounce in connector ((X)) before turning down in ((Y)) leg. Currently, it favors lower in ((Y)) leg in wave II as the part of proposed double three correction.

OKE - Elliott Wave Latest Weekly View :​

Since March-2020 low, it has ended ((1)) at $48.36 high on 6/08/2020 low. Below there, it placed ((2)) at $23.28 low on 9/24/2020 as 0.618 Fibonacci retracement of ((1)). It ended ((3)) at $66.78 high on 10/26/2021. It placed ((4)) at $55.55 low as 0.236 Fibonacci retracement. Finally, it ended ((5)) as diagonal at $75.07 high on 4/21/2022 high as wave I impulse sequence from March-2020 low. Below there, it correcting lower in II correction, which expect to unfold in double correction.

OKE - Elliott Wave Latest Daily View :​

Below $75.07 high, it ended ((W)) at $52.19 low & ((X)) at $66.86 high. While below there, it favors lower in ((Y)) leg as it already breaks below ((W)) low. Currently, it favors lower in 5 of (A) & expect one more low below wave 3 before a bounce in (B) leg. Later it expect (C) to extend lower towards $43.88 - $29.68 area to finish the correction in II before upside resumes. Alternatively, it might ended (W) of ((Y)) leg & bouncing higher in (X) connector followed by (Y) towards blue box area. In any of the case, we like to buy the dips towards blue box area for wave III higher or at least larger 3 swing bounce.

OKE - Elliott wave View from 7/31/2022 :​

Source: https://elliottwave-forecast.com/stock-market/oke-expect-double-correction-upside-resumes/
 

Elliottwave-Forecast

Master Trader
Feb 17, 2017
2,453
9
84
www.elliottwave-forecast.com
In this technical blog we’re going to take a quick look at the Elliott Wave charts of Amazon $AMZN. As our members know, Amazon stock has been showing incomplete bearish sequences in the cycle from the August 16th peak. We recommended members to avoid buying the stock and keep favoring the short side due to incomplete sequences. Cycle from the 146.6 peak was incomplete and we knew the drop was coming . In the further text we are going to explain the Elliott Wave Forecast.

Amazon $AMZN Elliott Wave Analysis 09.18.2022​

Decline from the 146.61 unfolded as 5 waves structure- ((A)) black, after which we got 3 waves bounce in ((B)) . Eventually the stock made turn lower again break of of the September 1st low which made incomplete bearish sequences. Amazon stock is showing lower low structure from the 146.61 peak. The stock is targeting 115.01-100.86 area where it is expected to complete Elliott Wave Zig Zag Pattern. From that zone we expect to see larger bounce in 3 waves at least.

Reminder: You can learn about Elliott Wave Rules and Patterns at our Free Elliott Wave Educational Web Page.

Amazon

Amazon $AMZN Elliott Wave Analysis 10.02.2022​

The stock continued trading lower as expected. The price has reached target at 115.01-100.86. We got 3 waves bounce from there and another break down. Current view suggests cycle from the 146.61 looks to be unfolding as 5 waves structure rather than Zig Zag.

Keep in mind that market is dynamic and presented view could have changed in the mean time. You can check most recent charts in the membership area of the site. Best instruments to trade are those having incomplete bullish or bearish swings sequences. We put them in Sequence Report and best among them are shown in the Live Trading Room.

Amazon
Source: https://elliottwave-forecast.com/stock-market/amazon-incomplete-sequences-decline/
 

Elliottwave-Forecast

Master Trader
Feb 17, 2017
2,453
9
84
www.elliottwave-forecast.com
Good day Traders and Investors. In today’s article, we will look at the past performance of 1 Hour Elliottwave chart of Alibaba ($BABA). The decline from 06.09.2022 high is unfolding as a 5 swings and made a lower low on 09.16.2022 which created a bearish sequence in the 4H timeframe. Therefore, we knew that the structure in $BABA is incomplete to the downside & should see more weakness. So, we advised members to sell the bounces in 3, 7, or 11 swings at the blue box area. We will explain the structure & forecast below:

$BABA 1H Elliottwave Chart 10.04.2022:​

alibaba

Here is the 1H Elliottwave count from 10.04.2022. The decline from 09.12.2022 unfolded in 5 waves creating a bearish sequence. We were calling for the bounce to fail in 3 swings at red 4 where we like to sell it at the equal legs at $82.67 with a stop at $86.34.

$BABA Latest Elliottwave Chart:​

alibaba

Here is the 10.16.2022 1H update showing the move taking place as expected. The stock has reacted lower from the blue box allowing any shorts to get risk free shortly after taking the position. Currently, the stock has already made a new low in 5 swings and shorts should be out with profits before a bounce can take place in 3 swings at least.

Source: https://elliottwave-forecast.com/uncategorized/alibaba-baba-perfect-reaction-lower-blue-box-area/
 

Elliottwave-Forecast

Master Trader
Feb 17, 2017
2,453
9
84
www.elliottwave-forecast.com
The Procter & Gamble ticket symbol: PG is a company focused on providing branded consumer packaged goods to consumers across the world. The Company operates through five segments: Beauty, Grooming, Health Care, Fabric & Home Care, and Baby, Feminine & Family Care. The Company sells its products in approximately 180 countries and territories primarily through mass merchandisers. Grocery stores, membership club stores, drug stores, department stores, distributors, baby stores, specialty beauty stores, e-commerce, high-frequency stores, and pharmacies. We will look at the Elliott wave view for PG below:

PG Weekly Elliott Wave Chart​


Above is the Weekly time frame Elliott wave chart of PG. In which, the stock is correcting the cycle from April 2018 low. So far the decline from the 21 January 2022 peak is unfolding as an Elliott wave double three structure where the first leg ended in the wave w at $129.50 low. Up from there, a bounce to $150.63 high ended wave x and started the y leg lower. Now, as far as it remains below $150.63 high expect the stock to extend lower towards the $114.82- $92.67 blue box area. From there, buyers are expected to appear looking for wave (III) higher or should do a big 3 wave bounce at least.

Source: https://elliottwave-forecast.com/stock-market/procter-gamble-pg-looking-reach-extreme/
 

Elliottwave-Forecast

Master Trader
Feb 17, 2017
2,453
9
84
www.elliottwave-forecast.com
Lumber, also known as timber, is a type of wood that has been processed into beams and planks. One can trade it in form of Random Length Lumber futures and options at Chicago Mercantile Exchange within the agriculture asset class under the ticker $LBS. In 2020, we saw commodities turning higher. Since January 2021, rally in US Dollar executes pressure on commodity prices in general and on agriculture prices in particular. As a matter of fact, the lumber saw the ups and downs. In May 2021, it has printed the all-time highs at 1711.2. Then, it has seen the low in August 2021 at 448. In the last article from November 2021, we have expected a rally to happen. Indeed, the lumber prices reached higher towards 1477.4 in March 2022 without breaking to new all-time highs. Now, we see a larger correction taking place. Here, we provide an updated view of a historic double correction against the zero level.

Lumber Monthly Elliott Wave Analysis 10.18.2022​

The monthly chart below shows the lumber front contract LBS #F. From the all-time lows, the prices have developed a cycle higher in blue wave (w) of a super cycle degree. It is a choppy and overlapping structure in series of 3. Therefore, the best count is to see the advance towards May 2018 highs at 648.5 as a double three pattern. From there, a correction lower in wave (x) has ended in April 2020 at 251.5. From the lows, a break to the new all-time highs has confirmed a new cycle higher in blue wave (y). Hereby, wave (y) has extended in 3 impressively strong swings towards the new all-time highs in May 2021 at 1711.2.

From the all-time highs in May 2021, a pullback in wave (a) has brought the prices down to 448 lows. The timber has lost 74% off the highs in only 3 months. From the lows, the bounce in wave (b) has failed below May 2021 highs. Now, wave (c) of ((x)) is still in progress and it provides a historic opportunity to enter the market for long term investors.

For 2023-2030, the expectations are to see the end of the consolidation and more upside within a new cycle as black wave ((y)). Investors should target 1711.2 highs and beyond in the long run.

Lumber Elliott Wave Monthly

Lumber Daily Elliott Wave Analysis 10.18.2022​

The daily chart below shows in more detail the pullback from the all-time highs within black wave ((x)). From the high at 1711.2, the decline is an Elliott wave zigzag pattern being a 5-3-5 structure. Firstly, blue wave (a) has printed a bottom at 448 low in August 2021. Secondly, three swings of a blue wave (b) have set a connector at 1477.4 in March 2022. Then, a decline in blue wave (c) has broken 448 lows opening up a bearish sequence. Now, the prices should extend lower to complete the sequence.

Investors and traders can be looking to buy $LBS from 216.5-0.0 area for a rally targeting 1711.2 highs and beyond in the long run.

Lumber Elliott Wave Daily

Source: https://elliottwave-forecast.com/commodities/lumber-double-correction/
 

Elliottwave-Forecast

Master Trader
Feb 17, 2017
2,453
9
84
www.elliottwave-forecast.com
A lot has been said and written about both the Democrat and Republican economic plans for a better economy. We believe in free enterprise and limited regulation, allowing humans to create and expand at their will for the better, but there is a vast difference between the two parties regarding the economic agenda. Most of the time, the Democratic side is for a bigger government, more extensive regulations, and higher taxes. However, on the opposite end, the Republican side is for less government, less regulation, and fewer taxes. The SPX is the representation of free enterprise and capitalism. Therefore the Democratic agenda does not fit with the Index advancement, as their agenda tends to limit free enterprise. The following chart displays all presidential terms since James Carter’s 1977 inauguration placed over the monthly SPX chart.

SPX Performance and US Presidential Cycles​


There are very interesting key points and eye-opening statements that can be made about how each presidential term has affected the SPX over the years. The index expansion and growth over the years have been fantastic and it is expected that more growth will continue as human nature will always be bullish. Similar to how a correction occurred between 2000-2009, the trend will always be higher.

Key Points:

  1. The most significant economic advancement was under Donald J Trump. Considering that he was only president for one term, the gap from his opening to his last day was +1547 points. He outperformed all previous presidents in one term, even when Covid-19 created a pullback by itself.
  2. There has been only one negative presidency: George W. Bush, who finished -506 points for his two terms as president.
  3. Two term presidents Barack H. Obama and William J. Clinton performed very well, but nothing compared to what Donald J Trump did in one term.
  4. The expansion since 1992, makes only Clinton, Obama, and Trump close to or above the 1000 points line during their presidential terms.
  5. George W. Bush was the only negative president post-expansion in 1992, which makes his 2 terms strange since he was a Republican president.
  6. Joseph R Biden Jr is at the moment, the second president which is negative in his term, however, there are still two remaining years before his term is over.
  7. Before 1992, Ronald Reagan had the most significant advance of the three presidents, with a plus 155 points.
  8. George Bush's performance was very good, considering it was only one term.
We at ElliottWave-Forecast always look at the charts with the Elliott Wave Theory in mind. We can see that the president is sometimes either guilty or benefiting from the market timing; as an example, Barack H Obama entered office in 2009; at that moment, the market was in the process of ending a clear three waves correction from George W. Bush 2 terms, so Obama's SPX advance had a lot to do with the timing other than his administration economic agenda. It was hard to see a lower market in 2009 when Obama took office, because many stocks in transportation and financing could not trade lower or they will go out of business. They were named “Too Big to Fail”. At the same time, from when George W. Bush took office there was a five waves advance that can be clearly seen from the lows in the Carter era, so he was guilty of bad timing.

In conclusion, we believe the Republican agenda, which is based on free enterprise and less regulation will always be better for the country's overall economy. Based on the data and the chart we presented, there is nothing explicit on which point one party's agenda is better than the other. The chart shows the biggest winner is a Republican, Donald J. Trump in one term. However, the most significant loss is also a Republican, George W. Bush. We believe the market performance is based on other factors including market makers, high-frequency machines, cycles and not only on an administration's economic agenda even when the agenda can help the overall environment of the country's well-being. Timing and luck also plays a role during a president’s term which can heavily sway the president's performance and its relationship with the economy.

Source: https://elliottwave-forecast.com/stock-market/us-president-cycles-and-the-spx-performance/
 

Elliottwave-Forecast

Master Trader
Feb 17, 2017
2,453
9
84
www.elliottwave-forecast.com
Eramet is a French multinational mining and metallurgy company. The company produces non-ferrous metals and derivatives, nickel alloys and superalloys, as well as high-performance special steels. Founded in 1880 with the funding of the Rothschild family and headquartered in Paris, today, the company is largely owned by Duval family and the French state. Eramet is a part of CAC Mid 60 index and can be traded under the ticket $ERA at Euronext Paris.

Long term, we see commodities in general and metals in particular strongly turning up. In consequence, company like Eramet should see strong support in the overall bullish market. Therefore, investors can be looking to buy Eramet in order to diversify their portfolio by indirect investment in rising metal prices.

In the initial article from Septmber 2021, we have explained the huge potential for prices to rally. Indeed, the market has advanced towards March 2022 highs at 166. Now, we see a pullback to correct the cycle from March 2020. Hereby, investors can be using it as an opportunity to join the rally. Here, we provide an update including levels to buy.

Eramet Monthly Elliott Wave Analysis 10.22.2022​

The monthly chart below shows the Eramet stock $ERA traded at Euronext. From the all-time lows, the stock price has developed a cycle higher in black wave ((I)) of grand super cycle degree towards the all-time highs on May 2008 at 669.98. From the highs, a correction lower in black wave ((II)) has unfolded as an Elliott wave zigzag pattern. It has printed an important bottom in February 2016 at 15.36. From the lows, a new cycle in wave ((III)) has already started and should extend towards 669.98 highs and even higher.

Within wave ((III)), one can see one nest in place and another one buidling up. Indeed, red wave I of blue wave (I) has ended at 167.20 highs. Then, a pullback in wave II has found support at 18.66 on March 2020. While above there, a new cycle in red wave III of (I) is already in progress. The target for wave III will be 171.13-265.55 area and even higher.

Within red wave III, one can distinguish another nest in progress. As a mattare of fact, from March 2020 lows, a cycle within black wave ((1)) of red III has ended on March 2022 at 166. From there, a pullback in wave ((2)) is still in progress and should find support in 7 or 11 swings above 18.66 lows. Then, an acceleration higher in wave ((3)) of III should take place.

Eramet Elliott Wave Monthly

Eramet Daily Elliott Wave Analysis 10.22.2022​

The daily chart below shows in more detail the final stages of the black wave ((1)) and the consolidation lower in black wave ((2)) within red wave III. An impulse in black wave ((1)) has printed a top at 166 in March 2022. From there, 3 swings of blue wave (W) have ended in July 2022 at 84.45. Then, a bounce in blue wave (X) has set a connector at 108.59 in August 2022. Later, the prices have broken 84.45 lows opening up a bearish sequence. Now, one should expect more downside within blue wave (Y) towards 26.97 being 100% extension of the wave (W) to complete that sequence.

Investors and traders can be looking to buy Eramet in a pullback from 26.98-18.66 area. There, an acceleration higher in black wave ((3)) of red wave III should take place. Alternatively, one can expect a bounce in 3 waves as minimum.

Eramet Elliott Wave Daily

Source: https://elliottwave-forecast.com/stock-market/eramet-opportunity-joining-rally/
 

Elliottwave-Forecast

Master Trader
Feb 17, 2017
2,453
9
84
www.elliottwave-forecast.com
Good day Traders and Investors. In today’s article, we will look at the past performance of 4 Hour Elliottwave chart of Bank of America ($BAC). The decline from 08.16.2022 high is unfolding as a 5 swings and made a lower low on 10.13.2022 which created a bearish sequence in the 4H timeframe. Therefore, we knew that the structure in $BAC is incomplete to the downside & should see more weakness in 3 or 7 swings against 08.16.2022 peak. So, we advised members to sell the bounces in 3, 7, or 11 swings at the blue box area. We will explain the structure & forecast below:

$BAC 4H Elliottwave Chart 10.17.2022:​

$BAC

Here is the 4H Elliottwave count from 10.17.2022. The decline from 08.16.2022 unfolded in 5 waves breaking below 07.14.2022 low creating a bearish sequence. We were calling for the bounce to fail in 3 swings at black ((2)) where we like to sell it at the equal legs at $35.00 with a stop at $36.93.

$BAC Latest Elliottwave Chart:​

$BAC

Here is the 10.20.2022 4H update showing the move taking place as expected. The stock has reacted lower from the blue box to reach the 50% back from blue (B) allowing any shorts to get risk free shortly after taking the position.

Source: https://elliottwave-forecast.com/stock-market/bank-america-bac-perfect-reaction-lower-blue-box-area/
 

Elliottwave-Forecast

Master Trader
Feb 17, 2017
2,453
9
84
www.elliottwave-forecast.com
The Borsa İstanbul (BIST or XU100) is the sole exchange entity of Turkey combining the former Istanbul Stock Exchange (ISE), the Istanbul Gold Exchange and the Derivatives Exchange of Turkey under one umbrella. It was established as an incorporated company with a founding capital of ₺423,234,000 (approx. US$240 million) on 2013 and began to operate on April 5, 2013. Its logo is the traditional Ottoman mark for Istanbul, the tulip. Its slogan is worth investing.

XU100 4 HOUR CHART JUNE 2022

XU100 4 HOUR CHART JUNE 2022

Last time when we discussed about XU100, we were looking to end an impulse to complete wave (III) and expect 3, 7 or 11 swings retracement into wave ((4)) zone before continuing to rally. This rally widened almost 70% since the first days of July. This has caused us to adjust the count because wave V has extended, and it is not completed yet.

XU100 DAILY CHART OCTOBER 2022

XU100 DAILY CHART OCTOBER 2022

We can see on October chart, that the impulse we called wave V of (III) on the XU100, turned out to be just wave ((1)) of V. Wave ((1)) ended at 2684 and wave ((2)) made a zigzag correction to end at 2426. The uptrend continued to reach 3715 to end wave ((3)). Then the retracement of wave ((4)) made a double correction that ended at 3240, retracing almost 50% of wave ((3)).

We are currently building wave ((5)) of V which could bring a strong pullback taking the index below 3200. Near term, we are developing wave (3) of ((5)). Then we need a wave (4) and (5) to complete the cycle before thinking in a pullback. The correction could begin at any time, but now we could see the index to reach around 4130 to complete wave (III). Then we should see 3, 7, or 11 swings lower as wave (IV) before resuming the rally again.

Source: https://elliottwave-forecast.com/stock-market/bist-xu100-drop-test-wave-4/