Elliottwave-Forecast

Master Trader
Feb 17, 2017
2,462
9
84
www.elliottwave-forecast.com
Red Rock Resorts Inc., (RRR) develops & operates casino & entertainment properties in the US. It operates through two segments, Las Vegas Operations & Native American Management. It is based in Las Vegas, comes under Consumer Cyclical sector & trades as “RRR” ticker at Nasdaq.

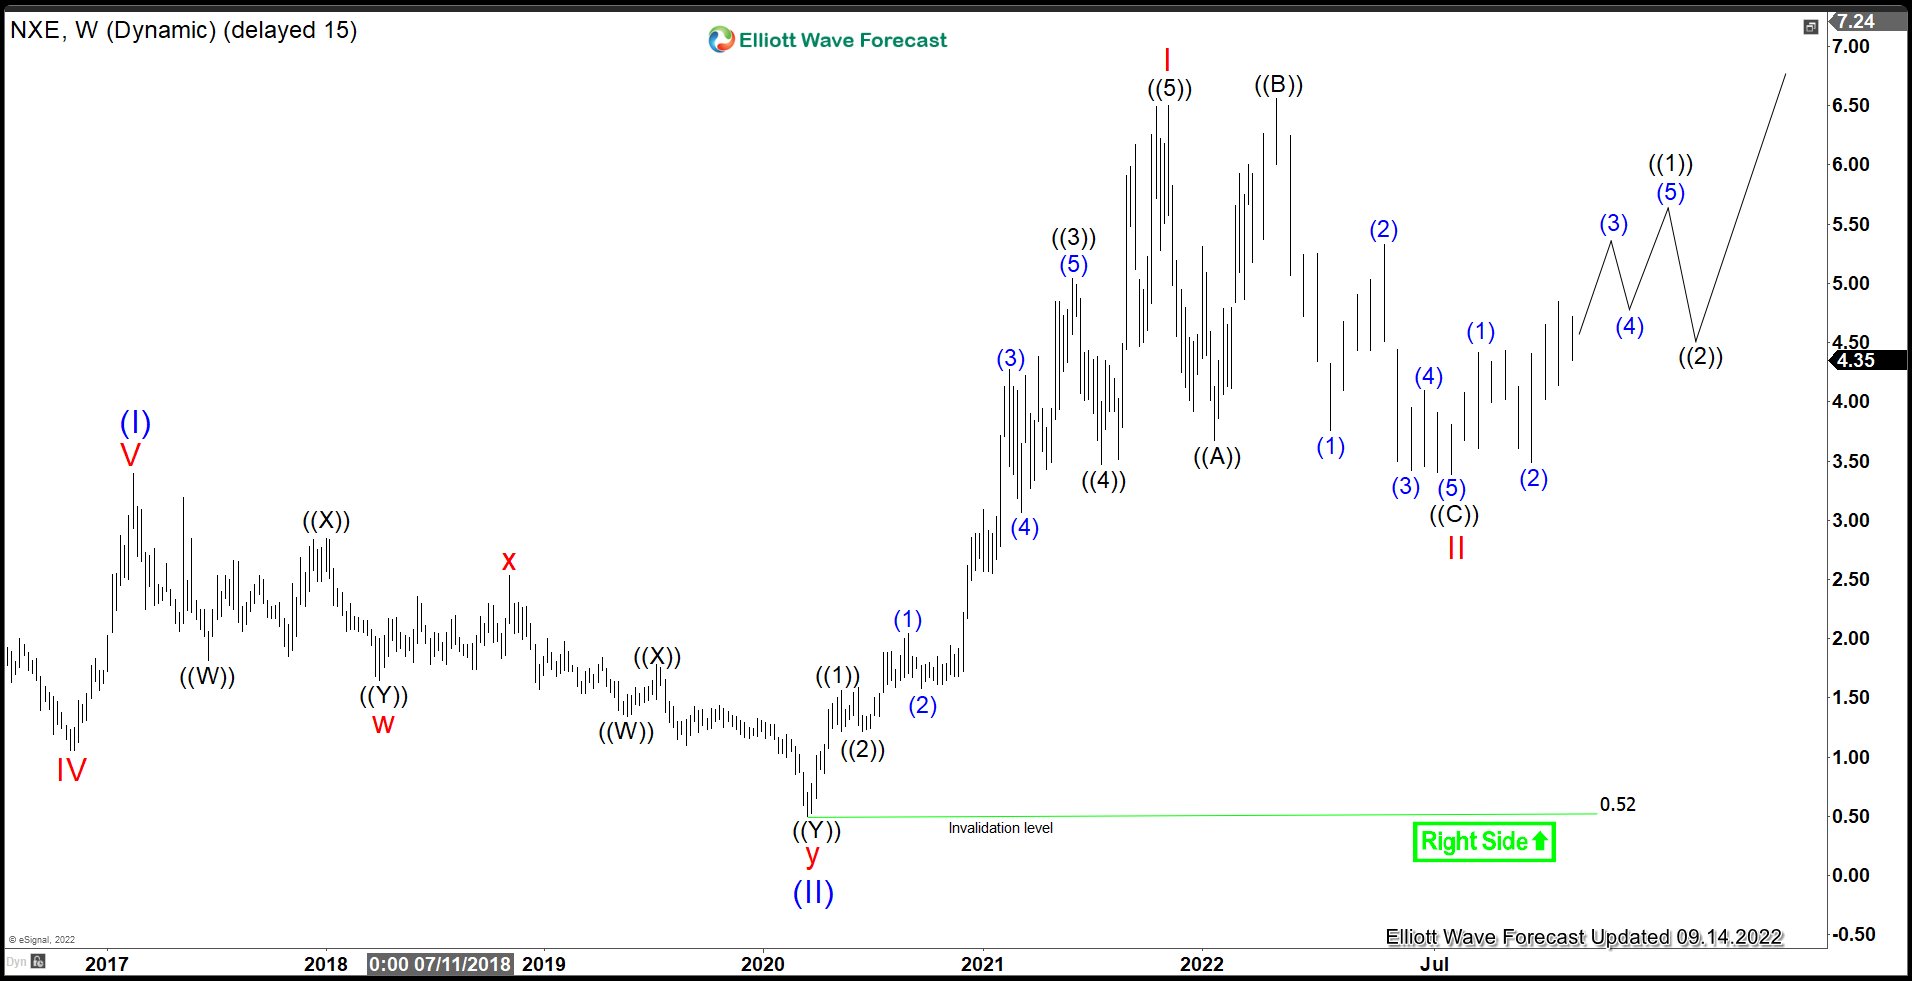
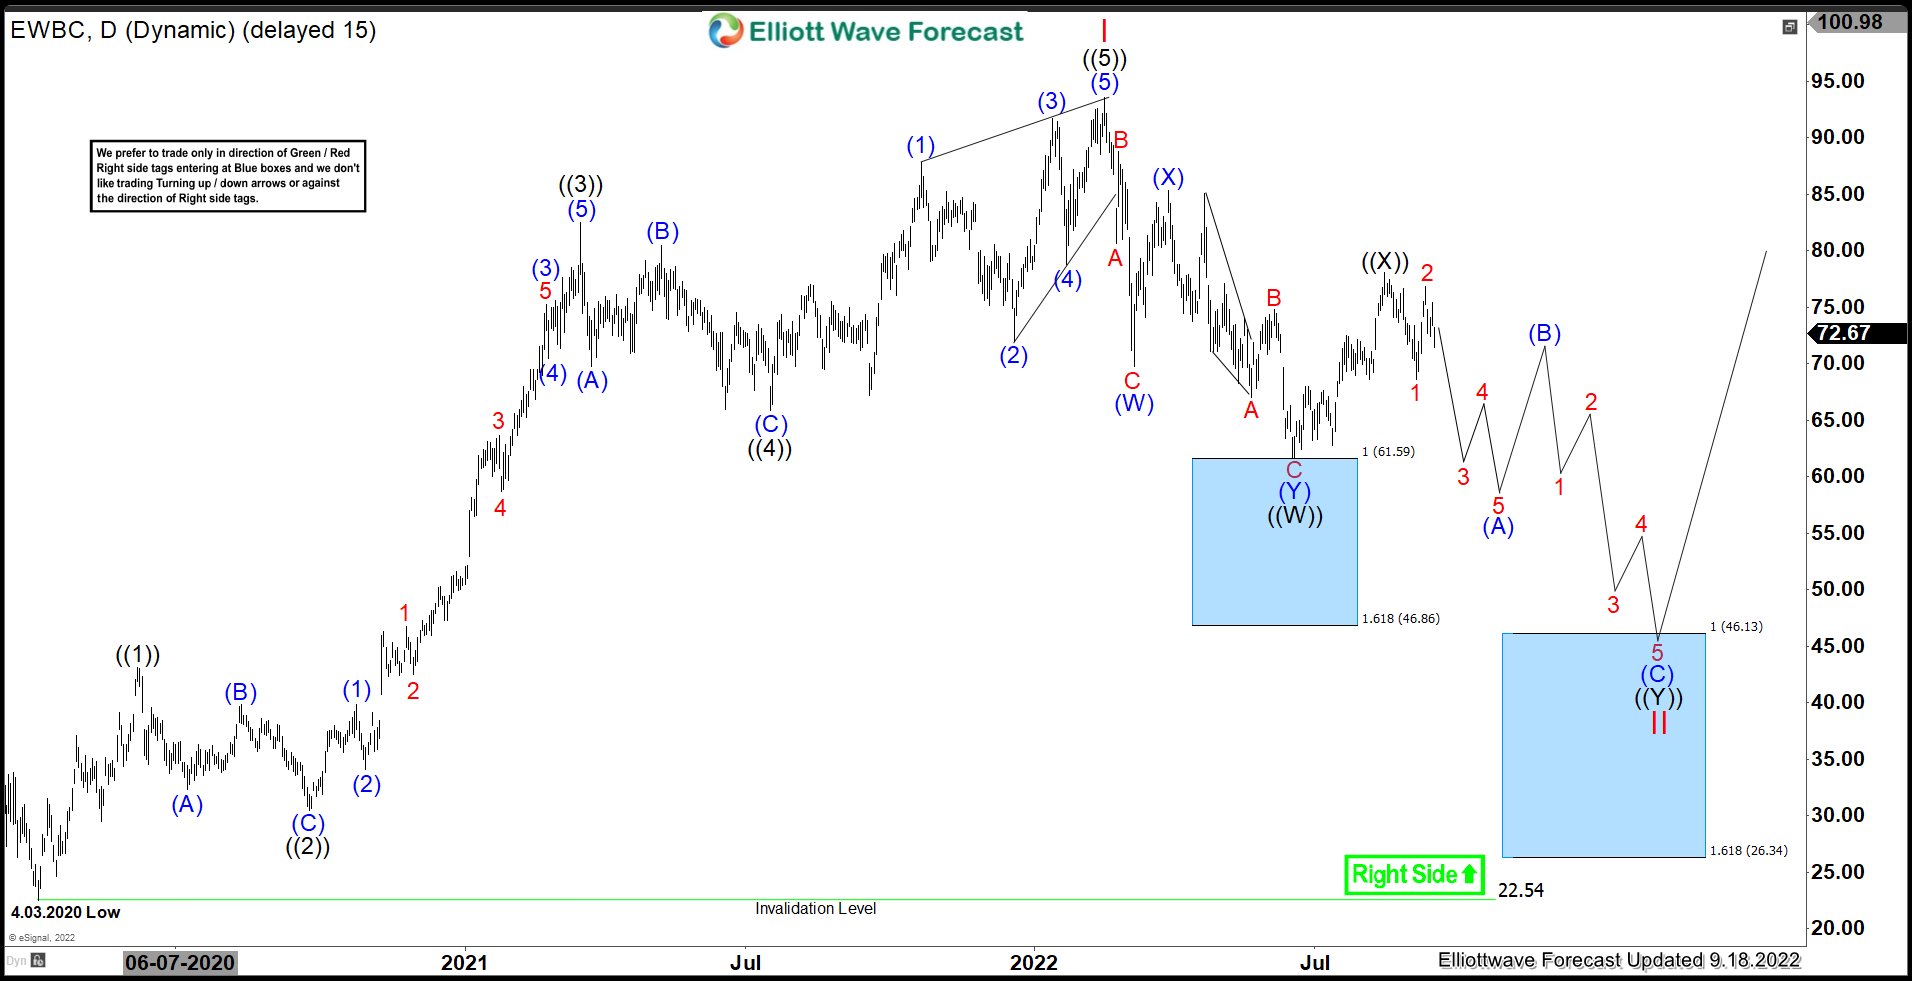
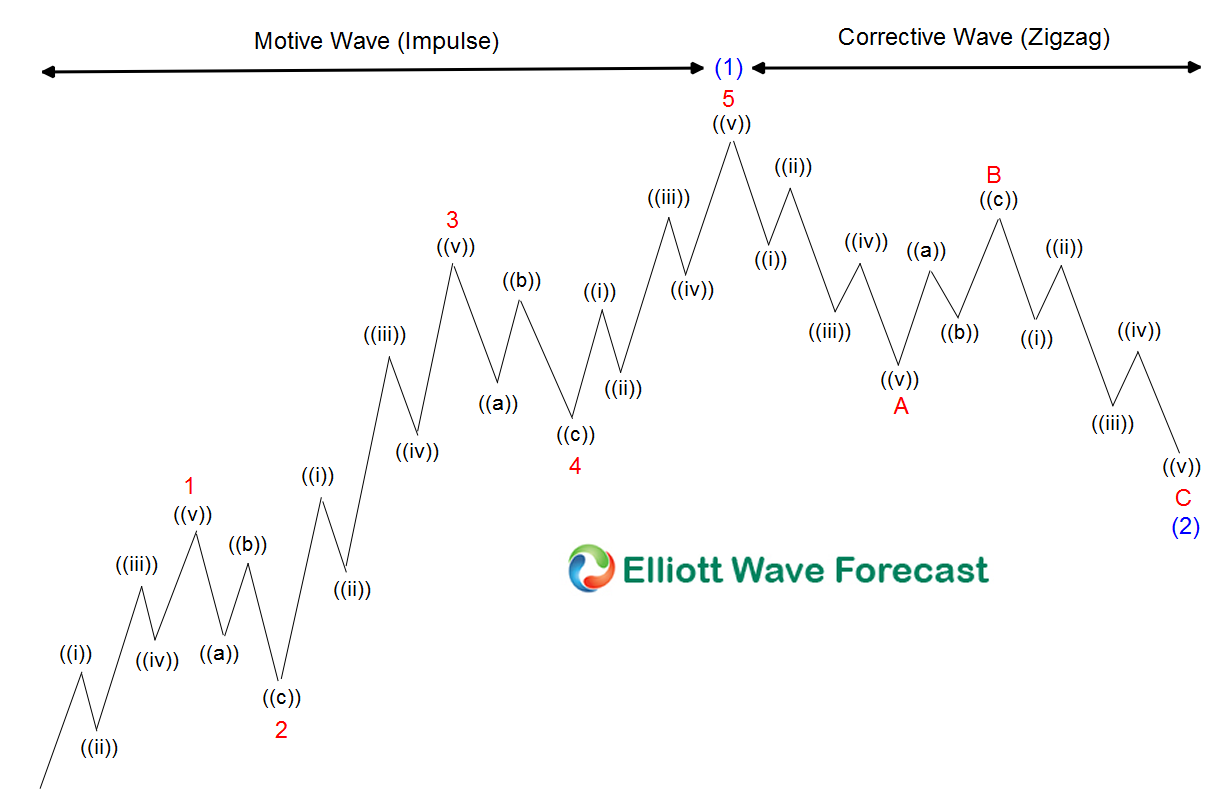
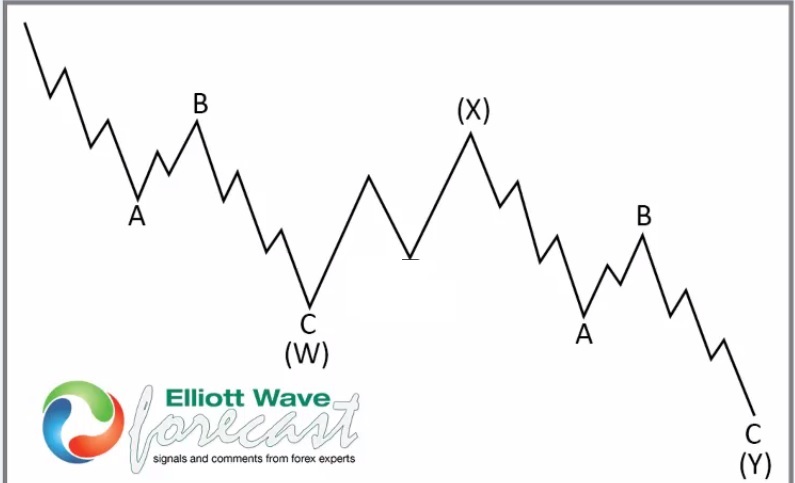
RRR made all time at $2.76 during global sell off in early 2020. Then it ended impulse sequence at $58.74 high on 10/26/2021 as wave I. Below there, it favors correcting lower in II & expect double three correction to unfold.

RRR - Elliott Wave Latest Daily View :​

It made ATL at $2.76 on 3/18/2020 & above there, it placed ((1)) at $11.99 on 4/09/2020 & ((2)) at $7.50. ((2)) was 0.5 fib retracement against ((1)). Above there, it started third wave extension & placed ((3)) at $46.61 on 6/02/2021. It placed ((4)) at $37.05 as 0.236 fib retracement against ((3)) as shallow correction. Finally, it ended ((5)) at $58.74 high on 10/26/2021 as I wave & below there, it started pulling back in II.

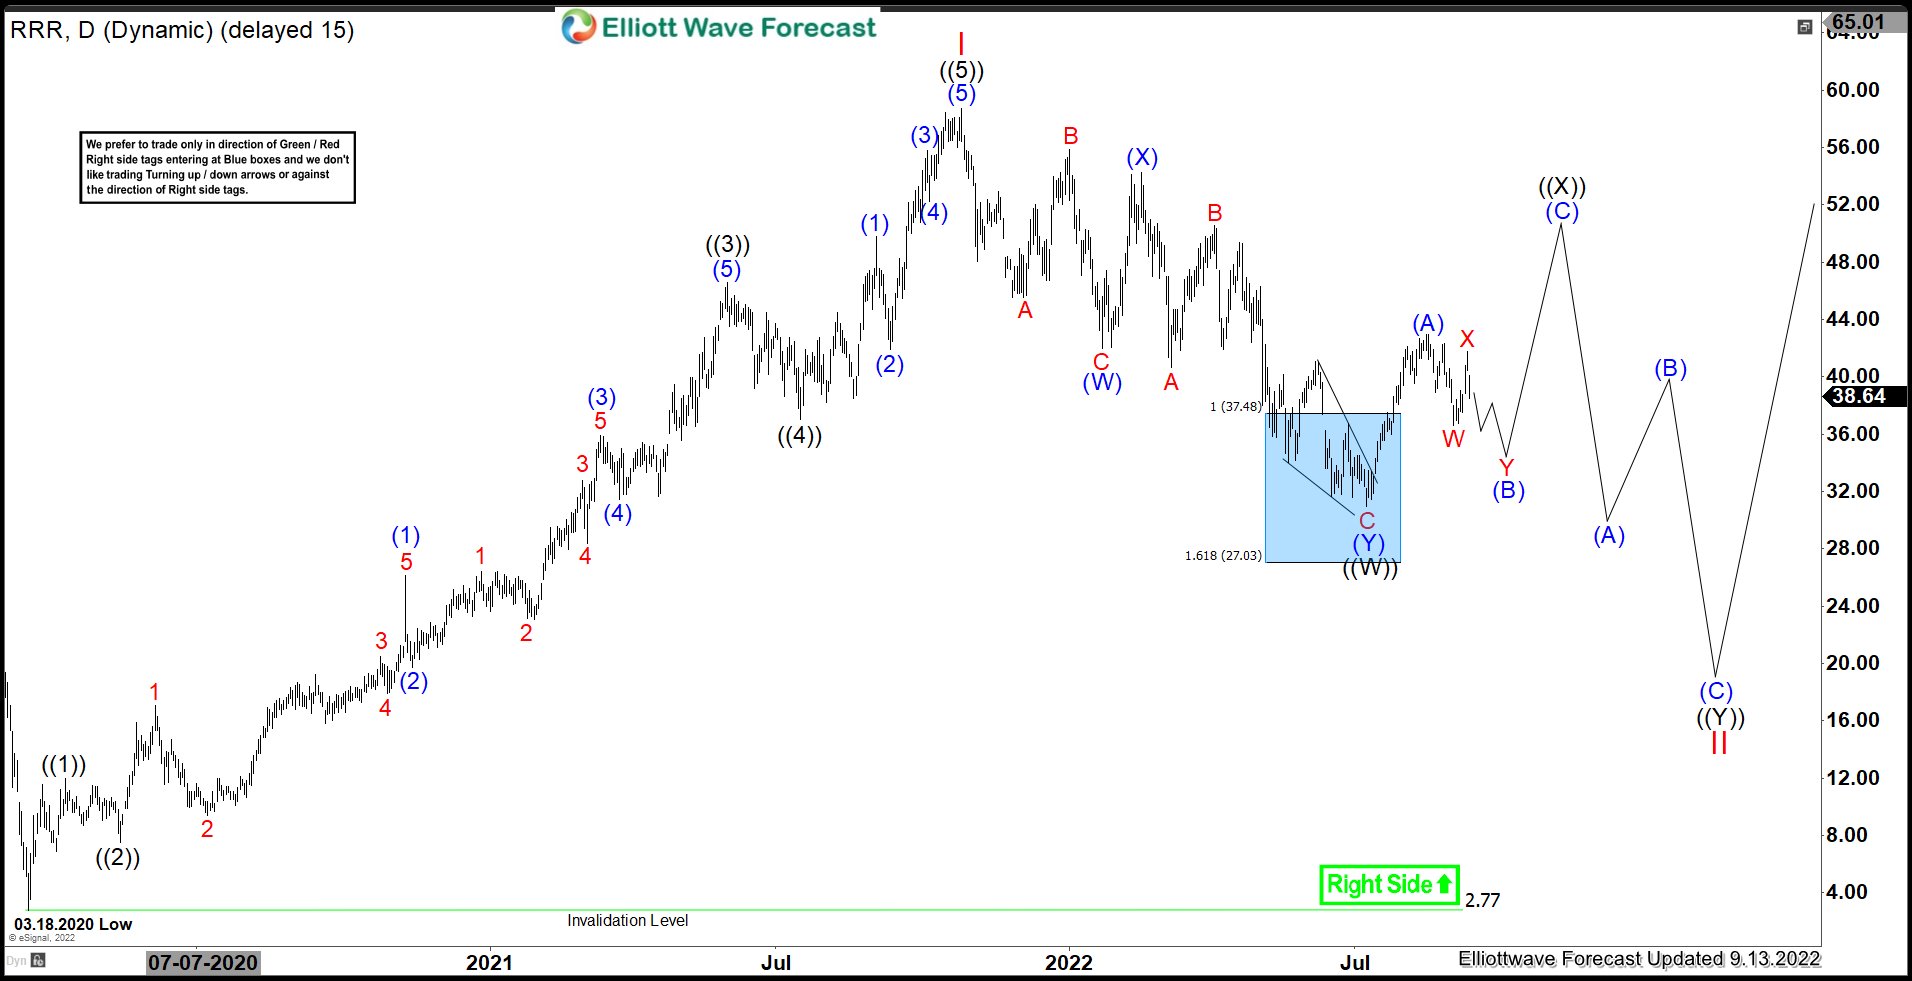
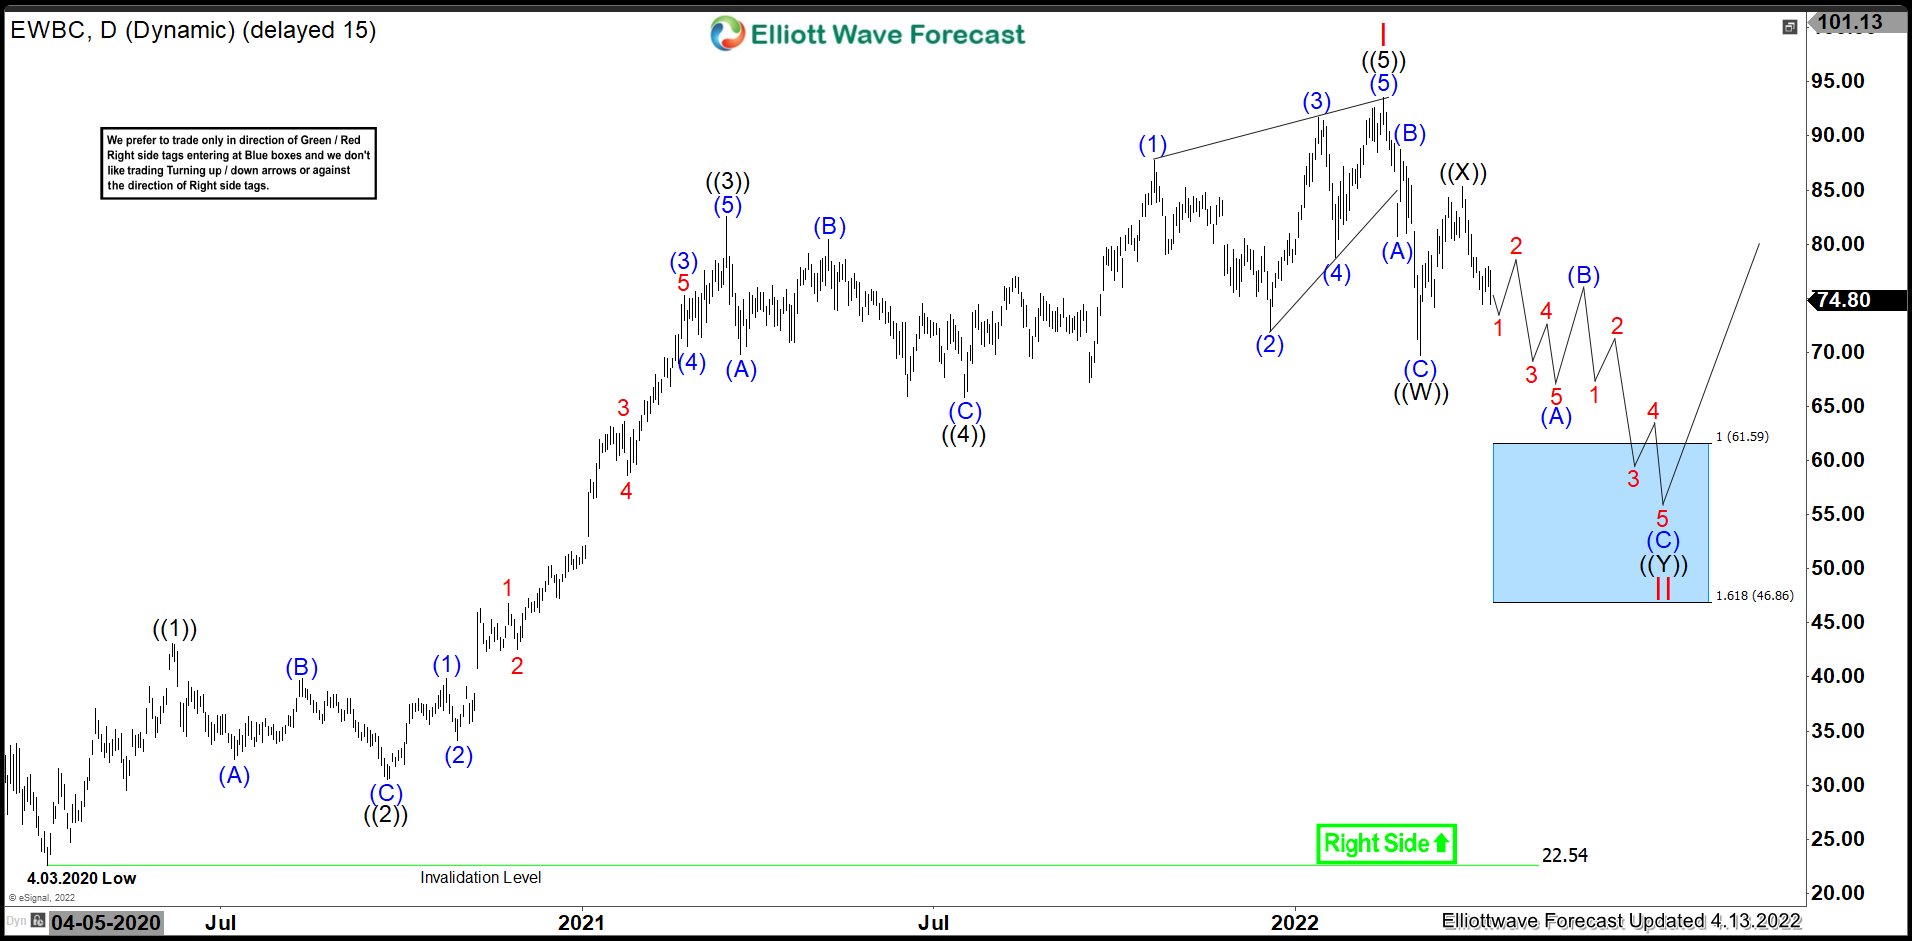
RRR - Elliott Wave View From 4/27/2022 Updates:​

In previous blog, it was expected to bounce from blue box area between $37.48 – $27.03 after ending the correction. It reacted from the blue box as expected & favors 3 swings bounce before another leg may resumes lower, while bounce fails below wave I high. It expecting a larger double correction in wave II before upside resumes. The buyers from the blue box area, already should be risk free. We like to buy the dips again, if it reaches the equal leg areas in ((Y)) leg in wave II.

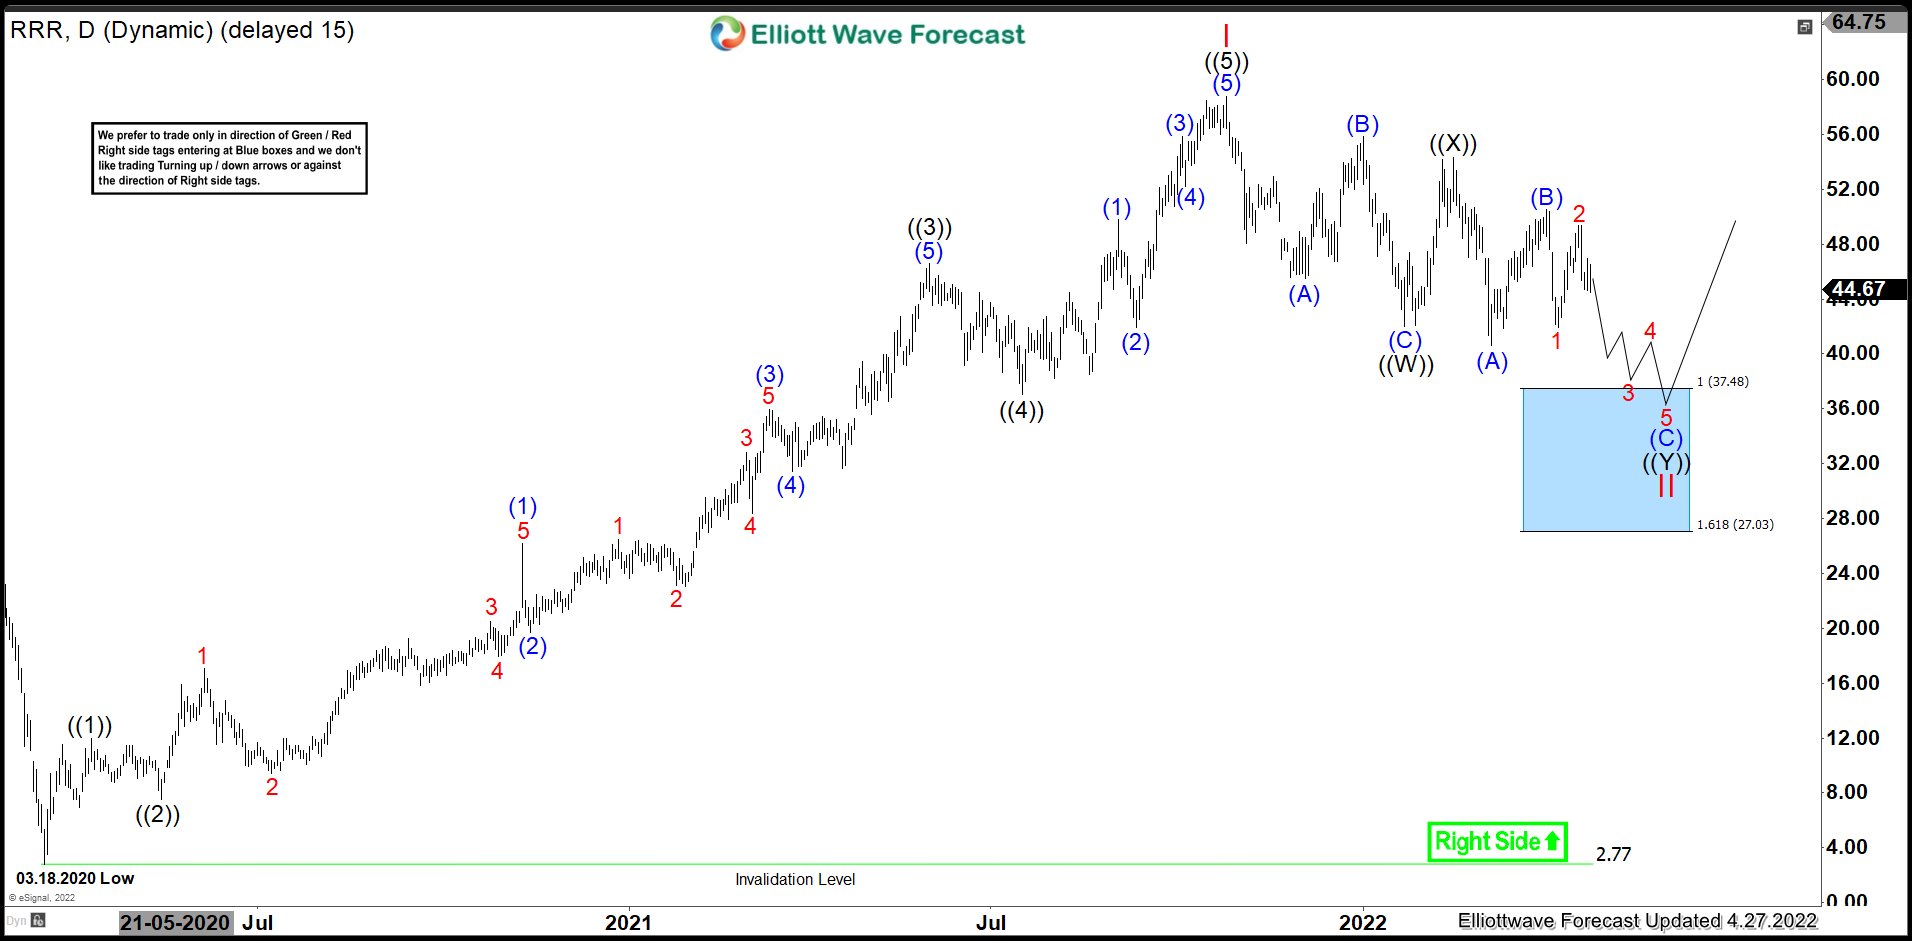
Source: https://elliottwave-forecast.com/stock-market/rrr-expecting-larger-correction-before-rally-resumes/
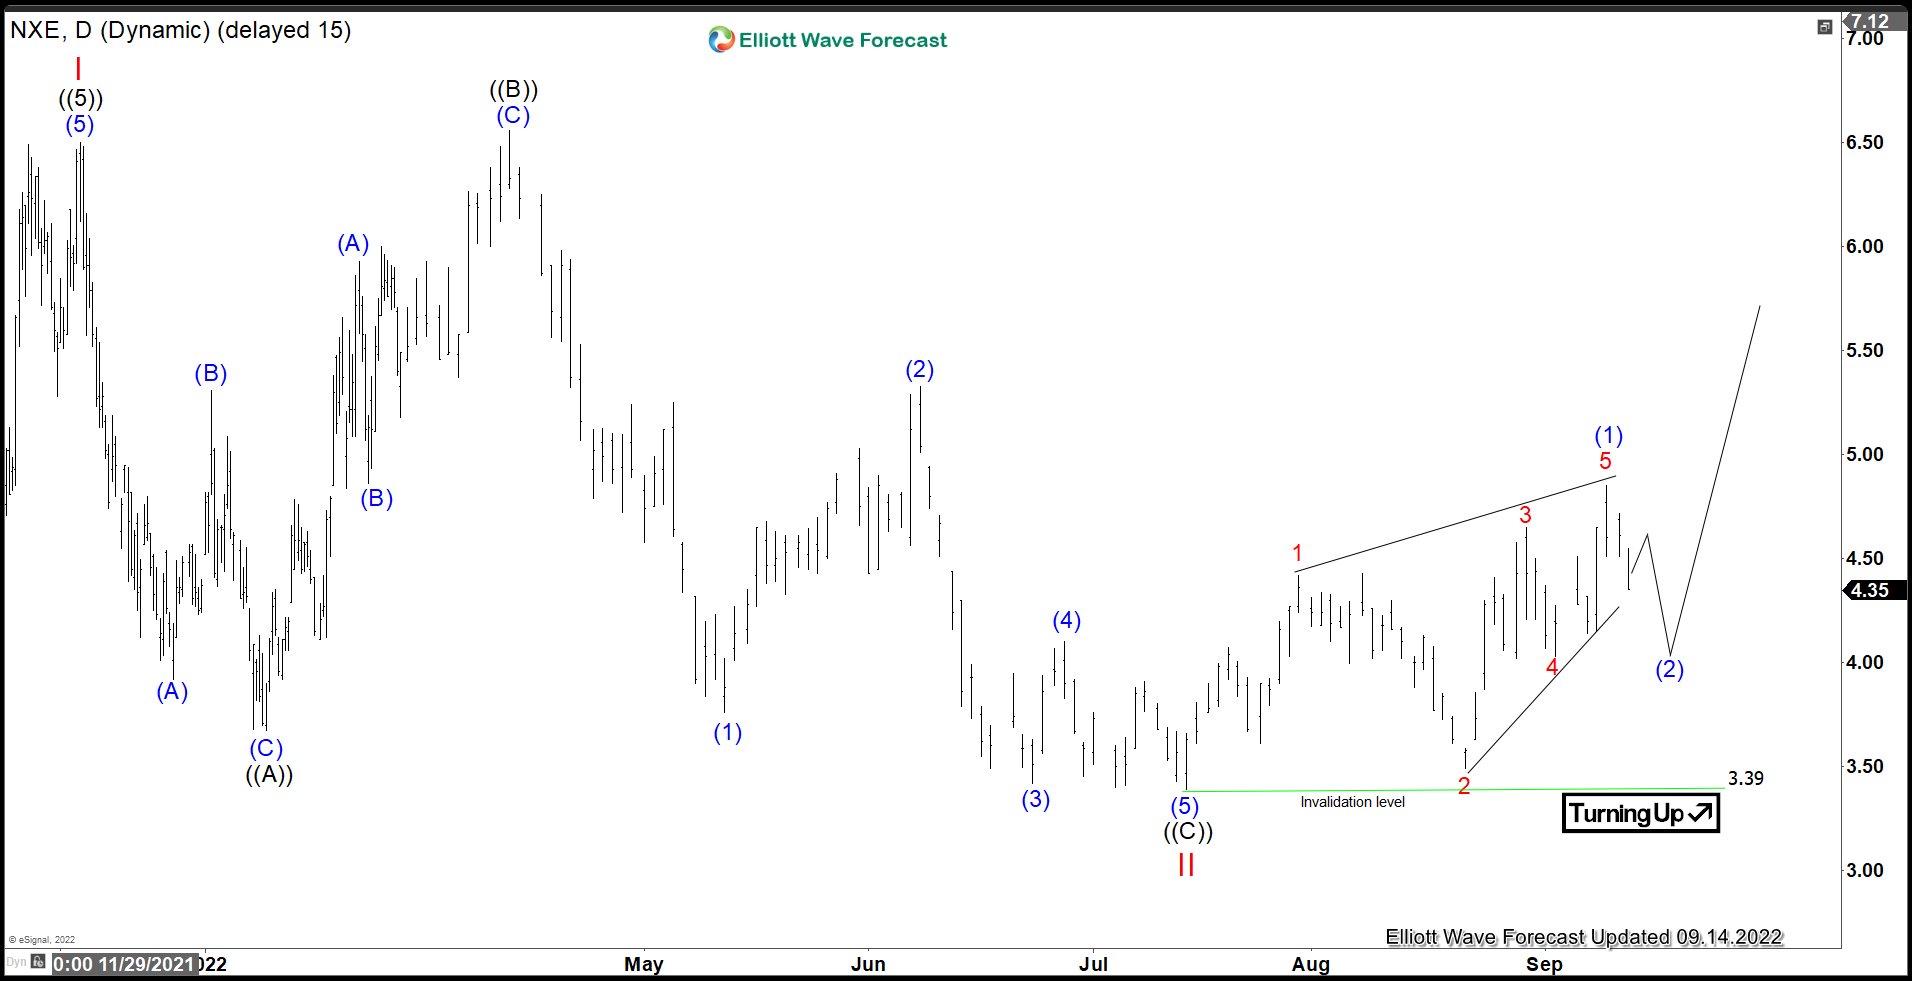
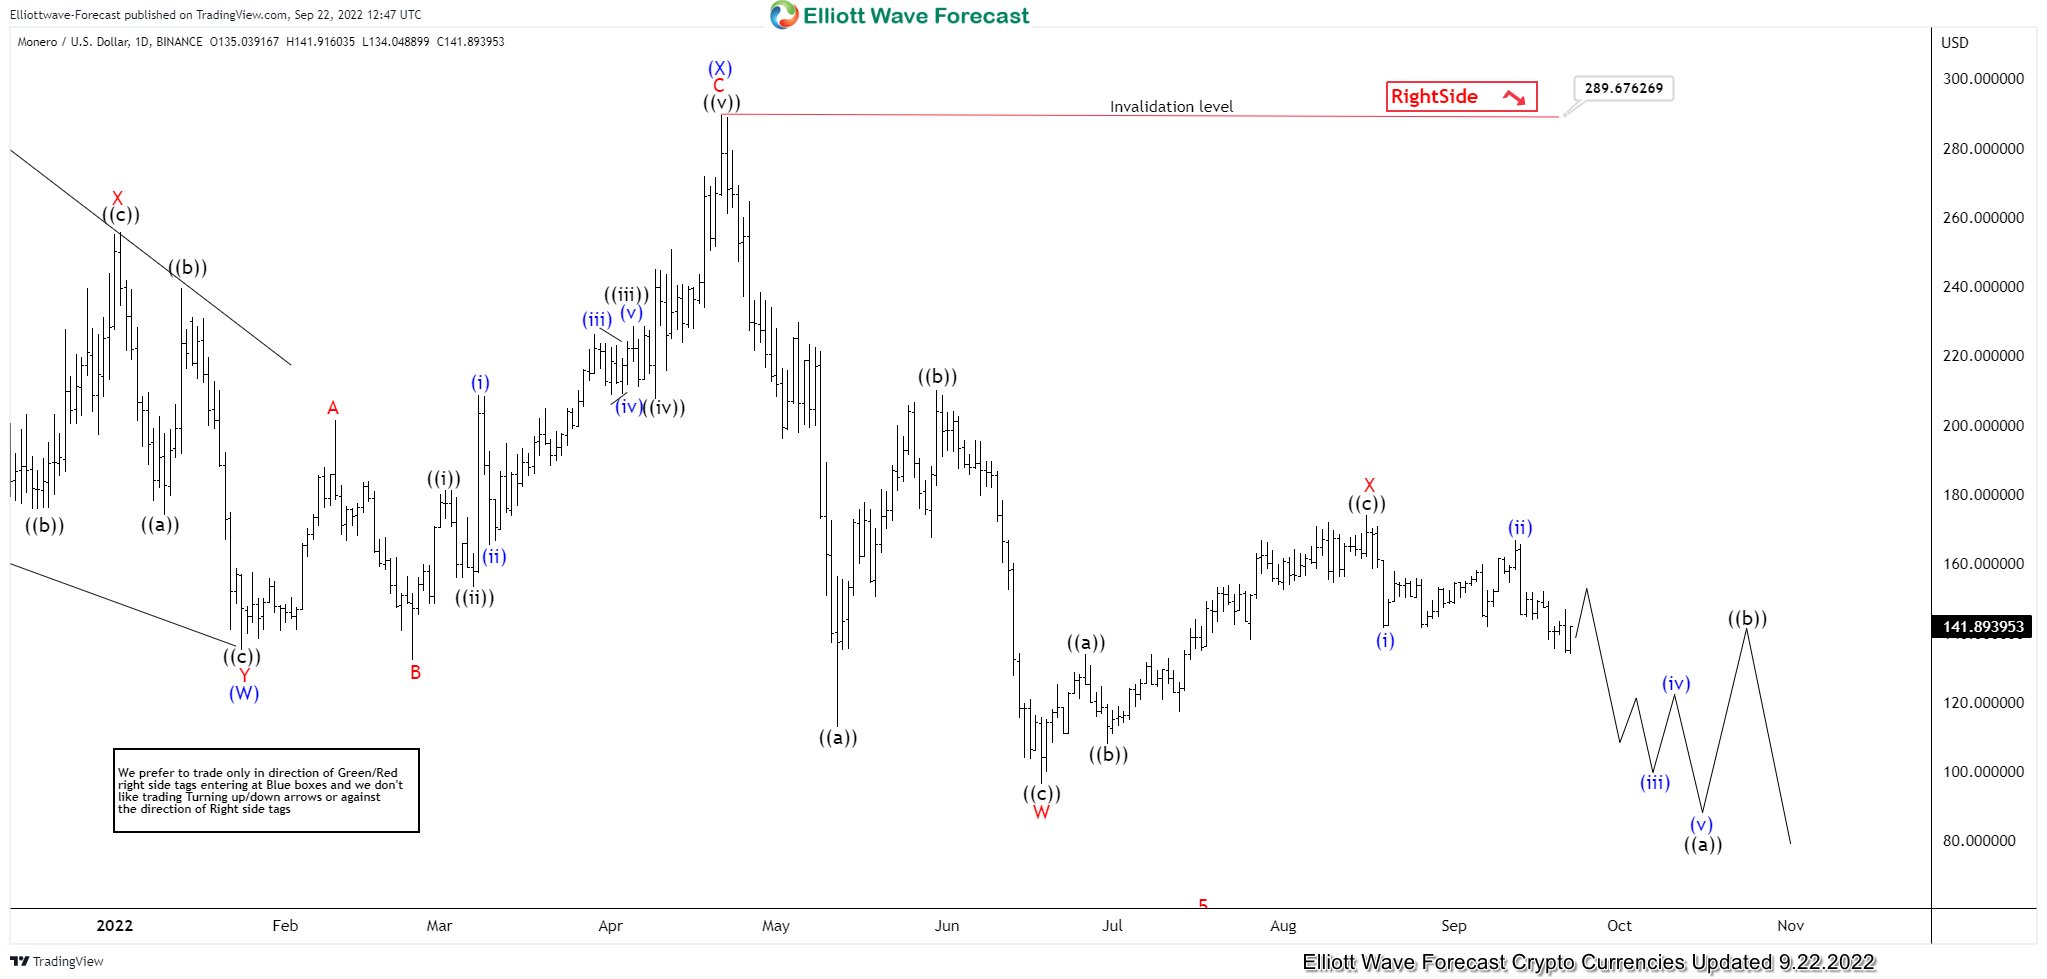
 

Elliottwave-Forecast

Master Trader
Feb 17, 2017
2,462
9
84
www.elliottwave-forecast.com
In our previous article from last year, we wrote that NextGen Energy was in the process of correcting rally from 2020 low. The correction looks completed and the stock is now ready for the next leg higher in coming months. NexGen Energy (NXE) is a Canada-based company with a focus on acquisition, exploration, and development of Canadian uranium projects. The company owns a portfolio of prospective uranium exploration assets in Athabasca Basin, which are some of the largest in the world.

$NXE Weekly Elliott Wave Chart​


NXE weekly chart above shows that the rally to $3.4 on 2.17.2017 ended wave (I). Pullback in wave (II) ended at $0.52 on 3.16.2020 low. Since then, the stock has rallied higher within wave (III). Up from wave (II), wave I ended at $6.50 and wave II corrected cycle from 2020 low and ended at $3.39. The stock has turned higher again in wave III of (III).

$NXE Daily Elliott Wave Chart​


Daily Elliott Wave Chart of NextGen Energy (NXE) above shows that wave II pullback ended at $3.39. Up from here, the rally looks to be in 5 waves diagonal ended wave (1) at $4.85. Wave (2) is in progress to correct cycle from 7.14.2022 low and as far as dips stay above $3.39, expect pullback to find support in 3, 7, or 11 swing for further upside.

Source: https://elliottwave-forecast.com/stock-market/nextgen-energy-nxe-finished-correcting-cycle-2020-low/
 

Elliottwave-Forecast

Master Trader
Feb 17, 2017
2,462
9
84
www.elliottwave-forecast.com
Good day Traders and Investors. In today's article, we will look at the past performance of 1 Hour Elliottwave chart of Boeing ($BA). The decline from 08.16.2022 high is unfolding as a Double three (WXY) and made a lower low on 09.14.2022 which created a bearish sequence in the 1H timeframe. Therefore, we knew that the structure in $BA is incomplete to the downside & should see more weakness. So, we advised members to sell the bounces in 3, 7, or 11 swings at the blue box area. We will explain the structure & forecast below:

$BA Elliottwave Chart (1H):​

Boeing

Here is the 1H Elliottwave count from 09.15.2022. The decline from 09.12.2022 unfolded in a 5 wave impulse breaking below blue (W) creating a bearish sequence. We were calling for the bounce to fail in 3 swings at red B where we like to sell it at the equal legs at $153.32 with a stop at $156.66.

$BA Latest Elliottwave Chart (1H):​

Boeing

Here is the 09.16.2022 1H update showing the move taking place as expected. The stock has reacted lower from the blue box allowing any shorts to get risk free shortly after taking the position. Currently, the stock has already made a new low confirming that the next extension lower is taking place targeting $137.56 - 123.02 before a bounce can take place in 3 swings at least.

Source: https://elliottwave-forecast.com/stock-market/boeing-ba-perfect-reaction-lower-from-blue-box-area/
 

Elliottwave-Forecast

Master Trader
Feb 17, 2017
2,462
9
84
www.elliottwave-forecast.com
The Euro continues to slide against many other major currencies after Russia stopped the gas supplies. The deepening energy crisis causes fear of a recession in the Euro area. Europe has tried to diversify its energy sources and build up reserves, but it's not possible to totally avert the hit to the economy. In the charts below, we will look at the Elliott Wave chart of the pair.

EURAUD Weekly Elliott Wave Chart​

Weekly Elliott Wave view of EURAUD above suggests that the pair shows a lower low sequence from 3.16.2020 high favoring further downside. While pair stays below wave II/B high at 1.6436, rally should fail in 3, 7, or 11 swing for further downside to reach the blue box area of 1.084 - 1.019.

EURAUD 4 Hour Elliott Wave Chart​


4 Hour Elliott Wave View of EURAUD above shows that the rally from 8.26.2022 low takes the form of a double three structure. A double three is a 3-3-3 structure with label of ((w))-((x))-((y)). The target higher in this case is ((y)) = 100% - 161.8% Fibonacci extension of ((w)) at 1.526 - 1.564 area. From this area, pair could end the 7 swing rally and extends lower or at least pullback in 3 waves.

Source: https://elliottwave-forecast.com/forex/euraud-shows-bearish-sequence-favoring-downside/
 

Elliottwave-Forecast

Master Trader
Feb 17, 2017
2,462
9
84
www.elliottwave-forecast.com
JPMorgan Chase & Co. (JPM) is an American multinational investment bank and financial services holding company headquartered in New York City and incorporated in Delaware. As of December 31, 2021, JPMorgan Chase is the largest bank in the United States, the world's largest bank by market capitalization, and the fifth-largest bank in the world in terms of total assets, with total assets totaling to US$3.831 trillion.

JPM Daily Chart April 2022

JPM Daily Chart April 2022

This is the last update we did in JPMorgan (JPM) expecting a loss of more than 10%. The stock completed a market cycle at 172.96 on October 2021 from March 2020 low. From the peak, we called a double correction structure to fall 112.05 – 104.51 area before JPM rally. The market fell to the blue box at 106.06 and bounced (If you want to learn more about double correction or Elliott Wave Theory, follow these links: Elliott Wave Education and Elliott Wave Theory).

JPM Daily Chart September 2022

JPM Daily Chart September 2022

The rebound from the blue box looks corrective at the moment. This means that according to the Elliott Wave Principle, JPM should break the low of 106.06. For that, we must determine what structure is being built. In the chart above, we have a double correction from the 172.96 peak ending at 106.06 as wave (W). Therefore, we need a wave (X) before continuing lower and given the current structure we are building a flat 3-3-5 correction.

The first 3 waves ended wave A at 124.24 and we expect 3 corrective waves to fall towards the 109.08 – 106.13 area and bounce. This new rally should develop an impulse to end the flat correction before continuing lower.

JPM Daily Chart September 2022 Alternative

JPM Daily Chart September 2022 Alternative

The other option is that JPM builds a triple correction from 172.96 peak. The triple correction has a (W), (X), (Y), (XX), (Z) structure. Wave (XX) ended at 133.24 and from here we need 3 swings down to complete wave (Z) before continuing the move higher. Wave A of (Z) ended at 106.06 low. The 3 swings bounce ended at 124.24 as wave B. Now, we should see a move down towards 96.92 – 80.04 to complete wave C of (Z) and wave ((2)) before market continue with a rally.

Source: https://elliottwave-forecast.com/stock-market/jpm-ready-rally-next-quarter/
 

Elliottwave-Forecast

Master Trader
Feb 17, 2017
2,462
9
84
www.elliottwave-forecast.com
East West Bancorp Inc, (EWBC) operates as the bank holding company for East West Bank that provides a range of personal & commercial banking services to individuals & businesses. It operates through three segments, Consumer & Business banking, Commercial banking & others. It is based in Pasadena, CA, comes under Financial services sector & trades as “EWBC” ticker at Nasdaq.

EWBC made an intermediate low at $22.55 during March-2020 global sell off. While above there, it ended impulse sequence at $93.51 high as wave I. Currently, it favors correcting in wave II in proposed double correction & confirms ((Y)) leg, when it breaks below ((W)) low.

EWBC - Elliott Wave Latest Daily View :​

Above $22.55 low, it placed ((1)) at $43.10 high on 6/08/2020. It favored ended ((2)) at $30.49 low as 0.618 retracement of ((1)). Above ((2)) low, it started third wave extension & placed ((3)) at $82.53 high on 3/18/2021. It placed ((4)) at $65.87 low, which is slightly below 0.236 retracement against ((3)). Finally, it favored ended ((5)) as ending diagonal at $93.51 high on 2/16/2022 as I red. While below there, it favors double correction lower in wave II.

EWBC - Elliott Wave View from 4/13/2022 Updates:​

Below, wave I high of $93.51, it placed ((W)) at $61.65 low as expected as shown in previous blog. While above there, it proposed ended ((X)) at $78.04 high & favors lower in ((Y)) leg. ((Y)) will be confirm, when it breaks below ((W)) low or else, ((X)) can unfold in larger double correction as alternate view. In case of ((Y)) confirms from current level, it expect to extend lower towards $46.13 - $26.34 area to finish the double correction in wave II before turning higher in III or at least can see 3 swing reaction higher. We like to buy the dips towards blue box area, when reached.

Source: https://elliottwave-forecast.com/stock-market/ewbc-expect-larger-correction-continue-rally-resumes/
 

Elliottwave-Forecast

Master Trader
Feb 17, 2017
2,462
9
84
www.elliottwave-forecast.com
Hello Fellow Traders. In this technical article we’re going to take a look at the Elliott Wave charts charts of GBPUSD forex pair published in members area of the website. As our members know GBPUSD is showing incomplete bearish sequences and we were calling for an extension in weakness. Recently the pair corrected the short term cycle from the 1.2294 peak. Recovery unfolded as Elliott Wave Irregular Flat structure. Once the pair completed flat pattern, GBPUSD made decline toward new lows as expected. In further text we’re going to explain the forecast and Elliott Wave Pattern.

Before we take a look at the real market example of Expanded Flat, let’s explain the pattern in a few words.

Elliott Wave Expanded Flat Theory​

Elliott Wave Flat is a 3 wave corrective pattern which could often be seen in the market nowadays. Inner subdivision is labeled as A,B,C , with inner 3,3,5 structure. Waves A and B have forms of corrective structures like zigzag, flat, double three or triple three. Third wave C is always 5 waves structure, either motive impulse or ending diagonal pattern. It’s important to notice that in Irregular Flat Pattern wave B completes below the starting point of wave A. Wave C ends above the ending point of wave A . Wave C of Flat completes usually between 1.00 to 1.236 Fibonacci extension of A related to B, but sometimes it could go up to 1.618 fibs ext.

At the graphic below, we can see what Expanded Flat structure looks like

GBPUSD

Now, let’s take a look what Elliott Wave Flat Pattern looks like in the real market

GBPUSD 1h Hour Elliott Wave Analysis 09.12.2022.​

GBPUSD is giving us recovery against the 1.1902 peak that is unfolding as Expanded Flat Pattern. We can see waves ((a))and ((b)) black are showing corrective sequences. Wave ((b)) has broken the starting point of ((a)) while ((c)) has broken ending point of ((a)) which suggests this correction is unfolding as expanded flat. Wave ((c)) leg already shows 5 waves up. However if we downgrade the chart we can see that subdivison of (v) blue is still incomplete . We look for a shallow pull back and another marginal push up to complete the pattern. Approximate area to complete 2 red recovery comes at 1.1686-1.1770.

You can learn more about Elliott Wave FLAT and other Patterns at our Free Elliott Wave Educational Web Page

GBPUSD

GBPUSD 1h Hour Elliott Wave Analysis 09.14.2022.​

We got shallow pull back iv red of (v) blue and another high v red as expected. Wave 2 recovery completed as a expanded flat at 1.1738 high. GBPUSD made sharp decline from that high ,that looks impulsive. We expect ((i)) black to complete soon after which we should ideally see a 3 waves bounce in ((ii)) black. As far as 1.1738 pivot holds, more weakness should be ideally seen in the pair.


GBPUSD 1h Hour Elliott Wave Analysis 09.17.2022.​

The pair has given us 3 waves bounce ((ii)) black that ended at 1.1591 high. After short term bounce , the pair found sellers again and made drop toward new lows as expected. Now GBPUSD remains bearish against the 1.159 high in first degree.

Keep in mind that market is dynamic and presented view could have changed in the mean time. You can check most recent charts in the membership area of the site. Best instruments to trade are those having incomplete bullish or bearish swings sequences. We put them in Sequence Report and best among them are shown in the Live Trading Room.


Source: https://elliottwave-forecast.com/elliottwave/gbpusd-elliott-wave-irregular-flat/
 

Elliottwave-Forecast

Master Trader
Feb 17, 2017
2,462
9
84
www.elliottwave-forecast.com
Scotts Miracle-Gro company is a multinational corporation specializing on lawn and garden care products. Founded 1868, headquartered in Marysville, Ohio, U.S. and traded under the ticker $SMG at NYSE, it is a component of the S&P400 index. The company manufactures and sells consumer lawn, garden and pest control products, and soilless indoor gardening equipment. In the U.S., the company manufactures Scotts, Miracle-Gro and Ortho brands.

Scotts Miracle-Gro Monthly Elliott Wave Analysis 09.18.2022​

The monthly chart below shows the Scotts Miracle-Gro shares $SMG traded at New York Stock Exchange. From the all-time lows, the stock price has developed a cycle higher in black wave ((I)) of grand super cycle degree. Hereby, $SMG has printed the all-time highs in April 2021 at 254.34. Within the impulsive advance in wave ((I)), all the blue internal waves (I), (III) and (V) are impulsive waves, too. Even though the extension in wave (III) has taken place, the longest wave, in fact, is the blue wave (V).

From the 2021 highs, a correction lower in wave ((II)) is unfolding as an Elliott wave zigzag pattern being a 5-3-5 structure. Firsty, blue wave (a) has ended in September 2021 at 139.20 lows. Then, a connector in blue wave (b) has found its peak in November 2021 at 180.43. Later, it has broken the 139.20 lows opening up a bearish sequence. Now, blue wave (c) should visit into 65.59-0.00 area. The minimum target has been reached already. Once ended, one should expect a new cycle in black wave ((III)) towards the new all-time highs.

Investors and traders can be looking to buy Scotts Miracle-Gro from below $65.59 targeting towards 254.34 and beyond.

Scotts Miracle-Gro Elliott Wave Monthly

Source: https://elliottwave-forecast.com/stock-market/scotts-miracle-gro-buying-area/
 

Elliottwave-Forecast

Master Trader
Feb 17, 2017
2,462
9
84
www.elliottwave-forecast.com
The Dollar Index ($USDX) shows five waves since the low on 03.01.2008, which will provide many signals across the Marketplace. Below is a monthly chart of the Dollar Index

$USDX Monthly Elliott Wave​

$USDX Elliott Wave Chart

The monthly chart above shows the five waves advance from 3.1.2008 and the different degrees within the cycle. The idea is overall bullish for the USDX. However, there are two possibilities for the Dollar Index. It can make a significant correction soon and drop hard to correct the whole cycle. Alternatively, it will just correct the cycle since the lows at 02.01.2018 and continue higher.

We have found out at EWF that the most significant advantage of the Theory is the understanding of the sequence. Every time wave five appears, there is a clear right side and, consequently, opportunities. As we can see in the chart, since the lows at 03.01.2008, there are five swings in Blue. This gives a temporary warning for the $USDX buyers. It has also reached 61.8%-76.4% fiboancci extension between (I) and (II), which is usually an area where wave five can end. As we said, there are two outcomes. The first one is the classic pattern in the Elliott Wave Theory, which is presented in the following chart:

Elliott Wave Impulse and Zigzag Cycle​


The above chart shows after five waves, a big sell-off of the Dollar can happen soon. If we downgrade the cycle since 02.01.2018 it looks to be missing wave IV and V. But this does take away the warning across the Market that Dollar can soon pullback.

The Second scenario is from the same lows at 03.01.2008, the Index is showing the same five waves. But in this case, we call them five swings, which is a huge difference. The following chart shows the structure:


The above chart shows a WXY structure. It combines two cycles of three waves or two ABCs in the Elliott Wave Theory. In this second scenario, the Index should end swing five off the lows at 02.01.2018, but the pullback should be less than scenario one.

Professional traders understand the whole market and always look for the instrument showing clear structures. They then look for opportunities to buy/sell what we call Elliott Wave hedging, which is when both sides of the Market (i.e. buyers and sellers), agree on a reaction. Looking at the USDX structure and analyzing both scenarios, 2023 can see a pullback in the USDX. The Elliott Wave structure is however clear that the higher degree right side is bullish. The Index should be supported for a long time. Commodities lead the USDX pairs, trading in the second dimension when they agree in the swing direction but not the overall direction. It is evident in the following chart:


The $USDX Monthly charts overlay with $XAGUSD (Silver); as we can see, the metal should not be trading below zero and has been holding the lows, while the USDX is close to a peak. Understanding and reading the market makes a huge difference in being on the right side and knowing which instruments to trade.

In Conclusion: 2023 might provide a pullback in the USDX, which means higher $EURUSD, $AUDUSD, $NZDUSD, $GBPUSD, and higher commodities. Commodities should hold stronger against the $USDX, and provide a better buying into 2023.

Source: https://elliottwave-forecast.com/co...re-showing-an-opportunity-to-buy-commodities/
 

Elliottwave-Forecast

Master Trader
Feb 17, 2017
2,462
9
84
www.elliottwave-forecast.com
The near-term view is suggesting that the bigger correction against the all-time low unfolded as a double three structure where wave w ended at $36.28 low, wave x bounce ended at $132.41 high. While wave y ended at $24.59 low and with that the correction against all-time lows ended in wave (II) pullback. Up from there, rally higher took place as 5 waves impulse structure where cycle degree wave I ended at $533.87 high. Down from there, the Monero is doing a pullback in wave II to correct the cycle from March 2020 lows. The internals of that pullback unfolded as Elliott wave double three structure where wave ((W)) ended at $136.35 low & wave ((X)) ended at $343.87 high. Now as far as it fails below $289.67 more downside within wave ((Y)) is expected to reach $77.80- $27.84 area to the downside before the upside resumes.

Monero XMRUSD Daily Elliott Wave Chart 9.22.2022


Source: https://elliottwave-forecast.com/xmrusd/
 

Elliottwave-Forecast

Master Trader
Feb 17, 2017
2,462
9
84
www.elliottwave-forecast.com
Dash is open-source peer-to-peer cryptocurrency distributed worldwide, furthermore, DASHUSD represents its price in US Dollar.

DASH the rally from all time ended in the Grand Supercycle degree wave ((I)) at $1625 high. Down from there, the Dash is doing a pullback in wave ((II)) against all-time lows as Elliott wave zigzag structure where wave (a) ended at $33.97 low. Wave (b) bounce ended at $476.50 high and wave (c) is expected to reach $33.88- $26.28 area lower before finding buyers again. Near-term, as far as bounces fail below $138.45 high then more downside is expected to take place.

DASHUSD Daily Elliott Wave Chart 9.22.2022


Source: https://elliottwave-forecast.com/dashusd/
 

Elliottwave-Forecast

Master Trader
Feb 17, 2017
2,462
9
84
www.elliottwave-forecast.com
Ripple is a distributed financial technology allowing banks to efficiently settle transactions in real-time. XRPUSD is the native currency of the Ripple network traded against the US Dollar.

The near-term view is suggesting that the bigger correction against all-time low unfolded as triple three structure where wave w ended at $0.2465 low, wave x bounce ended at $0.7913 high, wave y ended at $0.1763 low, second wave x ended at $0.3463 high and wave z completed at $0.1104 low. And with this, Ripple completed the biggest pullback in wave ( II). Up from there, the rally higher took place as 5 waves impulse structure where cycle degree wave I ended at $1.9669 high and doing a pullback to correct the cycle from March 2020 lows within wave II. The internals of that pullback is unfolding as Elliott wave zigzag structure where wave ((A)) ended at $0.5096 low. Wave ((B)) ended at $1.4162 high and wave ((C)) has managed to reach $0.3108- $0.1654 area lower where buyers are expected to appear. However, as far as bounces fail below $1.4162 high some more downside is expected to take place.

XRPUSD Daily Elliott Wave Chart 9.22.2022


Source: https://elliottwave-forecast.com/xrpusd/
 

Elliottwave-Forecast

Master Trader
Feb 17, 2017
2,462
9
84
www.elliottwave-forecast.com
The near-term view is suggesting that the bigger correction against the all-time low unfolded as a double three structure where wave w ended at $0.0103 low, wave x bounce ended at $0.0453 high. While wave y ended at $0.0065 low and with that the correction against all-time lows ended in wave (II) pullback. Up from there, rally higher took place as 5 waves impulse structure where cycle degree wave I ended at $0.1844 high and now doing a pullback to correct the cycle from March 2020 lows within wave II. The internals of that pullback as Elliott wave double three structure where wave ((W)) ended at $0.04456 low. Wave ((X)) ended at $0.1313 high and wave ((Y)) is expected to reach $0.03166- $0.01276 area lower approximately before upside resumes. Near-term, as far as bounces fail below $0.1313 high more downside is expected to take place.

Tron TRXUSD Daily Elliott Wave Chart 9.22.2022


Source: https://elliottwave-forecast.com/trxusd/
 

Elliottwave-Forecast

Master Trader
Feb 17, 2017
2,462
9
84
www.elliottwave-forecast.com
Nokia is a Finnish multinational telecommunications, consumer electronics and information technology company. Founded 1865, it is headquartered in Espoo, Finland. Investors can trade it under the ticker $NOKIA at Nasdaq Nordic OMX and at Euronext Paris. The company is a part of Euro Stoxx 50 (SX5E) index. Also, one can trade Nokia under the ticker $NOK in US in form of ADRs. Today, Nokia is employing more than 100’000 people, it is doing business in more than 130 countries and it is the world’s third-largest network equipment manufacturer.

In the initial article from October 2020, we have forecasted a rally for the coming years. Indeed, from October 2020 to January 2022 the price has advanced by 60% from 3.60 to 5.77. Then, a pullback provided an opportunity. In March 2022, we have explained that from 4.34-3.72 blue box area an acceleration higher should take place. As a matter of fact, we saw a reaction higher in 3 waves. Now, we provide un update calling for a double correction lower. Only then, a new rally should start.

Nokia Monthly Elliott Wave Analysis 09.25.2022​

The monthly chart below shows the Nokia shares $NOKIA traded at Nasdaq Nordic OMX Exchange. From the July 2012 lows at 1.30, the stock price has developed a cycle higher in wave I towards 7.86 highs on April 2015. After the primary impulse higher, a double three correction lower in wave II has ended on March 2020 at 2.08.

From the March lows, a new cycle in wave III of (I) may have started to the new highs. Break of 7.86 highs would confirm that. As of right now, $NOKIA might be finishing the initial nest consisting of black waves ((1)-((2))) within the red III. Soon, acceleration higher within wave ((3)) of III should take place. The target for wave III is 8.66-12.72 area and even higher.

Nokia Elliott Wave Monthly

Nokia Daily Elliott Wave Analysis 09.25.2022​

The daily chart below shows the $NOKIA shares price action in more detail. From the March 2020 lows at 2.08, the stock price has advanced in a black wave ((1)) towards January 2022 highs at 5.77. The pattern is a leading diagonal. From the January 2022 top, a decline in larger 7 swings is currently in progress. We saw 7 smaller swings of wave (W) reaching into 4.34-3.72 blue box area. There, a reaction higher in 3 swings of wave (X) has taken place. From the September 2022 high, a new cycle lower in blue wave (Y) might have started. Even though, the March 2022 low has not been broken yet, the RSI reading is already below that of the March. Now, while below 5.20 next blue box area can be reached.

Investors and traders can be looking to buy $NOKIA from 3.54-2.52 blue box area. There, an acceleration higher within black wave ((3)) of red wave III or a reaction in 3 waves as minimum should take place.

Nokia Elliott Wave Daily

Source: https://elliottwave-forecast.com/stock-market/nokia-double-correction/
 

Elliottwave-Forecast

Master Trader
Feb 17, 2017
2,462
9
84
www.elliottwave-forecast.com
Hello Everyone! In this technical blog, we are going to take a look at the Elliott Wave path in The Real Estate ETF (IYR).

The iShares U.S. Real Estate ETF seeks to track the investment results of the $DJUSRE index. The index is composed of U.S. equities in the real estate sector. It provides exposure to U.S. real estate companies and REITs, which invest in real estate directly and trade like stocks.

In the initial article from July 2022, we forecasted a bounce to take place from the blue box area. The bounce took place allowing longs to get risk free but then failed and continued lower. Lets take a look at the updated Elliott wave path that can be unfolding.

IYR (Real Estate) Weekly Elliott Wave Analysis Sep 25th 2022:​

IYR Real Estate

The ETF is favoured to be correcting the cycle against March 2020 low in Double three structure (WXY). After breaking below June 2022 lows, the ETF has confirmed that the next leg lower is taking place and any bounces should find sellers until we reach the next Blue Box area. The reaction lower from 08/16/2022 peak ($103.36) is incomplete and can be unfolding in 5 waves before a bounce can take place in blue (B). We expect the bounce in (B) to fail in 3 or 7 swings and continue lower to reach $73.15 - 56.27 where buyers can appear for a reaction higher in 3 waves at least or start the next leg higher. We like to buy dips in 3, 7 or 11 swings into blue boxes for a continuation to the upside as long as the March 2020 lows at $56.27 remains intact.

Source: https://elliottwave-forecast.com/stock-market/iyr-real-estate-looking-downside-whats-next/
 

Elliottwave-Forecast

Master Trader
Feb 17, 2017
2,462
9
84
www.elliottwave-forecast.com
Visa Inc. (V) is an American multinational financial services corporation headquartered in San Francisco, California. It facilitates electronic funds transfers throughout the world, most commonly through Visa-branded credit cards, debit cards and prepaid cards. Visa is one of the world's most valuable companies.

VISA (V) Daily Chart From September 2022​

VISA (V) Daily Chart From September 2022

Visa (V) ended an important market cycle in July 2021 that started in aVrch 2020. The rally reached 252.67 which we labeled as wave I, and from there a corrective movement started. This structure has already had more than a year of sideways and this last September 23th we have broken an important support at 186.63. This break indicates that we should see more bearish movement until we find a new support.

Using the Elliott Wave Principle, we see that a complex 7-3-7 structure has been formed in V in daily timeframe. This means that the first cycle developed a double correction and we label it as wave ((W)). Then we have the connector ((X)) which corrected the drop from the peak. Lastly, we are building a new double correction to complete wave ((Y)). (If you want to learn more about double correction or Elliott Wave Theory, follow these links: Elliott Wave Education and Elliott Wave Theory).

Visa (V) Double Correction Structure​

From 252.57 we had 3 swing drop ending wave (W) at 190.12. Wave (X) bounced off another 3 swings to finish at 235.97. And then we saw another 3 swings to complete (Y) at 186.63 and wave ((W)). From there, we go up to 229.24 to finish the connector ((X)). The next correction came in 7 swings to complete wave (W) at 185.96. The 3 swing corrective rally completed wave (X) at 218.01 and we are currently developing wave (Y).

Wave (Y) could be building a double correction, just like wave (W). Wave W ended at 196.29 and wave X at 207.28. We expect 3 more swings down to complete wave Y in 163.12 – 174.67 area. Thus, V will complete wave (Y) of ((Y)) of wave II and then continue with the uptrend.

Source: https://elliottwave-forecast.com/stock-market/visa-v-incomplete-double-correction/
 

Elliottwave-Forecast

Master Trader
Feb 17, 2017
2,462
9
84
www.elliottwave-forecast.com
Hello Fellow Traders. In this technical article we’re going to take a look at the Elliott Wave charts charts of Microsoft $MSFT stock published in members area of the website. As our members know $MSFT has recently given us Irregular flat pattern against the 294.26 peak. Once the stock completed flat correction, it made decline toward new lows as expected. Now $MSFT is showing lower low sequences in the cycle from the 294.26 high , which are calling for a further weakness.

Before we take a look at the real market example of Expanded Flat, let’s explain the pattern in a few words.

Elliott Wave Expanded Flat Theory​

Elliott Wave Flat is a 3 wave corrective pattern which could often be seen in the market nowadays. Inner subdivision is labeled as A,B,C , with inner 3,3,5 structure. Waves A and B have forms of corrective structures like zigzag, flat, double three or triple three. Third wave C is always 5 waves structure, either motive impulse or ending diagonal pattern. It’s important to notice that in Irregular Flat Pattern wave B completes below the starting point of wave A. Wave C ends above the ending point of wave A . Wave C of Flat completes usually between 1.00 to 1.236 Fibonacci extension of A related to B, but sometimes it could go up to 1.618 fibs ext.

At the graphic below, we can see what Expanded Flat structure looks like

MSFT

Now, let’s take a look what Elliott Wave Flat Pattern looks like in the real market

Microsoft $MSFT 4h Hour Elliott Wave Analysis 09.11.2022.​

The stock has made 5 waves down from the 294.26 peak and now correcting that cycle. Current view suggests that $MSFT is giving us recovery against the 294.26 peak that is unfolding as Irregular Flat Pattern. When we downgrade charts to lower time frames , we can see waves inner subdivisions of A and B red are having corrective sequences. Wave B has broken the starting point of A while C has broken ending point of A which is characteristic of Irregular flat. Wave C red leg should complete as 5 waves soon. We expect (B) blue recovery to complete around 264.2-267.8 area as Flat structure.

You can learn more about Elliott Wave FLAT and other Patterns at our Free Elliott Wave Educational Web Page

Microsoft

Microsoft $MSFT 4h Hour Elliott Wave Analysis 09.18.2022​

Microsoft stock ended (B) blue recovery at 267.39 high and made turn lower as we expected. Eventually the price has broken previous low (A) blue which was important confirmation that bears are taking control. Further weakness is expected in the stock as far as pivot at (B) blue peak( 267.39) holds. Short term cycle from that high completed as 5 waves- leading diagonal. It is labeled as 1 red which is first leg of wave (C) blue. We expect bounce in 3 waves in 2 red, before further drop takes place.

Keep in mind that market is dynamic and presented view could have changed in the mean time. You can check most recent charts in the membership area of the site. Best instruments to trade are those having incomplete bullish or bearish swings sequences. We put them in Sequence Report and best among them are shown in the Live Trading Room.

Microsoft

Source: https://elliottwave-forecast.com/elliottwave/microsoft-msft-elliott-wave-decline-flat/
 

Elliottwave-Forecast

Master Trader
Feb 17, 2017
2,462
9
84
www.elliottwave-forecast.com
Enphase Energy (NASDAQ: ENPH) is a technology company with headquarter in Fremont, California. Enphase designs and manufactures software-driven home energy solutions for the solar industry. It designs, develops, manufactures, and sells home energy solution that connect solar generation, energy storage, and management on one intelligent platform. The stock has resumed to all-time high and continues to show bullish sequence. However near term, expect bigger and deeper pullback before it resumes higher. Below we look at the Elliott Wave outlook for the stock.

ENPH Weekly Elliott Wave Chart​


Weekly chart of Enphase Energy (ENPH) above shows that the stock continues to extend higher and shows incomplete sequence from January 2022 low favoring further upside. Rally from all-time low ended wave ((I)) at 229.04 and pullback in wave ((II)) ended at 113.42. Internal subdivision of wave ((II)) unfolded as a running flat. Wave (a) ended at 108.88, wave (b) ended at 282.46, and wave (c) ended at 113.42 which completed wave ((II)). The stock has resumed higher in wave ((III)) with internal subdivision as an impulse. Up from wave ((II)), wave (I) ended at 220.99 and pullback in wave (II) ended at 128.67. Stock resumes higher in wave (III) towards 324.84. Wave (IV) is now in progress to correct cycle from May 2022 low before it resumes higher.

ENPH Daily Elliott Wave Chart​


Daily Elliott Wave of Enphase Energy (ENPH) shows that wave (IV) is currently in progress in larger degree zigzag. Expect further downside before the first leg of the zigzag wave a ends. Then it should bounce in wave b before another leg lower in wave c to complete wave (IV). Ideally wave (IV) ends somewhere between 23.6 - 38.2% retracement of wave (III) at 249 - 278 and not go below 50% retracement of wave (III) at 226. As long as pivot at 113.4 low stays intact, expect the stock to resume higher and pullback to find support in 3, 7, or 11 swing for further upside.

Source: https://elliottwave-forecast.com/stock-market/enphase-energy-enph-in-wave-iv-pullback/
 

Elliottwave-Forecast

Master Trader
Feb 17, 2017
2,462
9
84
www.elliottwave-forecast.com
Mattel, Inc. (MAT), a children’s entertainment company, designs & produces toys & consumer products worldwide The company operates through North America, International & American Girl segments. It is based in El Segundo, CA, comes under Consumer Cyclical sector & trades as “MAT” ticket at Nasdaq.

MAT made a low of $6.53 during March-2020 sell off in the market. Later it showing impulse sequence as I red ended at $26.99 high on 5/04/2022. While below there, it favors correcting lower in II correction before turning higher again.

MAT - Elliott Wave Latest Daily View :​


After March-2020 low, it placed ((1)) at $9.44 high & ((2)) at $7.54 low. ((2)) was a flat correction retraced 0.618 Fibonacci retracement against ((1)). While above there, it unfolded in third wave extension. It ended ((3)) at $23.31 high on 4/23/2021 low. Below there, it favored ended ((4)) at $17.95 low on 10/04/2021. ((4)) was ended slightly above 0.382 Fibonacci retracement of previous sequence. Finally, it ended ((5)) at $26.99 high on 5/04/2022 as wave I red. While below there, it favors correcting lower in II in proposed zigzag correction.

Below wave I high, it placed ((A)) at $21.07 low on 5/24/2022 & ((B)) at $24.20 high as triangle on 9/12/2022. While below there, it favors lower in ((C)) leg to finish II correction. Currently, it favors lower in (1) of ((C)) & expect short term weakness before a bounce in (2) followed by further downside in (3). It expect ((C)) to extend towards $18.23 - $14.54 area to finish II correction before upside resumes. It expect to resume upside either in III or at least a larger 3 swings reaction higher hitting the extreme areas.

Source: https://elliottwave-forecast.com/stock-market/mat-expect-short-term-downside-continue-rally-resumes/
 

Elliottwave-Forecast

Master Trader
Feb 17, 2017
2,462
9
84
www.elliottwave-forecast.com
In this technical blog, we will look at the past performance of 1-hour Elliott Wave Charts of Bitcoin. In which, the decline from 15 August 2022 high is unfolding as a nest and showed a lower low sequence. Therefore, we knew that the structure in Bitcoin is incomplete to the downside & should see more weakness. So, we advised members to sell the bounces in 3, 7, or 11 swings at the blue box areas. We will explain the structure & forecast below:

Bitcoin 1 Hour Elliott Wave Chart​

Bitcoin Reacting Lower From Elliott Wave Blue Box Area

Here’s 1hr Elliott wave Chart from the 9/27/2022 London update. In which, the decline to $18157 low ended 5 waves from 9/13/2022 high in wave ((i)) & made a bounce in wave ((ii)). The internals of that bounce unfolded as an Elliott wave double correction where wave (w) ended at $19541 high. Then a decline to $18533 ended wave (x) pullback and started the (y) leg higher towards $19911- $20761 blue box area from where sellers were expected to appear looking for more downside or for a 3 wave reaction lower at least.

Bitcoin Latest 1 Hour Elliott Wave Chart​

Bitcoin Reacting Lower From Elliott Wave Blue Box Area

This is the Latest 1hr view from the 9/28/2022 London update. In which the Bitcoin is showing a reaction lower taking place from the blue box area allowing shorts to get into a risk-free position shortly after taking the position. However, a break below $18157 low still needs to be seen to confirm the next extension lower towards $15773- $14685 area lower & avoid double correction higher.

Source: https://elliottwave-forecast.com/cryptos/bitcoin-reacting-lower-blue-box-area/