Elliottwave-Forecast

Master Trader
Feb 17, 2017
2,426
9
84
www.elliottwave-forecast.com
Hello fellow traders. As our members know Bitcoin BTCUSD has been giving us a lot of good trading setups recently. In this blog, we’re going to take a look at the latest Elliott Wave setup of Bitcoin. Cryptocurrency $BTCUSD is showing impulsive- bullish sequences. We’ve been calling for a rally and recommending members to keep buying the dips in 3,7,11 swings whenever chances occur .

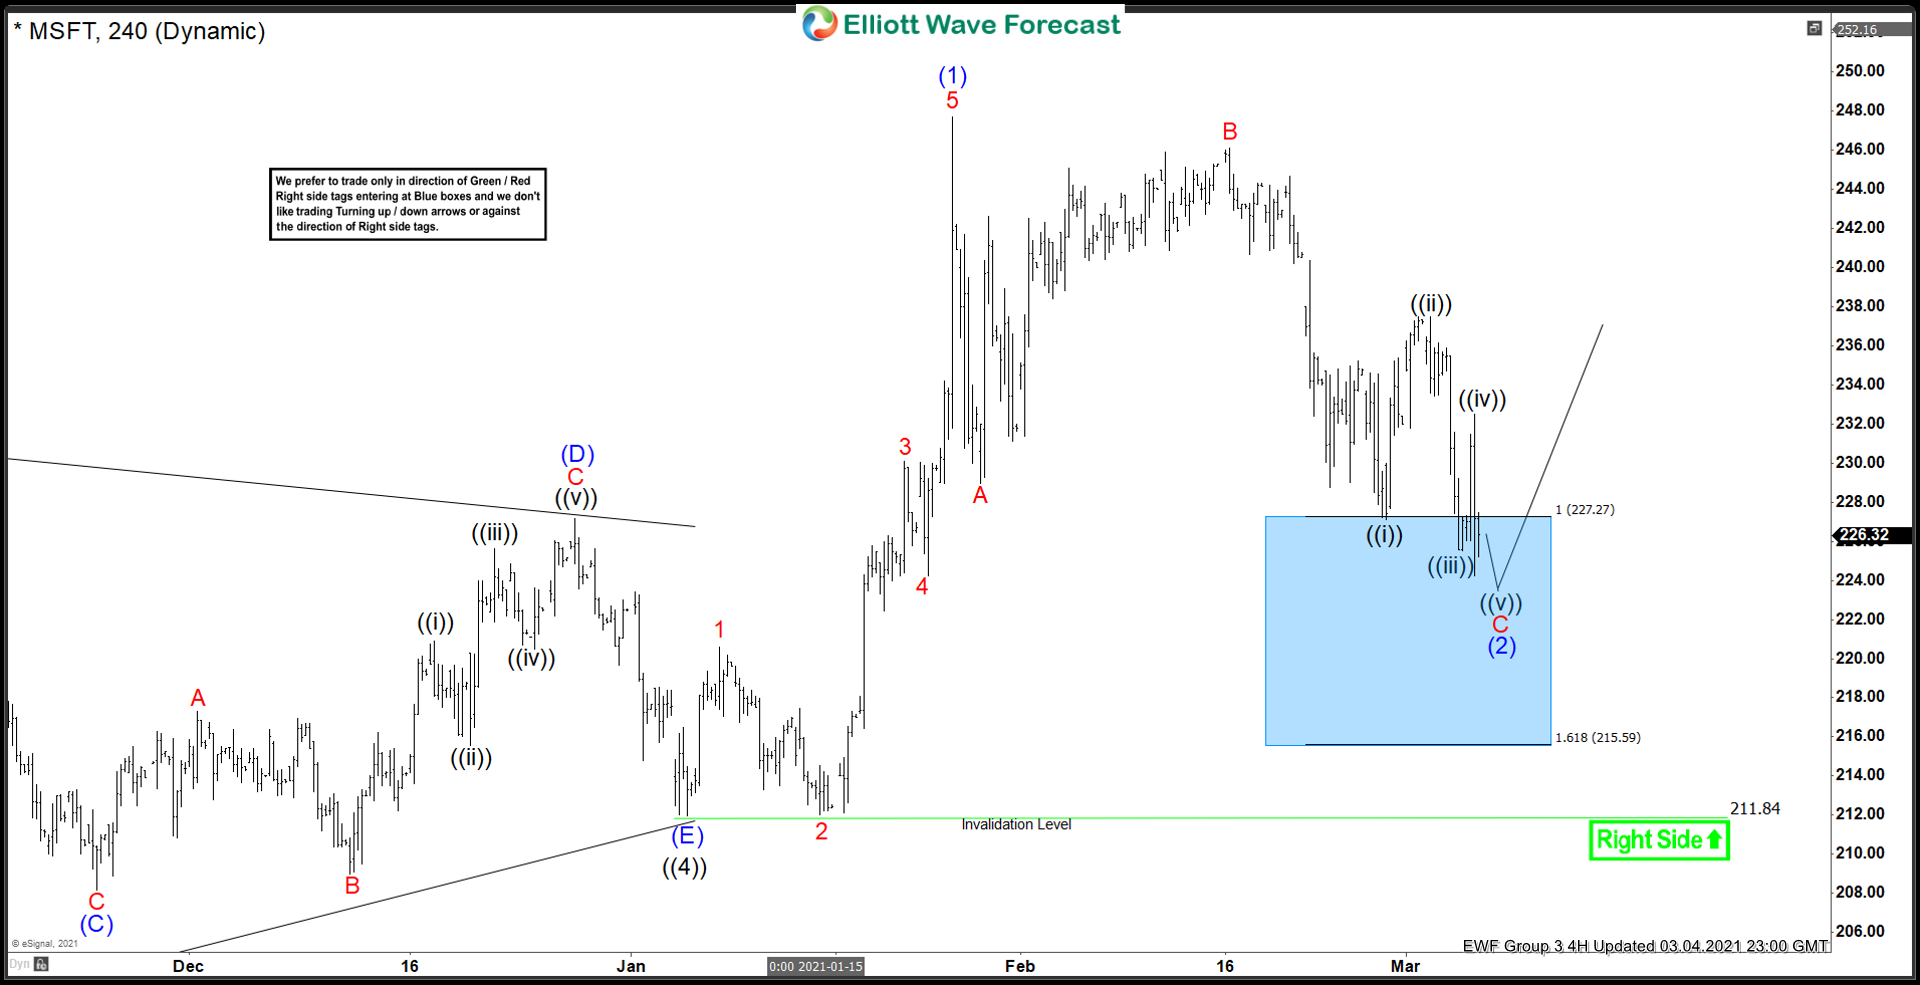
BTCUSD 1 Hour Elliott Wave Analysis 2.10.2021​

BTCUSD is bullish against the 43102.28 low in first degree. Cryptocurrency is giving us pull back wave ((2)) which still looks incomplete at the moment. The price is missing another leg down toward blue box area : 51406.1-46024.8 ( buyers zone). From the Blue Box area area we expect rally to take us toward new all-time highs ideally. We don’t recommend selling it. Strategy is buying the dips at the proposed blue box area. The main trend is bullish so we expect to see 3 waves bounce at least from the blue box. As soon as the price hits 50Fibs against the (B) blue high we will make long position risk free.

As our members know, Blue Boxes are no enemy areas , giving us 85% chance to get a bounce. You can learn more about Elliott Wave Patterns at our Free Elliott Wave Educational Web Page.

BTCUSD

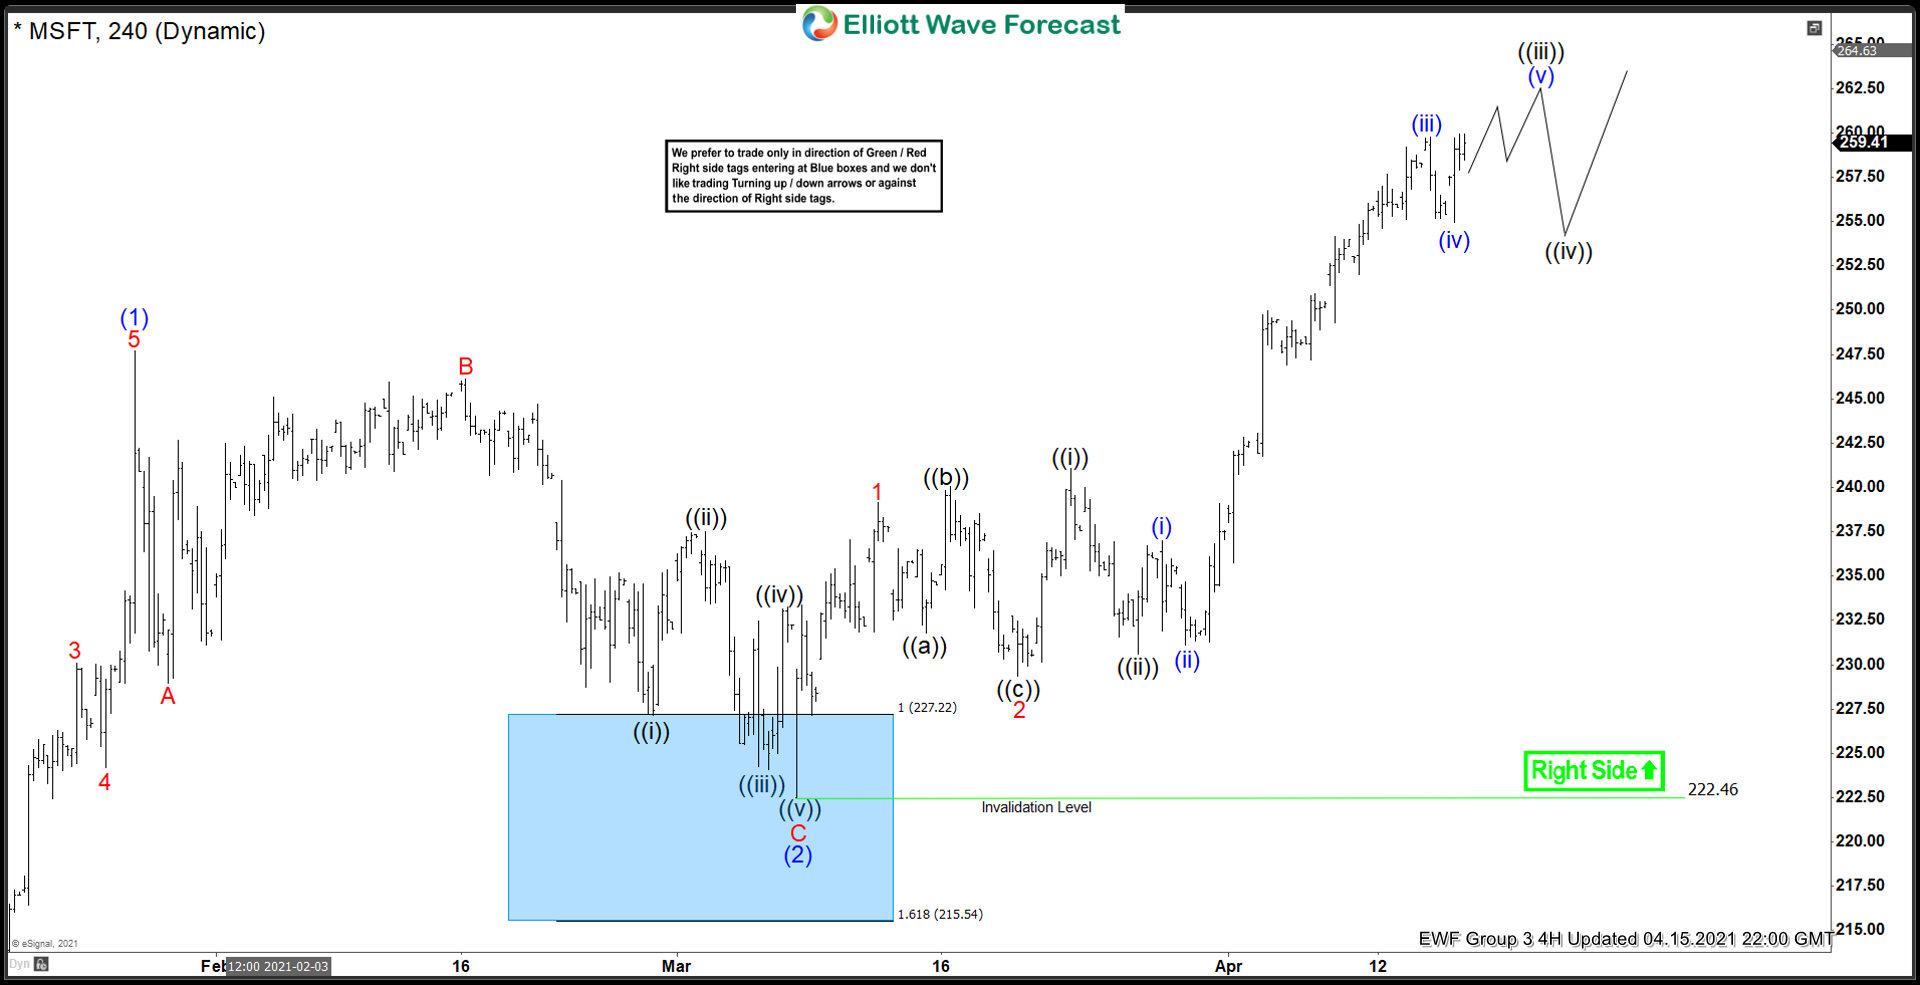
BTCUSD 1 Hour Elliott Wave Analysis 4.11.2021​

Eventually Bitcoin made leg down toward blue box area. The cryptocurrency found buyers as expected and giving us nice reactions from the blue box . ((2)) black pull back completed at 50414.9 low. The price is showing now higher high sequences from the mentioned level. We would like to see further rally and break above ((1)) black peak to confirm next let up is in progress. We don’t recommend selling BTCUSD in any proposed pull back and favor the long side from the blue box. Members who took long trades are now enjoying profits in risk free positions.Our system is not hard to understand. We’re always trading in the direction of the main trend. Idea is to enter at the extreme areas which we mark on the charts as blue boxes.

Keep in mind market is dynamic and presented view could have changed in the mean time. You can check most recent charts in the membership area of the site. Best instruments to trade are those having incomplete bullish or bearish swings sequences.We put them in Sequence Report and best among them are shown in the Live Trading Room

BTCUSD

Elliott Wave Forecast
Source: https://elliottwave-forecast.com/trading/another-buying-setup-bitcoin-btcusd/
 

Elliottwave-Forecast

Master Trader
Feb 17, 2017
2,426
9
84
www.elliottwave-forecast.com
Berkshire Hathaway Inc. Is Developing An Impulse From March 2020 Lows

Since the crash of March 2020, all stocks have tried to recover what they lost and Berkshire Hathaway was no exception. BRK.B did not only recover the lost, but It also reached historic highs. Now, it is building an impulse from March 2020 lows with a target to $318 - $342 area. Target measured from wave ((1)) and wave ((2)) that we believe already are done. I think this target is conservative and as the weeks go by we will update a better target area.

Berkshire Hathaway Daily Chart

Berkshire Hathaway Daily Chart  As we see in the daily chart, the wave ((1)) ended and the structure it is not quite common called an expanding leading diagonal. (If you want to learn more about Elliott Wave Theory, please follow this link: Elliott Wave Theory). I think it is better to manage the structure of Berkshire Hathaway in that way instead of a nest. This is because comparing some cycles has more sense with the current structures of the market.

Then we have a clear zig-zag correction as wave ((2)) and we are developing wave ((3)) in these moments. Shor Term we believe we are completing wave (3) of ((3)) and that it should send the stock much higher. It is difficult to determinate if wave 4 in red is done or not, it could continue ranging for a while until the rally comes we are going to see that in the next days.

Source: https://elliottwave-forecast.com/stock-market/berkshire-hathaway-developing-impulse/
 

Elliottwave-Forecast

Master Trader
Feb 17, 2017
2,426
9
84
www.elliottwave-forecast.com
$FXY Long Term Cycles and Elliott Wave Analysis

Firstly the $FXY instrument inception date was 2/12/2007. The instrument tracks changes of the value of the Japanese Yen versus the US Dollar. There is plenty of data going back into the longer term 1970’s time frame available for the currency cross rate in the USDJPY. The foreign exchange pair shows a larger degree time frame low is in place October 2011 at 75.57. Comparatively, the FXY instrument reflects a price high at 130.22 in October 2011.

The analysis continues below the FXY Monthly chart.


Secondly the FXY instrument mirrors USDJPY price highs and lows inversely as the initial above paragraph suggests. In the FXY instrument the decline from the October 2011 high into the June 2015 lows is an Elliott wave impulse. Internally there are a couple of degrees shown there in the red & blue colors that finished the black wave ((I)). From the June 2015 lows the bounce higher in both price and momentum indicators suggested the cycle lower had ended there.

In conclusion: As the FXY weekly chart suggests the instrument ended a larger degree cycle in an Elliott wave impulse of five waves lower in June 2015. The bounce from there appears to be three swings in the wave (w) in blue that ended August 2016. From there a double three wave (x) in blue ended in January 2017. From there a cycle in the red w ended in March 2020.

Currently it appears there is a pullback to correct the cycle from the January 2017 lows before turning higher again in the blue (y) of ((II)). While this plays out with price remaining above the January 2017 lows the FXY can see a turn higher. This larger degree ((II)) is a typical double three Elliott Wave structure. It can reach the 100.78 – 112.80 extension area before the larger degree time frame bearish cycle takes over again taking prices substantially lower.

Source: https://elliottwave-forecast.com/stock-market/fxy-long-term-cycles-and-elliott-wave-analysis/
 

Elliottwave-Forecast

Master Trader
Feb 17, 2017
2,426
9
84
www.elliottwave-forecast.com
In this blog we take a look at US Real Estate ETF (IYR) reaction higher from the blue box.

The 1 hour chart below is an update from 3/8/2021.We see that IYR peaked at the 90.50 to 91.00 area and completed black wave ((3)) of an anticipated leading diagonal. Down from there, the ETF made 7 swings lower into the blue box. Subsequent to the 7 swingsdecline, IYR completed wave ((4)) at 84.04. In the 7 swings we see blue waves (W), (X), and (Y). Within both blue waves (W) and (Y), we see clear 3 swings subdivisions, which is A-B-C zig zags. Zig zag subdivisions consist of five wabes in A and C, with a correction in B. However, in the chart below, we show only internal subdivisions within red wave C of blue wave (Y) due to chart space constraints. We also see that the ETF had already started to react higher from the blue box. We therefore proposed the 84.04 level as a level of invalidation.

Elliott Wave 1 Hour Chart 3/8/2021IYR

In the 1 hour chart below from 3/12/2021, we see further separation higher from the blue box. We anticipated this upside move from the blue box. We are able to anticipate such moves with our blue box system. All long positions from the blue box area were already running risk free. The right side remained upside. There is no reason therefore to sell IYR against it's dominant upside trend.

Up from the blue box area, the ETF rallied in 5 swings in red wave 1. One may need to downgrade timeframe in order to see the swings in red wave 1 clearly. Naturally, we saw a correction follow in red wave 2 as per Elliot Wave nature of a motive sequence. We confirmed the next leg higher in red wave 3 once red wave 1 peak was broken. Although incomplete, we expected continuation higher in red wave 3, then 4 and 5 of bigger degree blue wave (1).

Elliott Wave 1 Hour Chart 3/12/2021IYR

Source: https://elliottwave-forecast.com/stock-market/iyr-rallies-blue-box/
 

Elliottwave-Forecast

Master Trader
Feb 17, 2017
2,426
9
84
www.elliottwave-forecast.com
MTU Aero Engines AG is a German aircraft engine manufacturer. It develops, manufactures and provides service support for civil and military aircraft engines. Founded in 1934 and headquartered in Munich, Germany, it can be traded under the ticker $MTX at XETRA in Frankfurt. MTU is a part of DAX30 index.

MTU Monthly Elliott Wave Analysis 04.13.2021​

The monthly chart below shows the MTU stock $MTX traded at XETRA in Frankfurt. From the all-time lows, the stock price has developed a cycle higher in blue wave (I) of a super cycle degree. MTU has printed the all-time highs in January 2020 at 289.30. Without any doubt, the advance is a textbook quality impulsive move up in 5 waves. From January 2020 highs, a sharp straightdown correction in the blue wave (II) has retraced 2/3 of the price. An important bottom has been printed in March 2020 at 97.76 low. From there, a new cycle in wave (III) might have started. Investors can be expecting MTU stock to reach into the new all-time highs. The target will be 388-568 area.

MTU Elliott Wave Weekly

MTU Daily Elliott Wave Analysis 04.13.2021​

The daily chart below shows in more detail the advance in red wave I of blue wave (III) from the March 2020 lows at 97.76. Hereby, one can clearly see 3 swings higher. Therefore, one should expect at least another swing higher to form a 5 waves move ending wave I. Once accomplished, a pullback in red wave II should find support in 3, 7 or 11 swings against the 97.76 lows. Then, an acceleration higher in red wave III of blue wave (III) should happen.

MTU Elliott Wave Daily

Source: https://elliottwave-forecast.com/stock-market/mtu-aero-engines-new-cycle-higher/
 

Elliottwave-Forecast

Master Trader
Feb 17, 2017
2,426
9
84
www.elliottwave-forecast.com
There's a lot of talk in Fintwit lately suggesting that precious metals may have ended the long 8 months correction and ready for the next glorious rally. In this article, I will attempt to answer the question whether Gold has ended correction or not using technical analysis. I will use Elliott Wave Theory and also the simple concept of corrective and impulsive structure. Of course, no technical or fundamental analysis will always be 100% perfect. However, based on the current data, there's still a possibility that the correction is not over yet. There are three charts presented below suggesting the correction may not be over.

1. Gold Has not Reached 100% Extreme From August 7, 2020 High

Gold Daily Elliott Wave chart

In the Daily time frame above, we could see Gold forming the peak on August 7, 2020 high and now pulling back in a 7 swing double three (wxy) structure. In this type of structure, ideally wave y reaches 100% - 161.8% Fibonacci extension of the wave w. Gold has not reached the 100%, and at this present stage (April 16, 2021), the rally is not strong enough to suggest for sure that the correction is completed. Therefore, we still can not rule out another extension lower in Gold to the blue box area before ending the correction. If Gold continues to rally, breaks and closes above the descending trend line from August 7, 2020, then at that time we will have more data to consider the 8 months correction is over.

2. The First Leg of Rally from March 9, 2021 is in 3 Waves (Corrective)


4 hour chart above shows the rally from March 9, 2021 low ($1676.1) to wave (A) at $1755.50 is in 3 waves. If Gold has ended the 8 months correction, the rally from the low would have unfolded as an impulsive structure. However, it is only in 3 waves. With the current data, we still can't rule out the possibility for further downside after current corrective rally is over.

3. US Dollar Index Shows 5 Waves Up (Diagonal) From January 6, 2021 Low


4 hour chart of US Dollar Index (DXY) above shows a 5 waves rally from January 6, 2021 low. Thus, as far as the pullback in Dollar Index stays above January 6 low, another leg higher can happen. The strength in US Dollar, if it happens, could affect Gold. Gold can turn lower to reach blue box as first chart shows when US Dollar starts to rally.

Source: https://elliottwave-forecast.com/commodities/gold-ended-correction/
 

Elliottwave-Forecast

Master Trader
Feb 17, 2017
2,426
9
84
www.elliottwave-forecast.com
In this technical blog, we are going to take a look at the past performance of 4 hour Elliott Wave Charts of Microsoft ticker symbol: MSFT, which we presented to members. In which, the rally from 06 January 2021 lows, showed the higher high sequence in an impulse structure favored more strength to take place. Also, the right side tag pointed higher suggested the same side. Therefore, we advised our members to buy the dips in MSFT in 3, 7, or 11 swings at the blue box areas. We will explain the structure & forecast below:

MSFT 4 Hour Elliott Wave Chart​


Above is the 4hr Elliott wave chart of MSFT from the 3/04/2021 update. In which, the pullback to $211.84 low ended bigger wave ((4)) and showed a strong impulse rally higher, which ended wave (1) at $247.70 high. Down from there, the MSFT made a pullback in wave (2) to correct the cycle from 1/06/2021 low. The internals of that pullback unfolded as an Elliott wave zigzag structure where wave A ended at $228.97 low. Wave B bounce ended at $246.13 high and wave C managed to reach the 100%-161.8% Fibonacci extension area of A-B at $227.27- $215.59. From where buyers were expected to appear in the stock looking for more upside.

MSFT Latest 4 Hour Elliott Wave Chart​


Here’s the latest 4 hour Elliott Wave Chart from 04/15/2021 update. In which, the MSFT managed to reach the blue box area at $227.27- $215.59 & showing a strong reaction higher taking place from the blue box area. Allowed members to create a risk-free position shortly after taking the longs at the blue box area.

Source: https://elliottwave-forecast.com/stock-market/msft-offered-good-buying-opportunity/
 

Elliottwave-Forecast

Master Trader
Feb 17, 2017
2,426
9
84
www.elliottwave-forecast.com
In this technical blog, we will look at the past performance of 4 hour Elliott Wave Charts of Nike ticker symbol: NKE, which we presented to members at the elliottwave-forecast. In which, the rally from 18 March 2020 low unfolded as an impulse structure. And showed a higher high sequence favored more upside extension to take place. Therefore, we advised members not to sell the stock & buy the dips in 3, 7, or 11 swings at the blue box areas. We will explain the structure & forecast below:

NKE 4 Hour Elliott Wave Chart​

NKE (Nike) Forecasting The Reaction Higher From the Blue Box Area

Above is the 4hr Elliott wave Chart from the 3/25/2021 update. In which, the stock ended the bigger wave ((3)) at $147.95 high in an impulse sequence. Down from there, the stock made a bigger pullback in wave ((4)). The internals of that pullback initially thought to be a flat structure where wave (A) ended in 3 waves at $128.91 low. Up from there, the wave (B) bounce ended in a lesser degree flat structure at $146.66 high and started the (C) leg lower in an impulse sequence. And managed to reach the $127.57- $115.77 100%-161.8% Fibonacci extension area of (A)-(B). From where buyers were expected to appear looking for more upside or for a 3 wave bounce at least. (It's important to note that with further data we were able to adjust the degree of a pullback to a double three instead of a flat correction lower).

NKE Latest 4 Hour Elliott Wave Chart​

NKE (Nike) Forecasting The Reaction Higher From the Blue Box Area

Here's the latest 4hr Elliott wave Chart from the 4/15/2021 update. In which, the stock managed to reach the blue box area at $127.57- $115.77 & showing a reaction higher taking place from the blue box area. Right after ending the double three correction within the blue box area at $124.84 low. Allowed members to create a risk-free position shortly after taking the long positions at the blue box area. However, a break above $147.95 high still needed to confirm the next extension higher & avoid double correction lower.

Source: https://elliottwave-forecast.com/stock-market/nke-forecasting-reaction-higher/
 

Elliottwave-Forecast

Master Trader
Feb 17, 2017
2,426
9
84
www.elliottwave-forecast.com
Infineon Technologies AG is a German semiconductor manufacturing corporation. It has been founded 1999 as a spin-off from Siemens AG and the headquarteres of the company are in Neubiberg, Germany. Today, Infineon belongs to the DAX index and one can trade it under the ticker $IFX at Frankfurt Stock Exchange. The company is the world leader in automotive and power semiconductors. Worldwide, Infineon counts more than 45'000 employees.

Infineon Monthly Elliott Wave Analysis 04.16.2021​

The monthly chart below shows the Infineon shares $IFX traded at Frankfurt Stock Exchange. From the all-time lows, the stock price has developed a cycle higher in wave ((I)) towards the 77.57 highs. There, in June 2000, it has printed the all-time highs. After the primary impulse higher, a correction lower in wave ((II)) has ended on March 2009 at 0.31.

From the March 2009 lows, a new cycle in wave ((III)) has started and develops a series of nests. First of all, a cycle higher as a blue wave (I) has ended in June 2018 at 25.76. Hereby, within the impulsive advance, all the subwaves I, III and V are impulsive waves, too. Wave III demonstrates a clear extension in price. From the June 2018 highs, a correction in wave (II) lower has unfolded as a double three pattern. It has printed the low in March 2020 at 10.13.

From the March 2020 lows, a new cycle in wave (III) of ((III)) has already started. As a matter of fact, break of 25.76 has confirmed that. As of right now, the price is within red wave I of blue wave (III). Once finished, pullback in wave II should find support in 3, 7, 11 swings above 10.13 lows for another extension higher in wave III. Therefore, investors and traders can be looking to buy Infineon targeting the 77.97-125.94 area in a longer view.

Infineon Elliott Wave Weekly

Infineon Daily Elliott Wave Analysis 04.16.2021​

The Daily chart below shows the $IFX shares price action in more detail. From the March 2020 lows at 10.13, the stock price has advanced in black waves ((1)) – ((3)) of the red wave I. The correction lower in wave ((4)) has ended at 31.61. While above there, the Infineon stock is within black wave ((5)) of red wave I. Once the march 2020 cycle in wave I has finished, expect a pullback in wave II to find support in 3, 7 or 11 swings above 10.13 lows for an expected acceleration in wave III of (III).

Infineon Elliott Wave Daily

Source: https://elliottwave-forecast.com/stock-market/infineon-nesting-acceleration-higher/
 

Elliottwave-Forecast

Master Trader
Feb 17, 2017
2,426
9
84
www.elliottwave-forecast.com
Hello fellow traders. In this technical blog we’re going to take a quick look at the Elliott Wave charts of Sugar Futures ( $SB_F) , published in members area of the website. As our members know, we’ve been calling rally in the commodity. We recommended members to avoid selling in any proposed pull back and keep buying the dips in 3,7,11 swings. Recently SB_F made pull back that has unfolded as Elliott Wave Zig Zag pattern . In the further text we are going to explain the Elliott Wave Pattern and Forecast

Before we take a look at the real market example, let’s explain Elliott Wave Zigzag.

Elliott Wave Zigzag is the most popular corrective pattern in Elliott Wave theory . It’s made of 3 swings which have 5-3-5 inner structure. Inner swings are labeled as A,B,C where A =5 waves, B=3 waves and C=5 waves. That means A and C can be either impulsive waves or diagonals. (Leading Diagonal in case of wave A or Ending in case of wave C) . Waves A and C must meet all conditions of being 5 wave structure, such as: having RSI divergency between wave subdivisions, ideal Fibonacci extensions and ideal retracements.

SugarNow let's take a look what Elliott Wave Zig Zag looks like in real market example.

Sugar Futures ( $SB_F ) Elliott Wave 4 Hour Chart 3.25.2021​

Right side remains in the favor of commodity. Sugar Futures remains buy in a dips. Current view suggests (4) blue pull back is unfolding as Elliott Wave Zig Zag pattern with inner labeling: ABC red. We can see that wave A red shows impulsive 5 waves structures . C red leg also shows 5 waves at the moment, however we believe more short term weakness can be seen within blue box area 15.00-14.03. We don't recommend selling it and favor the long side from the mentioned zone. As the main trend is bullish we expect buyers to appear for 3 waves bounce at least.
As our members know, Blue Boxes are no enemy areas , giving us 85% chance to get a bounce.

You can learn more about Elliott Wave Zig Zag Patterns at our Free Elliott Wave Educational Web Page.

Sugar

Sugar Futures ( $SB_F ) Elliott Wave 4 Hour Chart 4.7.2021​

The commodity made more short term weakness within the blue box as expected. Buyers appeared there and we are getting reaction. We believe pull back is completed at 14.67 low, however still need to see further separation from the latest low to confirm cycle from the peak is completed.

Sugar Futures ( $SB_F ) Elliott Wave 4 Hour Chart 4.7.2021​

14.67 low held nicely and the commodity made further extension higher as we expected. Cycle from the 14.67 low can be unfolding as 5 waves structure. We would like to see break above April peak to confirm next leg up is in progress.

Keep in mind that market is dynamic and presented view could have changed in the mean time. Best instruments to trade are those having incomplete bullish or bearish swings sequences. We put them in Sequence Report and best among them are shown in the Live Trading Room. You can check most recent charts in the membership area of the site.

Sugar

Elliott Wave Forecast
Source: https://elliottwave-forecast.com/elliottwave/sugar-sb_f-rally-elliott-wave-zig-zag-2/
 

Elliottwave-Forecast

Master Trader
Feb 17, 2017
2,426
9
84
www.elliottwave-forecast.com
Today we look at Facebook (FB) after reaching the blue box, and its potential to continue higher

Looking at the 1 hour chart from 4/14/2021 below, we see a five wave sequence up from the $277.10 levels. This move completed a cycle in red wave 3. Within the red wave 3 itself, we see a subdivision of the third wave into lower degree blue waves (i) to (v), which are also impulse waves. We also see an extension in blue wave (i) of ((iii)). In other words, impulse with extension in blue wave (i). We usually see extensions in third waves.

Down from the red wave 3 peak, we see a correction underway in red wave 4. The stock completed black wave ((w)) within the smaller blue box between $308.47 and $304.59. Up from there, the stock completed the 4th swing in black wave ((x)) at around $315. Thereafter, it turned lower in black ((y)), towards the $306.16 and $301.04 blue box area.

Elliott Wave 1 Hour Chart 4/14/2021​

FB

In line with our strategy, we entered long positions from the $308.47 and $304.59 blue box area. However, we see that the stock later went lower, below the 100% extension. We incurred no losses, as our clear strategy rules put stop below the 161.8% extension. We create risk free positions from entry when it reaches specific retracement levels.

In the 1 hour chart below from 4/16/2021, we had minor label adjustments, upgrading the degrees one level higher. After FB reached the blue box, it reacted higher. Black wave ((i)) is proposed completed at around the $310 area. We expected a pullback lower in black wave ((ii)) before we see upside continuation. As per Elliott Wave Rules, black wave ((ii)) should find support above the start of black wave ((i)). And subsequent waves ((iii)) to ((v)) of 1 shall be expected. We, however; need to see a break above blue wave ((3)) to confirm the next leg higher in blue wave ((5)). Lest, we see a double correction lower in (4) which we like to buy again in larger 7 swing if that happens.

Elliott Wave 1 Hour Chart 4/16/2021​

FB

Source: https://elliottwave-forecast.com/stock-market/facebook-fb-continue-rallying/
 

Elliottwave-Forecast

Master Trader
Feb 17, 2017
2,426
9
84
www.elliottwave-forecast.com
Franco Nevada (ticker: FNV) is a Canada-based company that own royalties and streams in gold mining and other commodity and natural resource investments. The company does not operate mines, develop projects, or conduct explorations. The entire business model of the company focuses on managing the royalties and streams. In the following article, we will take a look at the Elliott Wave count for the company

Franco Nevada (FNV) Monthly Elliott Wave Chart​


Monthly Elliott Wave chart for FNV above shows that the rally from all time low is unfolding as a 5 waves impulse Elliott Wave structure. Wave (I) ended at86.08 and pullback in wave (II) ended at 58.26. The stock resumed higher in wave (III) towards 166.11, and pullback in wave (IV) is proposed complete at 105.82. The stock still needs to break above wave (III) to avoid a double correction. Alternatively, the rally can be in a nest where the high on August 5, 2020 ended wave I of (III) and the low on March 1, 2021 ended wave II of (III). The alternate count implies a more bullish view of the stock

FNV Daily Elliott Wave Chart​

Franco Nevada (FNV) Daily Chart

Daily Elliott Wave chart for Franco Nevada (FNV) above suggests that wave (IV) pullback is proposed complete at 105.82. This means that the stock has resumed higher in wave (V) and should eventually break above wave (III) at 166.11. The rally from wave (IV) low so far looks impulsive which supports the idea the correction might be over, although a confirmation and break above wave (III) is still required to rule out a double correction.

FNV 4 Hour Elliott Wave Chart​


4 Hour Chart above shows that wave (IV) ended at 105.82 with internal subdivision as a zigzag. Down from wave (III), wave a ended at 131.78, and bounce in wave b ended at 151.48. Stock then resumed lower in wave c towards 105.62. Up from there, wave (1) ended at 112.17 and wave (2) dips ended at 105.64. Stock then resumes higher in wave (3) towards 125.29, and wave (4) dips ended at 121.2. Expect wave (5) to end soon which should complete wave I. Stock then should pullback in wave II to correct cycle from March 2 low before the rally resumes. As far as wave (IV) pivot at 105.82 low stays intact, expect dips to find support in 3, 7, or 11 swing for further upside.

Source: https://elliottwave-forecast.com/stock-market/franco-nevada-fnv-may-have-resumed-higher/
 

Elliottwave-Forecast

Master Trader
Feb 17, 2017
2,426
9
84
www.elliottwave-forecast.com
Since the crash of March 2020, all stocks have tried to recover what they lost and JNJ was no exception. Johnson & Johnson did not only recover the lost, but It also reached historic highs. Now, we are going to try to build a wedge from the March 2020 lows with a target above $176.

JNJ Last Daily Chart

JNJ Last Daily ChartIn the last chart we can clearly see that after the fall of March 2020, JNJ had a strong and rapid recovery. This wave ((3)) had its highest point at 173.69 where JNJ was rejected by the market. This rejection did another double correction structure and overlaps the wave ((1)) zone to end the wave ((4)). (If you want to learn more about Elliott Wave Theory, please follow this link: Elliott Wave Theory).

JNJ Daily Chart

JNJ Daily ChartAs days passed, the share price continued to rise until reaching 167.12, which we call wave (i). From there, we have a clear correction in a zig zag structure as wave (2) that bounced from a possible trendline. If this trendline is good, then JNJ should continue to rise with an impulse structure that exceeds at least the value of $ 173.69 in the following days.

Source: https://elliottwave-forecast.com/stock-market/jnj-continue-rally-week/
 

Elliottwave-Forecast

Master Trader
Feb 17, 2017
2,426
9
84
www.elliottwave-forecast.com
Farmer Bros. Co is an U.S. american coffee foodservice company based in Nortlake, Texas, USA. Founded in 1912 and traded under tickers $FARM at Nasdaq, it is a component of the Russel2000 index. Farmer Brothers specializes in the manufacture and distribution of coffee, tea and other food items. Currently, we can see coffee and other softs turning higher. Therefore, Farmer Brothers being an important player in coffee as a commodity should become a good opportunity for investors to participate in the anticipated rally in soft commodity prices.

Farmer Brothers Quarterly Elliott Wave Analysis 04.19.2021​

The Monthly chart below shows the Farmber Bros. Co shares $FARM traded at NASDAQ. First, the stock price has developed an impulse higher in black wave ((I)) of grand super cycle degree. It has printed the all-time highs in 2nd quarter of 2004 at 39.39. From the highs, a correction lower in black wave ((II)) has unfolded as an Elliott wave regular flat pattern. It has printed an important bottom in October 2020 at 3.40.

From October 2020 lows, a new cycle in wave ((III)) has already started and should extend towards 39.39 highs and beyond. Then, the target for wave ((III)) will be towards 42.84-67.20 area and even higher.

Farmer Brothers Monthly

Farmer Brothers Daily Elliott Wave Analysis 04.19.2021​

The daily chart below shows the early stages of the wave ((III)). From the October 2020 lows, $FARM has developed blue waves (1)-(3) within the initial impulse in black wave ((1)). Currently, wave (4) might have ended and a blue wave (5) should see a new high. In overall, wave ((1)) can end soon. Therefore, it is risky to chase Farmer Bros. Co at current prices. Investors and traders can be looking to buy the pullback in wave ((2)) in 3, 7 or 11 swings against 3.40 lows.

Farmer Brother Daily

Source: https://elliottwave-forecast.com/stock-market/farm-farmer-brothers/
 

Elliottwave-Forecast

Master Trader
Feb 17, 2017
2,426
9
84
www.elliottwave-forecast.com
In this technical blog, we will look at the past performance of 4 hour Elliott Wave Charts of Wheat futures ticker symbol: $ZW_F, which we presented to members at the elliottwave-forecast. In which, the rally from 26 June 2020 low unfolded as an impulse structure. And showed a higher high sequence favored more upside extension to take place. Therefore, we advised members not to sell the Wheat & buy the dips in 3, 7, or 11 swings at the blue box areas. We will explain the structure & forecast below:

Wheat 4 Hour Elliott Wave Chart​

Dip In Wheat Offered a Good Elliott Wave Buying Opportunity

Above is the 4hr Elliott wave Chart from the 3/29/2021 update. In which, the Wheat made a bigger pullback to correct the cycle from 6/26/2020 low. The internals of that pullback unfolded as Elliott wave double three structure where wave W ended in 3 swings at $624.2 low. Up from there, a bounce to $683.4 high then ended wave X as a lesser degree zigzag structure. Down from there, Wheat started the Y leg lower & managed to reach the 100%- 161.8% Fibonacci extension area of W-X at $614.6- $572 area lower. From where buyers were expected to appear looking for more upside or for a 3 wave bounce at least. (It’s important to note that with further data we were able to adjust the degree of a pullback).

Wheat 4 Hour Elliott Wave Chart​

Dip In Wheat Offered a Good Elliott Wave Buying Opportunity

Here's the latest 4hr Elliott wave Chart of Wheat from the 4/20/2021 update. In which the commodity managed to reach the blue box area at $614.6- $572 & showing a strong reaction higher taking place from the blue box area. Right after ending the double three correction within the blue box area at $593.6 low. Allowed members to create a risk-free position shortly after taking the long positions at the blue box area. However, a break above $693 high still needed to confirm the next extension higher & avoid double correction lower.

Source: https://elliottwave-forecast.com/commodities/dip-wheat-offered-good-elliott-wave-buying-opportunity/
 

Elliottwave-Forecast

Master Trader
Feb 17, 2017
2,426
9
84
www.elliottwave-forecast.com
In this technical blog, we will look at the past performance of 4 hour Elliott Wave Charts of Coffee futures ticker symbol: $KC_F, which we presented to members at the elliottwave-forecast. In which, the rally from 04 November 2020 low unfolded as an impulse structure. And showed a higher high sequence favored more upside extension to take place. Therefore, we advised members not to sell the Coffee & buy the dips in 3, 7, or 11 swings at the blue box areas. We will explain the structure & forecast below:

Coffee 4 Hour Elliott Wave Chart​

Coffee Bouncing From The Elliott Wave Blue Box Area

Above is the 4hr Elliott wave Chart of Coffee from the 3/31/2021 update. In which, the instrument is showing 5 waves rally from $102.14 low in an impulse sequence where wave 1 ended at $131.75 high. Wave 2 ended at $120.20 low, wave 3 ended at $139.60, wave 4 ended at $136.15 and wave 5 ended at $140.45 high thus completed wave (1). Down from there, the Coffee made a pullback to correct the cycle from 11/04/2020 low.

The internals of that pullback unfolded as Elliott wave zigzag structure where wave A ended at $126.60. Wave B bounce ended at $135.65 high and wave C managed to reach the blue box area at $122.02- $113.60. From where buyers were expected to appear looking for more upside or for a 3 wave bounce at least. (It’s important to note that with further data we were able to adjust the degree of a pullback into a double three structure instead of a zigzag).

Coffee Latest 4 Hour Chart​

Coffee Bouncing From The Elliott Wave Blue Box Area

Here’s the latest 4hr Elliott wave Chart of Coffee from the 4/22/2021 update. In which the commodity is showing a strong reaction higher taking place from the blue box area. Right after ending the double three corrections within the blue box area at $120.50 low. Allowed members to create a risk-free position shortly after taking the long positions at the blue box area. However, a break above $140.45 high still needed to confirm the next extension higher & avoid double correction lower.

Source: https://elliottwave-forecast.com/commodities/coffee-bouncing-blue-box-area/
 

Elliottwave-Forecast

Master Trader
Feb 17, 2017
2,426
9
84
www.elliottwave-forecast.com
Oil has hard a remarkable rally from the March 2020 low, and further upside is favoured to take place in the energy sector still. There is one energy producer that has vastly outperformed many other producers, Torchlight Energy Resources. From an all time low of 21 cents set in September 2020, to the recent peak of 4.83, this stock represents high volatility price action. Lets take a look at the company profile and see what they do:

"Torchlight Energy Resources, Inc. (NASDAQ: TRCH), based in Plano, Texas, is a high growth oil and gas Exploration and Production (E&P) company with a primary focus on acquisition and development of highly profitable domestic oil fields. The company currently holds interests in Texas where their targets are established plays such as the Permian Basin and the Eagle Ford Shale."

lets dig into the charts!

Torchlight Energy Resources Elliott wave View:

Torchlight Energy

From the September 2020 low at 0.21, the trajectory on this stock is nothing less than extraordinary. The rally from the 0.21 September low to the 4.83 February peak represents a 2300% return within a few short months. It can be expected that a long and deep correction can be expected from such a rally. There is a clear 5 waves structure heading into the Feb peak. Coming out of an all time low in September 2020, this peak can be counted as the first wave of a long extended rally. From the Red I peak, prices sharply fell in a double correction ((W)) wave. After that, a connector in ((X)). After that, another swing lower to form a low in Red II.

The RSI momentum at the Red II low has a very extreme reading. Should the stock continue to fall lower than 1.27, it would likely diverge in momentum. This would would point to a more prolonged correction in time and price. For now, the bottom is favoured to be set as long as $1.27 level holds. Presently, the expectation is for a rally into blue (1) before pulling back in (2), and then further extension higher.

Risk Management​

Above all, using proper risk management is absolutely essential when trading or investing in a volatile stocks. Elliott Wave counts can evolve quickly, be sure to have your stops in and define your risk when trading.

Source: https://elliottwave-forecast.com/stock-market/torchlight-energy-resources-trch-moving-higher/
 

Elliottwave-Forecast

Master Trader
Feb 17, 2017
2,426
9
84
www.elliottwave-forecast.com
Hello fellow traders. Palladium Futures ( $HG_F ) is another instrument that has given us nice trading opportunity lately . As our members know the commodity is showing impulsive bullish sequence. We recommended members to avoid selling the commodity and keep on buying the dips in 3,7,11 sequences when get chance. In this technical blog we’re going to take a quick look at the charts of Palladium published in members area of the website and explain the Elliott Wave structure and trading strategy.

Palladium $PA_F Elliott Wave 1 Hour Chart 4.20.2021​

Palladium remains bullish against the 2590.1 low . Pull back looks incomplete at the moment. The price hasn't reached equal legs from the peak yet. The Commodity can give us another leg down toward 2755.8-2718.43 area. We don't recommend selling and favor the long side. The main trend is bullish we expect to see at least 3 waves bounce from the marked blue box zone. As our members know Blue Boxes are no enemy areas , giving us 85% chance to get a reaction.

You can learn more about Elliott Wave Patterns at our Free Elliott Wave Educational Web Page.

Palladium

Palladium $PA_F Elliott Wave 1 Hour Chart 4.21.2021​

We got leg down toward buying zone: 2755.8-2718.43 ( blue box area) . Buyers appeared there as we expected. The commodity found buyers and giving us nice reaction from the area. Current view suggests wave 4 red pull back ended at the 2721.7 low. We would like to see further extension higher and break above 3 red peak to confirm next leg up is in progress.


Palladium $PA_F Elliott Wave 1 Hour Chart 4.21.2021​

Rally continued and we got break above 3 red peak, confirming next leg up is in progress. The commodity now remains bullish against the 2721.73 low. It's expected to keep finding buyers in 3,7,11 swings against the 2721.73 low in first degree.

Keep in mind that market is dynamic and presented view could have changed in the mean time. Not every chart is trading recommendation. You can check most recent charts in the membership area of the site. Best instruments to trade are those having incomplete bullish or bearish swings sequences. We put them in Sequence Report and best among them are shown in the Live Trading Room.

Palladium

Elliott Wave Forecast
Source: https://elliottwave-forecast.com/commodities/palladium-buying-dips-blue-box/
 

Elliottwave-Forecast

Master Trader
Feb 17, 2017
2,426
9
84
www.elliottwave-forecast.com
Since earlier this year, EURGBP has been trending lower due to the risk of Brexit off the table and optimism of UK's vaccination program. We forecasted the move lower in EURGBP in our article on January 19 here --> Pound Sterling Gains as UK Accelerated Vaccine programme. We highlighted in January's article that EURGBP breaks the ascending trend line from 4.30.2020 as the chart below shows:

EURGBP Daily Chart from January 19 shows pair breaking trend line​


We argued that the good news from UK and also break below the trend line portends a strong move lower. We were right and pair extended lower 500 pips to 0.85 in the next 4 months. Lately EURGBP has started to rally but it should soon resume the move to the downside.

EURGBP Daily Chart 26 April 2021​

EURGBP Daily Elliott Wave

From Daily Chart above, we can count the decline from 3.19.2020 high as either (A)-(B)-(C) or (1)-(2)-(3). The internal of first leg lower is looking impulsive and thus better to label it as either wave (A)/(1). The decline from wave (B)/(2) so far looks only to be in 3 waves and thus need 1 more leg lower at least. This suggests rally in wave 4 should fail in 3, 7, or 11 swing for more downside. Potential area to end wave 4 is 0.884 - 0.90 which is where wave 4 reaches extreme area in 3 waves from wave 3 low. From this area, pair can see further downside or 3 waves pullback at least.

Source: https://elliottwave-forecast.com/forex/eurgbp-resume-bearish-trend-soon/
 

Elliottwave-Forecast

Master Trader
Feb 17, 2017
2,426
9
84
www.elliottwave-forecast.com
Unifi Inc. is a global textile solutions provider based in Greensboro, North Carolina, USA. The stock being a component of the Russel3000 index can be traded under ticker $UFI at NYSE. Unifi is one of the world's leading innovators in manufacturing synthetic and recycled performance fibers. The company is in a possession of proprietary technologies and produces goods for such end markets like apparel, automotive, furnishings, accessories, footwear and many more. Currently, we can see cotton as a basis for the textile industry turning higher. Therefore, Unifi being an important player in the textile market should be a great opportunity for investors to diversify their portfolio by indirect investement in the rising cotton prices.

Unifi Quarterly Elliott Wave Analysis 04.25.2021​

The Quarterly chart below shows the Unifi shares $UFI traded at NYSE. First, the stock price has developed an impulse higher in black wave ((I)) of grand super cycle degree. It has printed the all-time highs in the 3rd quarter of 1997 at 130.88. From the highs, a correction lower in black wave ((II)) has unfolded as an Elliott wave zigzag pattern. It has printed an important bottom in the 1st quarter of 2009 at 1.32. As a matter of fact, the stock price has lost 99% of its value within 12 years.

From 2009 lows, a new cycle in wave ((III)) has already started and should extend towards 130.88 highs and beyond. Then, the target for wave ((III)) will be towards 132.55-213.62 area and even higher.

From 2009 to 2017, we saw a motive cycle higher in blue wave (I) of black wave ((III)). It has ended at 39.21 highs. From the highs, a correction lower in 3 waves as blue wave (II) has ended in March 2020 at 7.48. Indeed, this can be seen a s a first nest within a larger wave ((III)). Now, from the lows, a new cycle in wave (III) of ((III)) may have already started.

Unifi Elliott Wave Quarterly

Unifi Daily Elliott Wave Analysis 04.25.2021​

The daily chart below shows the early stages of the blue wave (III) of black wave ((III)). From the March 2020 lows, $UFI has developed blue waves (1)-(3) within the initial impulse in black wave ((1)). Currently, wave (4) might have ended and a blue wave (5) should see a new high. In overall, wave ((1)) can end soon. Therefore, it is risky to chase Unifi at current prices. Investors and traders can be looking to buy the pullback in wave ((2)) in 3, 7 or 11 swings against 7.48 lows targeting 45.29-68.71 area and even higher.

Unifi Elliott Wave Daily

Source: https://elliottwave-forecast.com/stock-market/textile-provider-unifi-accelerate-higher/