Elliottwave-Forecast

Master Trader
Feb 17, 2017
2,426
9
84
www.elliottwave-forecast.com
AUDCAD Elliottwave Intraday View

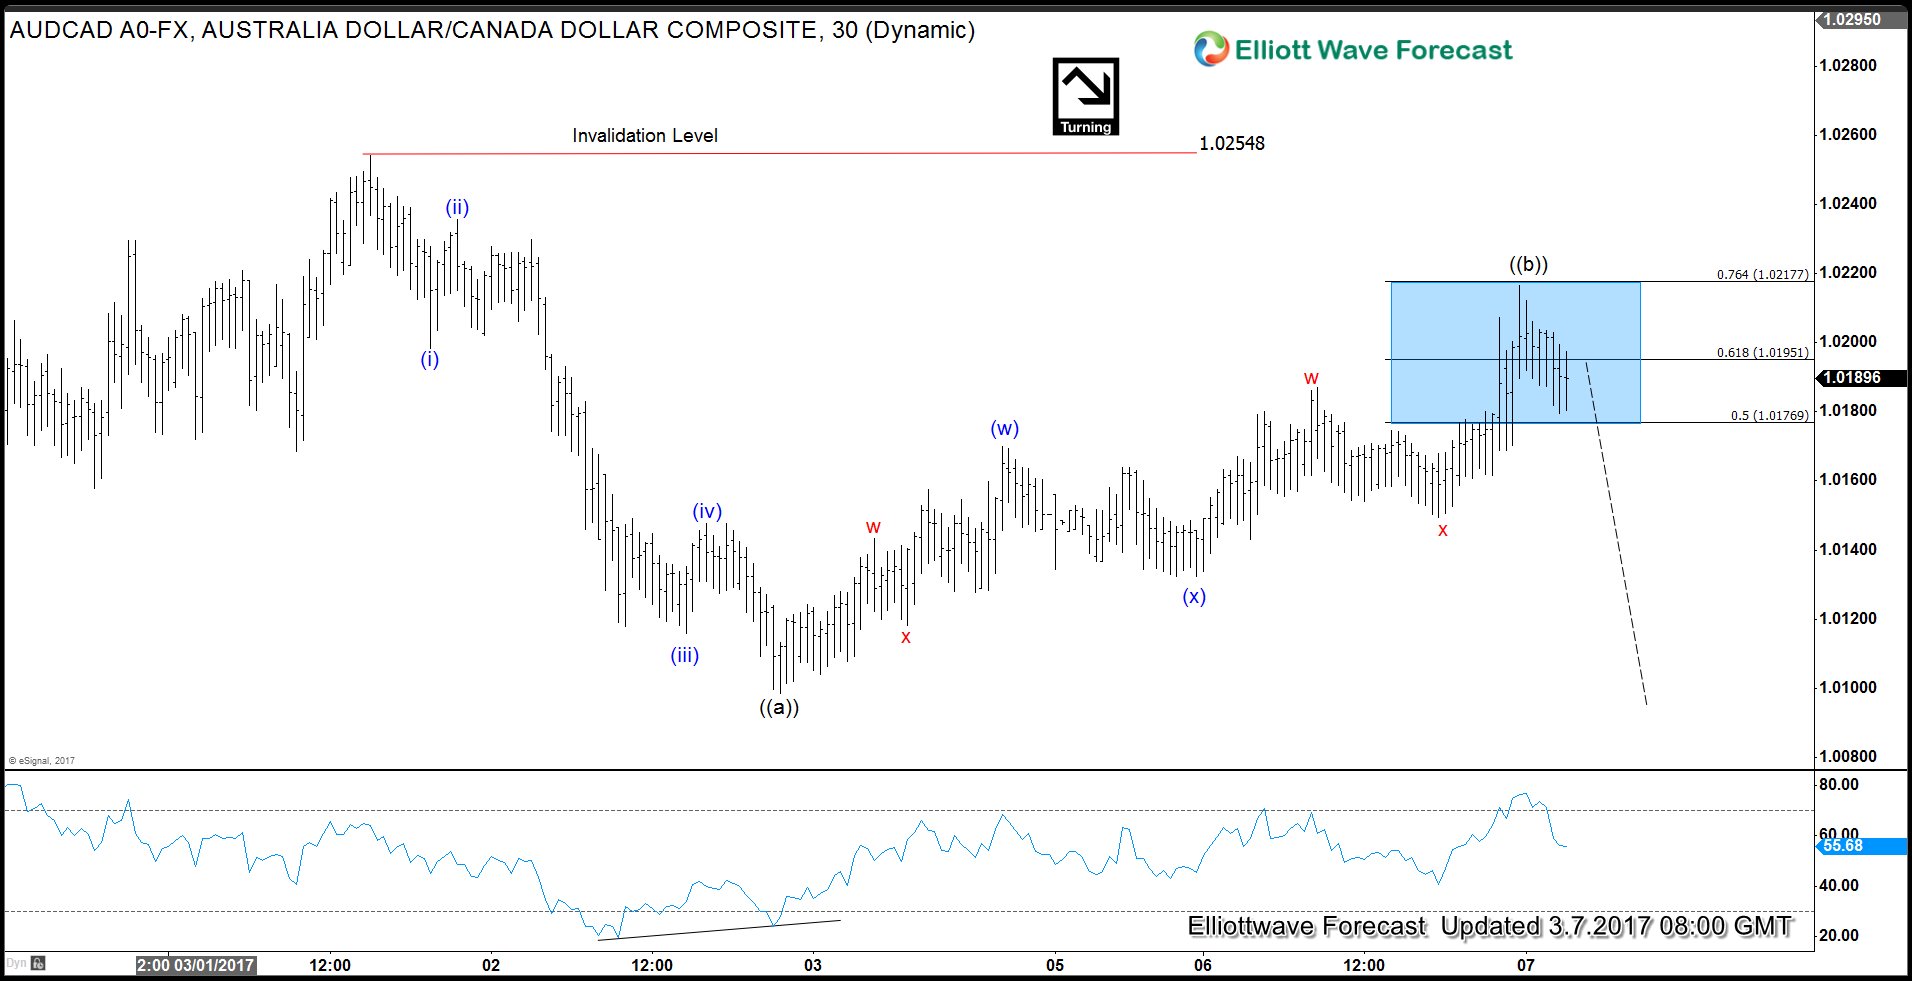
Short term #Elliottwave structure of AUDCAD from 3/1 peak (1.025) looks to be showing an impulse structure with a nice 5 waves subdivision where Minuette wave (i) ended at 1.0198, Minuette wave (ii) ended at 1.0235, Minuette wave (iii) ended at 1.0115, Minuette wave (iv) ended at 1.0147, and Minuette wave (v) ended at 1.0098. We can also see momentum divergence at the end of wave (v) as shown by the RSI making lower high while price makes lower low. This 5 waves down form a higher degree Minute wave ((a)) of a zigzag structure. The 5 waves move from 1.025 high doesn't look to be part of wave C of a FLAT in higher degree structure, which implies that while AUDCAD stays below 1.025, we can see another leg lower in the pair in wave ((c)) to end the zigzag structure. Potential target for wave ((c)) is towards 1.0025 – 1.006 area.

1 Hour chart AUDCAD 03.07.2017


Elliottwave-Forecast

Master Trader
Feb 17, 2017
2,426
9
84
www.elliottwave-forecast.com
EURUSD: Elliott wave sequence from February peak

EURUSD Elliott Wave Sequence from 2/2 peak doesn’t support the idea of 5 wave impulse or even a series of 1,2’s. Decline from 2/2/2017 high to 2/15/2017 low was a 7 swing sequence and the decline from 2/16/2017 to 2/22/2017 low was also a 7 swing decline. This means neither leg down from 2/2/2017 peak was in 5 waves. Even if we were to force the bias and view the two legs down from 2/2/2017 peak as a 5 wave move, still the decline from 2/2/2017 peak is not an impulse because price has already broken above the down trend line connecting 2/2/2017 high to 2/16/2017 high which negates the idea of a bearish 1,2, ((i))-((ii)). Thus, we can conclude that based on EURUSD Elliott Wave Sequence, decline from February peak is not an impulsive. EURUSD Elliott Wave sequence from February peak suggests cycle from 2/2/2017 high ended at 2/22/2017 (1.0492) and pair has either already finished the bounce at 3/6/2017 (1.0640) high or will hold 2/22/2017 (1.0492) low during this pull back and make another extension higher to do a double correction up from 1.0492 low.

EURUSD Elliott Wave Sequence chart from February peak

 
  • 👍
Reactions: Génova and Mike_Wah

Elliottwave-Forecast

Master Trader
Feb 17, 2017
2,426
9
84
www.elliottwave-forecast.com
Crude Oil (CL_F) looking for buying area

Short term Elliottwave view in Crude Oil (CL_F) suggests that the instrument is currently correcting cycle from 11/14/2016 low (42.21) in 3, 7, or 11 swing before the next leg higher. The decline starting from 2/23 high (54.94) is unfolding as a double three Elliottwave structure where wave ((w)) ended at 52.54 and wave ((x)) ended at 53.80. Near term focus is on 52.47 – 52.64 area to complete wave (w) of ((y)), then Crude Oil should bounce in wave (y) of ((y)) before turning lower again towards as low as 49.34 – 50.41 area, provided that pivot at 53.8 high remains intact. We don’t like selling the proposed pullback and expect the next buying area of 49.34 – 50.41 to find dip buyers for the next leg higher or at least a 3 waves bounce.

CL_F 1 hour chart 03.08.2017

 
  • 👍
Reactions: Mike_Wah

Elliottwave-Forecast

Master Trader
Feb 17, 2017
2,426
9
84
www.elliottwave-forecast.com
CL_F Elliott Wave View: Ending a Flat Correction

Short term Elliottwave view in Crude Oil (CL_F) suggests that the instrument is currently correcting cycle from 11/14/2016 low (42.21) in 3, 7, or 11 swing before the next leg higher. Revised view suggests the decline starting from 1/3 high (55.24) is unfolding as a flat Elliottwave structure where Minor wave A ended at 50.71 and Minor wave B ended at 54.94. Minor wave C is in progress and subdivided as 5 waves diagonal where Minute wave ((i)) ended at 52.54, Minute wave ((ii)) ended at 53.8, and Minute wave ((iii)) ended at 50.05. A bounce in Minute wave ((iv)) is expected now followed by another low in Minute wave ((v)) towards 47.6 – 49.34 area to end cycle from 1/3 high. Afterwards, expect Crude Oil to resume the rally higher or at least bounce in 3 waves to correct the cycle from 1/3 high. We don’t like selling the proposed pullback and expect buyers to appear from 47.6 – 49.34 area for at least 3 waves bounce, provided that pivot at 11/14/2016 (42.21) stays intact.

CL_F 1 Hour Chart 03.09.2017


Elliottwave-Forecast

Master Trader
Feb 17, 2017
2,426
9
84
www.elliottwave-forecast.com
USDJPY Intra-day Elliott Wave view

JPY (USDJPY) made a new high above last Friday’s peak and now seems to be pulling back. Move up from 113.53 ((x)) low could be viewed as a 5 swing Leading Diagonal Elliott Wave structure. There is RSI divergence (not showing) between red wave iii and blue (a) which further supports the idea of JPY move up from 113.53 low being a diagonal structure. As per Elliott Wave theory, after a 5 wave move up or diagonal structure higher completes, pair should make a corrective pull back before rallying again. Decline from 114.93 -114.48 could be viewed as just the first leg of proposed wave (b) pull back. As current bounce stays below 114.93, pair has scope to make another push lower to complete wave (b) pull back before it turns higher again in wave (c) towards 115.30 -116.11 area. As pair is showing 5 waves up from 113.53 low, we don’t like selling the pair in proposed wave (b) pull back and expect it to find intra-day buyers in the dip as far as price stays above 113.53 low and the pivot there remains intact. Break above 114.93 would suggest wave (b) completed already at 114.48 and pair has started the next leg higher in wave (c) toward the above mentioned area.

JPY (USDJPY) 1 Hour Chart 03.09.2017
 
  • 👍
Reactions: wangyiyi

Elliottwave-Forecast

Master Trader
Feb 17, 2017
2,426
9
84
www.elliottwave-forecast.com
CL_F Elliott Wave View: Bounce expected soon

Short term Elliottwave view in Crude Oil (CL_F) suggests that the instrument is currently correcting cycle from 11/14/2016 low (42.21) in 3, 7, or 11 swing before the next leg higher. Revised view suggests the decline starting from 1/3 high (55.24) is unfolding as a flat Elliottwave structure where Minor wave A ended at 50.71 and Minor wave B ended at 54.94. Minor wave C is in progress and subdivided as 5 waves diagonal where Minute wave ((i)) ended at 52.54, Minute wave ((ii)) ended at 53.8, and Minute wave ((iii)) ended at 50.05 and Minute wave ((iv)) ended at 50.85. The current pullback has reached minimum swing and extension to finish cycle from 1/3 high, but while short term bounce fails below 50.85, another leg lower can’t be ruled out towards 46.8 – 47.5 area to end Intermediate wave (4) pullback. Afterwards, look for Crude Oil to resume the rally higher or at least bounce in 3 waves to correct cycle from 1/3 high. We don’t like selling the proposed pullback and expect Crude Oil to find support soon once wave ((v)) of (4) is confirmed complete, provided that pivot at 11/14/2016 (42.21) stays intact.

CL_F 1 Hour Chart 03.10.2017


Elliottwave-Forecast

Master Trader
Feb 17, 2017
2,426
9
84
www.elliottwave-forecast.com
GBP USD Elliott Wave View: Bounce Started

Last week , GBP USD ended the cycle from 02/02/2017 peak which unfolded as a double three Elliott wave structure with a FLAT in the Y leg. Pair slightly exceeded 123.6 Fibonacci extension (1.2145) of the first 3 swings lower from 2/2 peak before making a push higher today. With the bounce seen today, it has become more clearer that pair has ended the cycle at least from 2/24 (1.2570) high at least and as dips hold above 1.2132 low, pair can extend into the bounce . In the near-term , the pair ended 3 waves bounce and it’s expected to pullback lower against the recent low 1.2132 . The pair should hold above that level for 1 more leg higher at least and could reach as highs as 50 – 61.8 Fibonacci retracement area that comes around 1.2420 – 1.2486 area.

If GBP USD makes another low, it should still be in the same cycle from 2/2 (1.2706) and decline could then be labelled as an ABC from 02/02 peak and the new low will be part of wave (( v )) of C New low, if seen, should be short-lived and we can see the pair bouncing again from 1.2100 – 1.2009 area.

GBP USD 1 Hour Chart 03.13.2017


Elliottwave-Forecast

Master Trader
Feb 17, 2017
2,426
9
84
www.elliottwave-forecast.com
FTSE Elliott Wave View: Extending higher

Short term Elliottwave view in FTSE suggests that the instrument is showing a 5 swing sequence from 2/1 low (7087.67) favoring more upside. From 2/1 low, the Index is rallying as a double three Elliottwave structure where Minute wave ((w)) ended at 7329.56 and Minute wave ((x)) ended at 7192.45. Index has since broken above 7329.56, suggesting the next leg higher in Minute wave ((y)) has started. The subdivision of Minute wave ((y)) is also in a double three Elliottwave structure where Minutte wave (w) ended at 7394.6 and Minutte wave (x) ended at 7262.95. Up from there, rally is unfolding as a zigzag Elliottwave structure where Subminutte wave a ended at 7373 and Subminutte wave b ended at 7342.02. Near term, while pullbacks stay above 7262.95, and more importantly above 7192.45, expect Index to extend higher. We don’t like selling the Index.

FTSE 1 Hour Chart 03.14.2017


Elliottwave-Forecast

Master Trader
Feb 17, 2017
2,426
9
84
www.elliottwave-forecast.com
EURJPY Elliott Wave View: Pullback in progress

Short term Elliott Wave view in EURJPY suggests that the pair has ended the cycle from 2/24 low (118.18) and the instrument is pulling back to correct that cycle before turning higher again. Primary wave ((5)) is currently in progress higher and the rally from Primary wave ((4)) low at 118.18 is unfolding as an ending diagonal Elliott wave structure where Intermediate wave (1) ended at 122.88. The subdivision of Intermediate wave (2) pullback is proposed to be in a double three Elliottwave structure where Minor wave W ended at 121.59 and Minor wave X bounce is in progress.

The subwaves of Minor W looks to be in a zigzag Elliott wave structure, and if the subwaves of Minor Y later also takes the form of a zigzag, then this is a special structure of a double three where the subwave of both wave W and Y unfolds as a zigzag and we can call this structure a double zigzag. Near term, while Minor wave X bounce fails below 122.88 high, pair should turn lower in Minor wave Y of (2) towards 119.97 – 120.53 area before pair resumes the rally higher, provided that pivot at 118.18 low stays intact. We don’t like selling the proposed pullback and expect buyers to appear at above area for at least 3 waves bounce.

EURJPY 1 Hour Chart 03.15.2017


Elliottwave-Forecast

Master Trader
Feb 17, 2017
2,426
9
84
www.elliottwave-forecast.com
SPX Elliott Wave View: Buying the dips

4 Hour SPX Index Elliott wave chart 03.15.2017


Elliott Wave sequence analysis of SPX Index from 11/4/2016 low (2083.79) suggests the Index is rallying in a 5 swing bullish sequence and has not reached the 100% – 123.6% target area of 2453 – 2500. The structure of the rally is unfolding as a double three WXY Elliott wave structure or often called a 7 swing structure. Up from 2083.79, Intermediate wave (W) or third swing ended at 2277.53 and Intermediate wave (X) or fourth swing ended at 2257.02. The Index has since broken above 2277.53 and extended higher. SPX is currently in the 61.8 – 76.4 extension area (2378.75 – 2407.29) of the Intermediate wave (W) and wave (X) where fifth swing usually ends. The fifth swing or Minor wave W is proposed complete at 2400.98 within above area and a pullback in Minor wave X or the sixth swing is expected to take place to correct rally from 12/30/2016 low (2233.73).

We believe SPX correction lower is going to take place as RUT (Russell 2000) has already corrected lower and also showing incomplete sequence to the downside. When we look at Russell and other instrument in the market, the overall market correlation suggests SPX should pull back in Minor wave X. Once the pullback is over, then the Index should rally again towards new high at 2453 – 2500 area. We don’t like selling the Index and expect dip buyers to appear once Minor wave X pullback is complete for a new high or at least 3 waves bounce.

1 Hour SPX Index Elliott wave chart 03.15.2017


The 1 hour Elliott wave view above suggests that while the Index stays below wave ((x)) at 2376.86, it is expected to turn lower within Minute wave ((y)) towards 2319.3 – 2330.33 area to end Minor wave X pullback. In the above mentioned area, the Index is expected to find buyers and would have a chance to extend rally in 7th swing to a new high towards 2453 – 2500 area or at least bounce in 3 waves. If Russell does a FLAT from 3/9 low, then SPX could still see 2380 – 2385 area to complete wave ((x)) as a FLAT before making the next push lower to complete wave X pull back. We do not like selling the proposed pullback as the Elliott wave sequence in the higher degree from 11/4/2016 low remains bullish and prefer to use the dips as a buying opportunity at extreme areas.

1 Hour SPX Index Chart with FLAT wave ((x)) 03.15.2017
 

Elliottwave-Forecast

Master Trader
Feb 17, 2017
2,426
9
84
www.elliottwave-forecast.com
EURJPY Elliott Wave View: Pullback ended

Short term Elliott Wave view in EURJPY suggests that the decline to 118.18 on 2/24 ended Primary wave ((4)). Primary wave ((5)) is currently in progress higher and the rally from Primary wave ((4)) low at 118.18 is unfolding as an ending diagonal Elliott wave structure where Intermediate wave (1) ended at 122.88. The subwaves of Intermediate wave (1) takes the form of a zigzag Elliott wave structure where Minor wave A ended at 121.19, Minor wave B ended at 119.97, and Minor wave C of (1) ended at 122.88.

Intermediate wave (2) pullback is unfolding as as a double three structure where Minor wave W ended at 121.59, Minor wave X ended at 122.06 and Minor wave Y of of (2) is proposed complete at 121.16. While pullbacks stay above there, and more importantly above 118.18, expect pair to resume the rally higher, provided that pivot at 118.18 stays intact. If pair breaks below 121.16 here, then it’s still within Minor wave Y of (2) and can open extension lower towards 120.45 – 120.75 area before pair turns higher again. We don’t like selling the proposed pullback and favor the longside as long as pivot at 118.18 low stays intact.

EURJPY 1 Hour Chart 03.16.2017


Elliottwave-Forecast

Master Trader
Feb 17, 2017
2,426
9
84
www.elliottwave-forecast.com
EURJPY Elliott Wave View: Correction in progress

Short term Elliott Wave view in EURJPY suggests that the decline to 118.18 on 2/24 ended Primary wave ((4)). Primary wave ((5)) is currently in progress higher and the rally from Primary wave ((4)) low at 118.18 is unfolding as an ending diagonal Elliott wave structure where Intermediate wave (1) ended at 122.88. The subwaves of Intermediate wave (1) takes the form of a zigzag Elliott wave structure where Minor wave A ended at 121.19, Minor wave B ended at 119.97, and Minor wave C of (1) ended at 122.88.


Revised view suggests that Intermediate wave (2) pullback is still in progress in 7 swing or a double three structure where Minor wave W ended at 121.087. While Minor wave X bounce fails below 122.88, pair has scope to turn lower one more leg in Minor wave Y of (2) towards 119.27 – 120.52 area before the rally resumes. We don’t like selling the proposed pullback and expect buyers appear at 119.27 – 120.52 area for an extension higher or at least 3 waves bounce as far as pivot at 118.18 low stays intact. If pair breaks above 122.88 from here, that will suggest that Intermediate wave (2) has ended at 121.087 and pair has resumed the rally higher.

EURJPY 1 Hour Chart 03.17.2017


Elliottwave-Forecast

Master Trader
Feb 17, 2017
2,426
9
84
www.elliottwave-forecast.com
AUDUSD Elliott Wave View : 5 waves move

AUDUSD ended the correction in Intermediate wave (X) after reaching 0.7486 and then started rallying from there. With today’s new high the pair is showing 5 waves impulsive move from 03/09/2017 low and has already reached the minimum target area for Minutte wave (v) to end. The minimum target for Minutte wave (v) can be calculated as the inverse 1.236-1.618 Fibonacci extension of Minutte wave (iv) which comes at 0.7734 – .07753. Short term, an extension higher can’t be ruled out as there are still 2 other methods for calculating the 5th wave and one method of calculating (v) = (i) gives us a higher target around the equal legs area at 0.7765 – 0.7790. However, we need to be aware that cycle from 3/9 low (0.7486) is mature and pair can complete Minute wave ((a)) any moment and then start Minute wave ((b)) pullback in 3 , 7 or 11 swing to correct cycle from 3/9 low. After ending at least 3 waves pullback in Minute wave ((b)), we expect AUDUSD to find buyers for the next leg higher as it has a bullish sequence from December 2016 low due to breaking above 02/23/2017 high (0.7740).

AUDUSD 1 H Chart


Elliottwave-Forecast

Master Trader
Feb 17, 2017
2,426
9
84
www.elliottwave-forecast.com
USDJPY Elliott wave View: Ending impulse

Short term Elliott Wave view in USDJPY suggests that rally to 115.48 on 3/10 ended Intermediate wave (X). Decline from there is unfolding as a zigzag Elliott wave structure in which the first leg wave A is subdivided in 5 impulsive waves. Down from 3/10 high, Minute wave ((i)) ended at 114.46, Minute wave ((ii)) ended at 115.195, Minute wave ((iii)) ended at 112.88 and Minute wave ((iv)) ended at 113.56. Cycle from 3/10 high is mature and Primary wave A has enough extension to be called complete, but more downside towards 111.56 – 111.95 area can’t be ruled out to complete Primary wave A. Afterwards, pair should bounce in Primary wave B in 3, 7, or 11 swing to correct cycle from 3/10 high before the decline resumes. A break above proposed Minutte wave (iv) at 112.9 may be an early indication that Primary wave A has ended.

USDJPY 1 Hour Chart 03.21.2017


Elliottwave-Forecast

Master Trader
Feb 17, 2017
2,426
9
84
www.elliottwave-forecast.com
USDJPY Elliott wave View: Near bounce


Short term Elliott Wave view in USDJPY suggests that rally to 115.48 on 3/10 ended Intermediate wave (X). Decline from there is unfolding as a zigzag Elliott wave structure in which the first leg Minor wave A is subdivided in 5 impulsive waves. Down from 3/10 high, Minute wave ((i)) ended at 114.46, Minute wave ((ii)) ended at 115.195, Minute wave ((iii)) ended at 112.88 and Minute wave ((iv)) ended at 113.56. Cycle from 3/10 high is mature and Minor wave A has enough extension to be called complete, but more downside towards 110.088 – 111.12 area can’t be ruled out to complete Minor wave A. Afterwards, pair should bounce in Minor wave B in 3, 7, or 11 swing to correct cycle from 3/10 high before the decline resumes. We do not like buying the proposed bounce in Minor wave B and expect sellers to appear when Minor wave B bounce is done in 3, 7, or 11 swing later for another extension lower.

USDJPY 1 Hour Chart 03.22.2017


Elliottwave-Forecast

Master Trader
Feb 17, 2017
2,426
9
84
www.elliottwave-forecast.com
USDJPY Elliott wave View: Mature cycle

Short term Elliott Wave view in USDJPY suggests that rally to 115.48 on 3/10 ended Intermediate wave (X). Decline from there is unfolding as a zigzag Elliott wave structure in which the first leg Minor wave A is subdivided in 5 impulsive waves. Down from 3/10 high, Minute wave ((i)) ended at 114.46, Minute wave ((ii)) ended at 115.195, Minute wave ((iii)) ended at 110.71 and Minute wave ((iv)) is proposed complete at 111.59. Cycle from 3/10 high is mature and Minor wave A has enough extension to be called complete, but a marginal low towards 100 – 110.5 area can’t be ruled out to complete Minor wave A. Afterwards, pair should bounce in Minor wave B in 3, 7, or 11 swing to correct cycle from 3/10 high before the decline resumes. We do not like buying the proposed bounce in Minor wave B and expect sellers to appear when Minor wave B bounce is over in 3, 7, or 11 swing later for another extension lower.

USDJPY 1 Hour Chart 03.23.2017


Elliottwave-Forecast

Master Trader
Feb 17, 2017
2,426
9
84
www.elliottwave-forecast.com
USDJPY Elliott wave View: More downside

We are taking the more aggressive view in USDJPY and calling the rally to 115.48 on 3/10 as Intermediate wave (B). Decline from there is unfolding as a 5 waves impulse Elliott wave structure with an extension in wave 3. Down from 115.48, Minor wave 1 ended at 114.46 and Minor wave 2 ended at 115.2. Minor wave 3 is extended and further subdivided into 5 impulse waves where Minute wave ((i)) ended at 114.49, Minute wave ((ii)) ended at 114.82 and Minute wave ((iii)) is proposed complete at 110.714. Minute wave ((iv)) currently is in progress as a Flat Elliott Wave structure towards 111.7 – 112.3 area before pair turns lower in Minute wave ((v)) of 3. Afterwards, pair should bounce in Minor wave 4 and later on still see further downside to complete Minor wave 5 towards as low as 106.85 – 108.5 area. Bounces therefore are expected to be limited and shallow.

If current bounce is getting too big, then as an alternate, the move lower in USDJPY from 115.52 high is unfolding as a zig zag Elliottwave structure where Minor wave A ended at 110.58 low with subdivision of 5 impulsive waves . Current bounce will then be Minor wave B to correct decline from 3/10 high (115.52) before pair resumes lower again in Minor C. This alternate view is the less aggressive view but still calling for more downside in the pair as far as pair stays below 3/10 high. In both views (aggressive and less aggressive), we don’t like buying the pair.

1 Hour USDJPY Elliott Wave Chart 03.24.2017


Elliottwave-Forecast

Master Trader
Feb 17, 2017
2,426
9
84
www.elliottwave-forecast.com
AUDUSD Elliott Wave View: Pullback in progress

AUDUSD is showing 5 swings sequence from 12/23/2017 low after it managed to break above 02/23 peak so the sequence is bullish against Intermediate wave (X) low (0.7487). The pair did 5 waves impulsive move from 03/09 low in Minute wave ((a)) which ended at 03/23 peak (0.7749) and currently doing Minute wave ((b)) pullback that’s unfolding as a double three structure. We expect Minute wave ((b)) to complete in the blue box equal legs area (0.7571 – 0.7544) where AUDUSD can resume the rally for new highs or bounce in 3 waves at least. If the pair manage to get above (0.7683) high before reaching the inflection area then there is a chance that Minute wave ((b)) ended and the next leg to the upside started already. We don’t like selling the pair and expect buyers to appear in above mentioned area for new highs above wave ((a)) or a 3 wave bounce at least.

AUDUSD 1 H Chart


sinatraforex

Trader
Jan 12, 2017
7
0
17
www.learnforexmentor.com
USDJPY Elliott wave View: More downside


1 Hour USDJPY Elliott Wave Chart 03.24.2017

Hey nice to see another Elliott wave trader. Your count above seems to lack proportionality, your red wave i is too small for the red wave vi.
Also your black wave ((i)) is too small for that black wave ((iii))
what do you think about this counts below
count A
Screenshot_2.png

Or this one
count B
Screenshot_6.png
 

Elliottwave-Forecast

Master Trader
Feb 17, 2017
2,426
9
84
www.elliottwave-forecast.com
Hey nice to see another Elliott wave trader. Your count above seems to lack proportionality, your red wave i is too small for the red wave vi.
Also your black wave ((i)) is too small for that black wave ((iii))
what do you think about this counts below

Hey , we use EW in a different way , the labels won't matter that much as it could be changed in a matter of a seconds. The more important for us is understanding cycles & sequences and be able to correlate it with the rest of the market.

So for USDJPY your charts can be right and we are only presenting the more aggressive path calling fore more extension lower even we are aware that it can end wave A around these levels and start a wave B bounce.