Hello fellow traders. In this technical blog we’re going to take a quick look at the Elliott Wave charts of NZDUSD. As our members know, NZDUSD is showing incomplete bearish sequences in the cycle from the February 2021 peak. Recently the pair gave us 3 waves bounce against the 0.7217 peak. Recovery unfolded as Elliott Wave Zig Zag pattern ABC. Once the price reached equal legs A-B sellers appeared and we got the turn lower. In the further text we are going to explain the Elliott Wave Pattern and the Forecast.
Before we take a look at the real market example, let’s explain Elliott Wave Zigzag pattern.
Elliott Wave Zigzag is the most popular corrective pattern in Elliott Wave theory . It’s made of 3 swings which have 5-3-5 inner structure. Inner swings are labeled as A,B,C where A =5 waves, B=3 waves and C=5 waves. That means A and C can be either impulsive waves or diagonals. (Leading Diagonal in case of wave A or Ending in case of wave C) . Waves A and C must meet all conditions of being 5 wave structure, such as: having RSI divergency between wave subdivisions, ideal Fibonacci extensions and ideal retracements.
NZDUSD H4 Elliott Wave Analysis 01.12.2022
NZDUSD is correcting the cycle from the 0.72174 peak. Recovery looks incomplete at the moment. So far we got 5 waves up from the lows, which is uggesting we have ended only first leg of potential Elliott Wave Zig Zag Pattern . Consequently we are calling for another leg up toward 0.6892 + area to complete (B) blue recovery as Elliott Wave Zig Zag pattern. Proposed leg up which should be also made out of 5 waves.We don’t recommend buying the pair and favor the short side from higher levels once (B) recovery reaches its extremes. ( blue box)
As our members know Blue Boxes are no enemy areas , giving us 85% chance to get a pull back.
You can learn more about Zig Zag Elliott Wave Patterns at our Free Elliott Wave Educational Web Page.
NZDUSD H4 Elliott Wave Analysis 01.12.2022
The price almost reached equal legs area at 0.6892 ( blue box) and made turn lower from there. Entry zone was missed by a few pips. At this stage we are calling recovery completed at 0.68912 high. Now we would like to see further extension down and break below (A) blue low – 12/15 low which would be confirmation wave (C) is in progress.
Keep in mind market is dynamic and presented view could have changed in the mean time. You can check most recent charts in the membership area of the site. Best instruments to trade are those having incomplete bullish or bearish swings sequences.We put them in Sequence Report and best among them are shown in the Live Trading Room.
Energy Fuels is the largest US miner of the uranium. It produces the uranium both in form of triuranium octoxide and uranium hexafluoride. Besides the core business, the secondary products of Energy Fuels are rare earth elements and vanadium. Founded in 2006, the company has its headquarters in Lakewood, Colorado. One can trade it under the ticker $UUUU at the New York Stock Exchange. Investors in shares of the mining company are participating, therefore, in the company success story on the one hand and in the price development of the uranium commodity on the other.
Currently, we see the ongoing price appreciation within the energy commodities like oil, gas, coal and others. Consequently, uranium is expected to turn higher after 13 years of weak prices as well. Besides the market correlation in the energy group, the pattern of $UUUU shows a turn higher after 13 years of depressed prices as well. We have discussed the impulsive bullish behavior in the initial article from March 2021. Now, investors in the energy sector obtain a second chance to enter the uranium mining industry while buying a pullback in the largest uranium mining company of US.
Energy Fuels Weekly Elliott Wave Analysis 01.24.2022
The weekly chart below shows the Energy Fuels shares $UUUU traded at NYSE. First, the stock price has developed a cycle higher in black wave ((I)) of grand super cycle degree. It has printed the all-time highs on April 2007 at 240.61. From the highs, a correction lower in black wave ((II)) has unfolded as an Elliott wave zigzag pattern. It has printed an important bottom on March 2020 at 0.78.
From March 2020 lows, a new cycle in wave ((III)) has already started and should extend towards 240.61 highs and beyond. Then, the target for wave ((III)) will be towards 242.03-391.07 area and even higher.
Energy Fuels Daily Elliott Wave Analysis 01.24.2022
The Daily chart below shows the $UUUU shares price action in more detail. The stock can be in the early stages of the blue wave (I) of the black wave ((III)). First, the cycle higher from March 2020 in red wave I of blue wave (I) has ended in November 2021 at 11.39 highs. From the peak, a correction in wave II is unfolding as a zigzag structure. After ending ((A)) and ((B)), it is currently within wave ((C)). The 3rd leg lower has been confirmed. Now, it can reach towards 4.81-1.97 area. There, buyers can enter the market for a rally in wave III or for a bounce in 3 waves as minimum. The target for wave III of (I) will be towards 11.39 highs and even higher.
Can $TLT Bounce Again To Correct The Cycle From the March 2020 Highs?
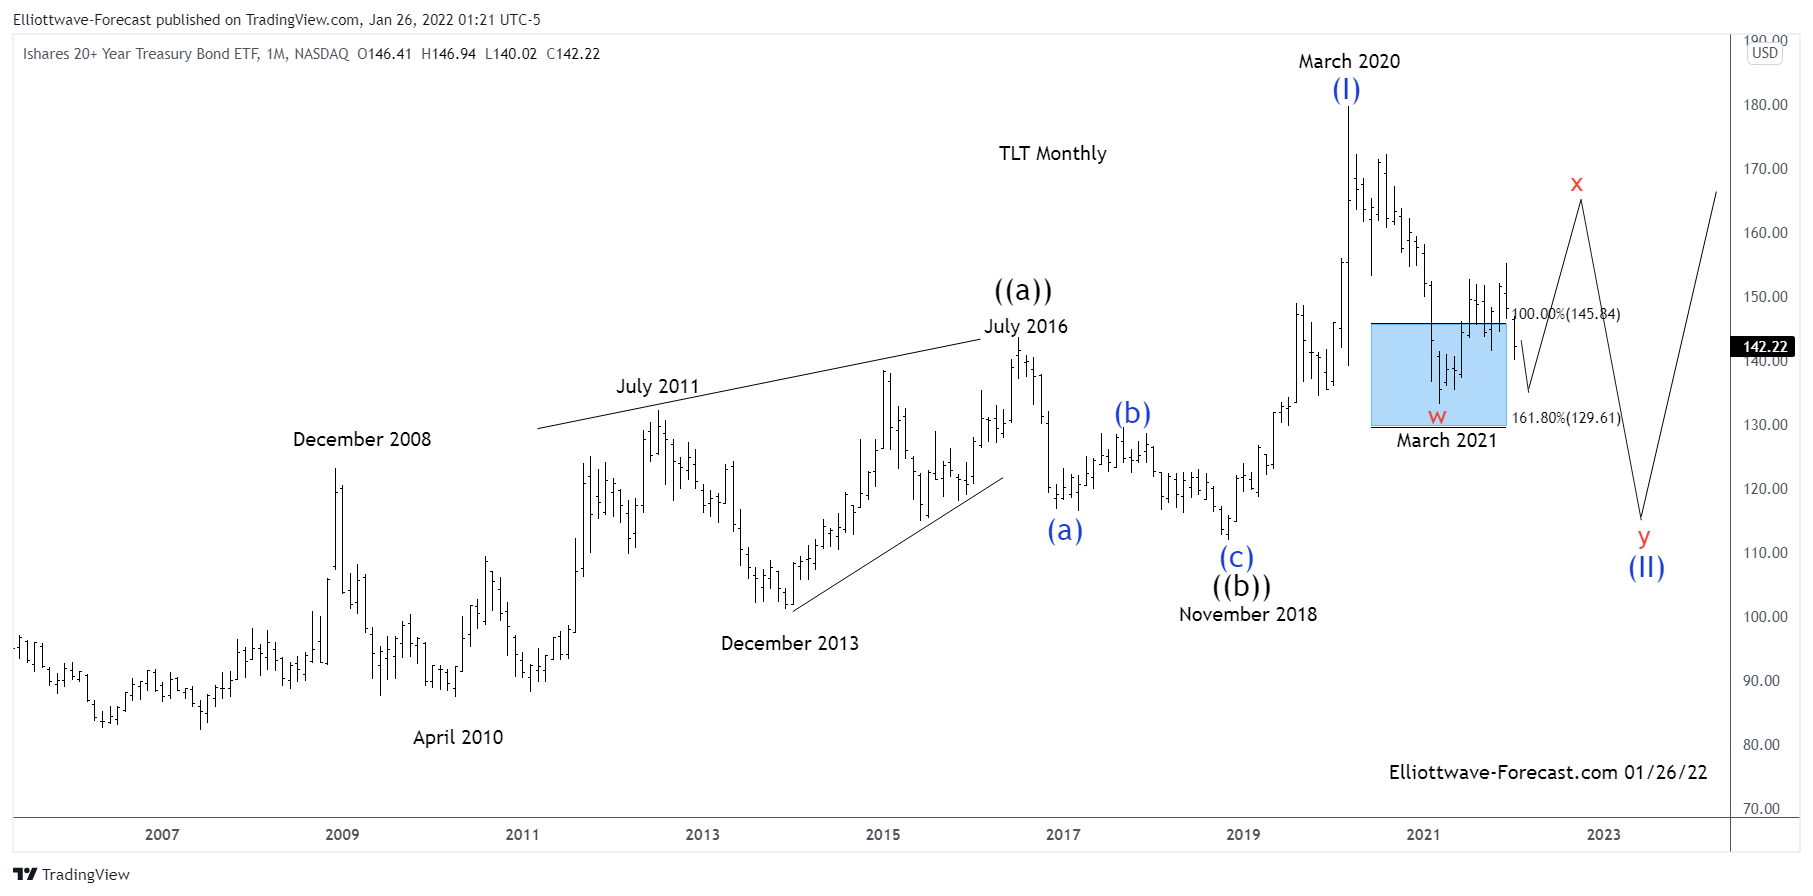
Firstly the ETF fund TLT inception date was on July 22, 2002. This instrument seeks to track the investment results of an index composed of or in U.S. Treasury bonds with maturities twenty years or more remaining. There is a lack of data before July 22, 2002. This article will focus on the larger uptrend cycle from there which is presumed finished a cycle higher from those lows in wave ((a)) in July 2016. The pullback from that high appeared to be an Elliott wave zig zag structure in three waves into the November 2018 wave ((b)) lows.
Secondly: The aforementioned pullback lower in the wave ((b)) was strong enough to suggest it was correcting the cycle up from the all time lows. Thus it appears ended that cycle. From those November 2018 lows the instrument has made another high above the July 2016 highs creating a bullish sequence. This sequence higher from the November 2018 lows appears to be incomplete. On the monthly chart shown below, Elliott wave corrective sequences are in either three, seven or eleven swings. Impulses are in either five, nine or thirteen swings. It is obvious the three swings lower from the July 2016 highs into the November 2018 lows were of three swings.
The analysis continues and concludes below the Monthly chart.
Thirdly and in conclusion the cycle up from the November 2018 lows ended at the March 2020 highs. Down from there a three swing cycle ended at the March 2021 lows. While a pullback remains above there it can see another swing higher to correct the cycle lower from the March 2020 highs. Afterward it can see another swing lower to correct the cycle up from the November 2018 lows.
Chewy.com is an e-commerce company that specializes in pet food. Along with many other stocks, prices started a new cycle higher in March 2020. Chewy is now correcting that cycle. Lets take a look at the company profile and see what they do:
"Chewy, Inc. is an American online retailer of pet food and other pet-related products based in Dania Beach, Florida. In 2017, Chewy was acquired by PetSmart for $3.35 billion, which was the largest ever acquisition of an e-commerce business at the time. The company completed its initial public offering in 2019, raising $1 billion.
Following the acquisition, Cohen remained CEO and operated the business largely as an independent unit of PetSmart. Between 2017 and 2018, Chewy’s sales increased from $2.1 billion to $3.5 billion, with 66% of sales coming from customers signed up for automatic recurring shipments. In 2018, Chewy created Chewy Pharmacy, an online pharmacy providing pet-targeted prescription medications. Orders placed through the business are completed in coordination with a team of in-house veterinarians."
Lets dig into the charts!
Chewy Elliottwave View:
As mentioned above, this stock made a new all time low in March 2020. After that, a new cycle higher has been established. From the all time low @ 20.54, the stock has rallied in 5 waves and peaked in February of 2021. Medium term term view from Feb 2021 peak set @ 120.00 . The pullback since the peak nearly a year ago, has been a fairly clean pullback. There is a clear 5 waves down into ((A)), bounce in ((B)). As a result, the stock is declining in the final leg before a larger bounce may take place. Currently, the momentum is suggesting that blue (3) and (4) still are needing to take place before a low can materialize.
It should be noted that there is a blue box that is present, from the 41.92 to invalidation level at 20.54. The blue boxes are areas where algos and buyers typically enter for a bounce.
In conclusion, prices absolutely have to stay above 20.54 low. Should that low get violated, then the stock would be back at all time lows erasing the rally from the March 2020 cycle low.
In this technical blog, we will look at the past performance of 4 hour Elliott Wave Charts of USDSEK. In which, the rally from 07 June 2021 low unfolded as an impulse sequence and showed a higher high sequence. Therefore, we knew that the structure in USDSEK is incomplete to the upside & should see another leg higher to complete the impulse rally. So, we advised members not to sell the pair & buy the dips in 3, 7, or 11 swings at the blue box areas. We will explain the structure & forecast below:
USDSEK 4 Hour Elliott Wave Chart
Here’s 4hr Elliott wave Chart from the 1/13/2022 update. In which, the rally to $9.1859 high ended 5 waves from 10/29/2021 low in wave (3) & made a pullback in wave (4). The internals of that pullback unfolded as Elliott wave flat correction where wave A ended in 3 swings at $9.0025 low. Then a bounce to $9.1494 high ended wave B & started the next leg lower in wave C towards $8.9678- $8.8547 blue box area. From there, buyers were expected to appear looking for new highs ideally or for a 3 wave bounce minimum.
USDSEK Latest 4 Hour Elliott Wave Chart
This is the latest 4hr Elliott wave Chart from the 1/27/2022 update. In which the pair is showing a strong reaction higher taking place, right after ending the flat correction within the blue box area. Allowed members to create a risk-free position shortly after taking the long position at the blue box area.
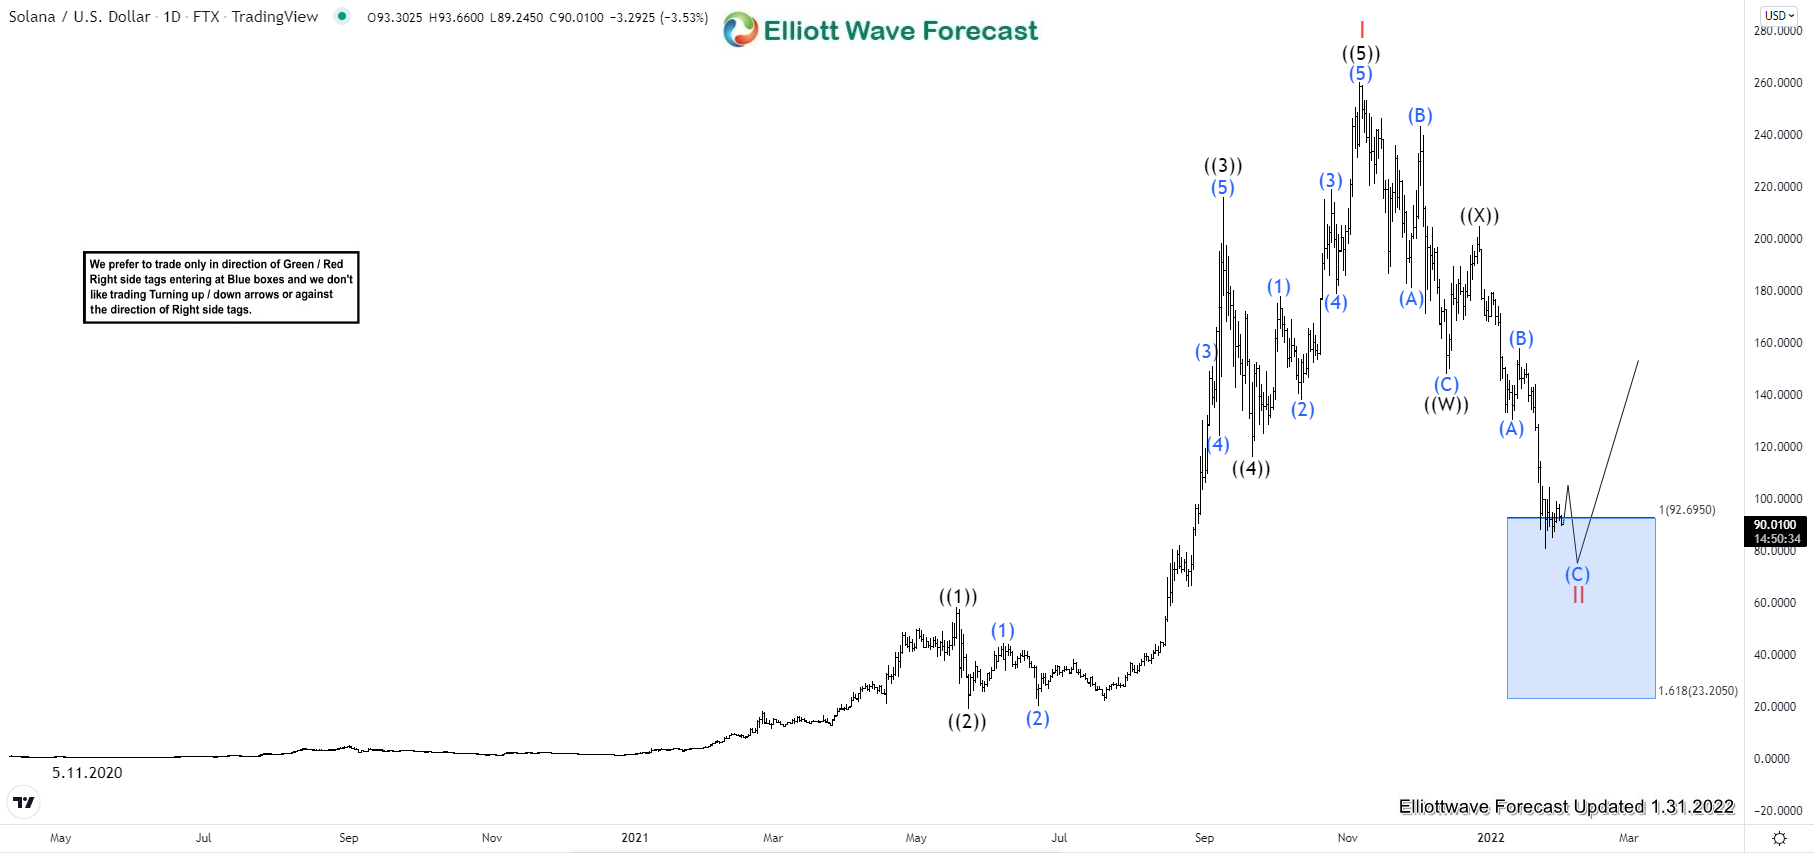
Solana (SOLUSD - FTX) is a very popular cryptocurrency having 7th rank by market cap of around $28 B at current price of $90.05. Solana is a highly functional open source project that banks on blockchain technology’s permissionless nature to provide decentralized finance solutions.
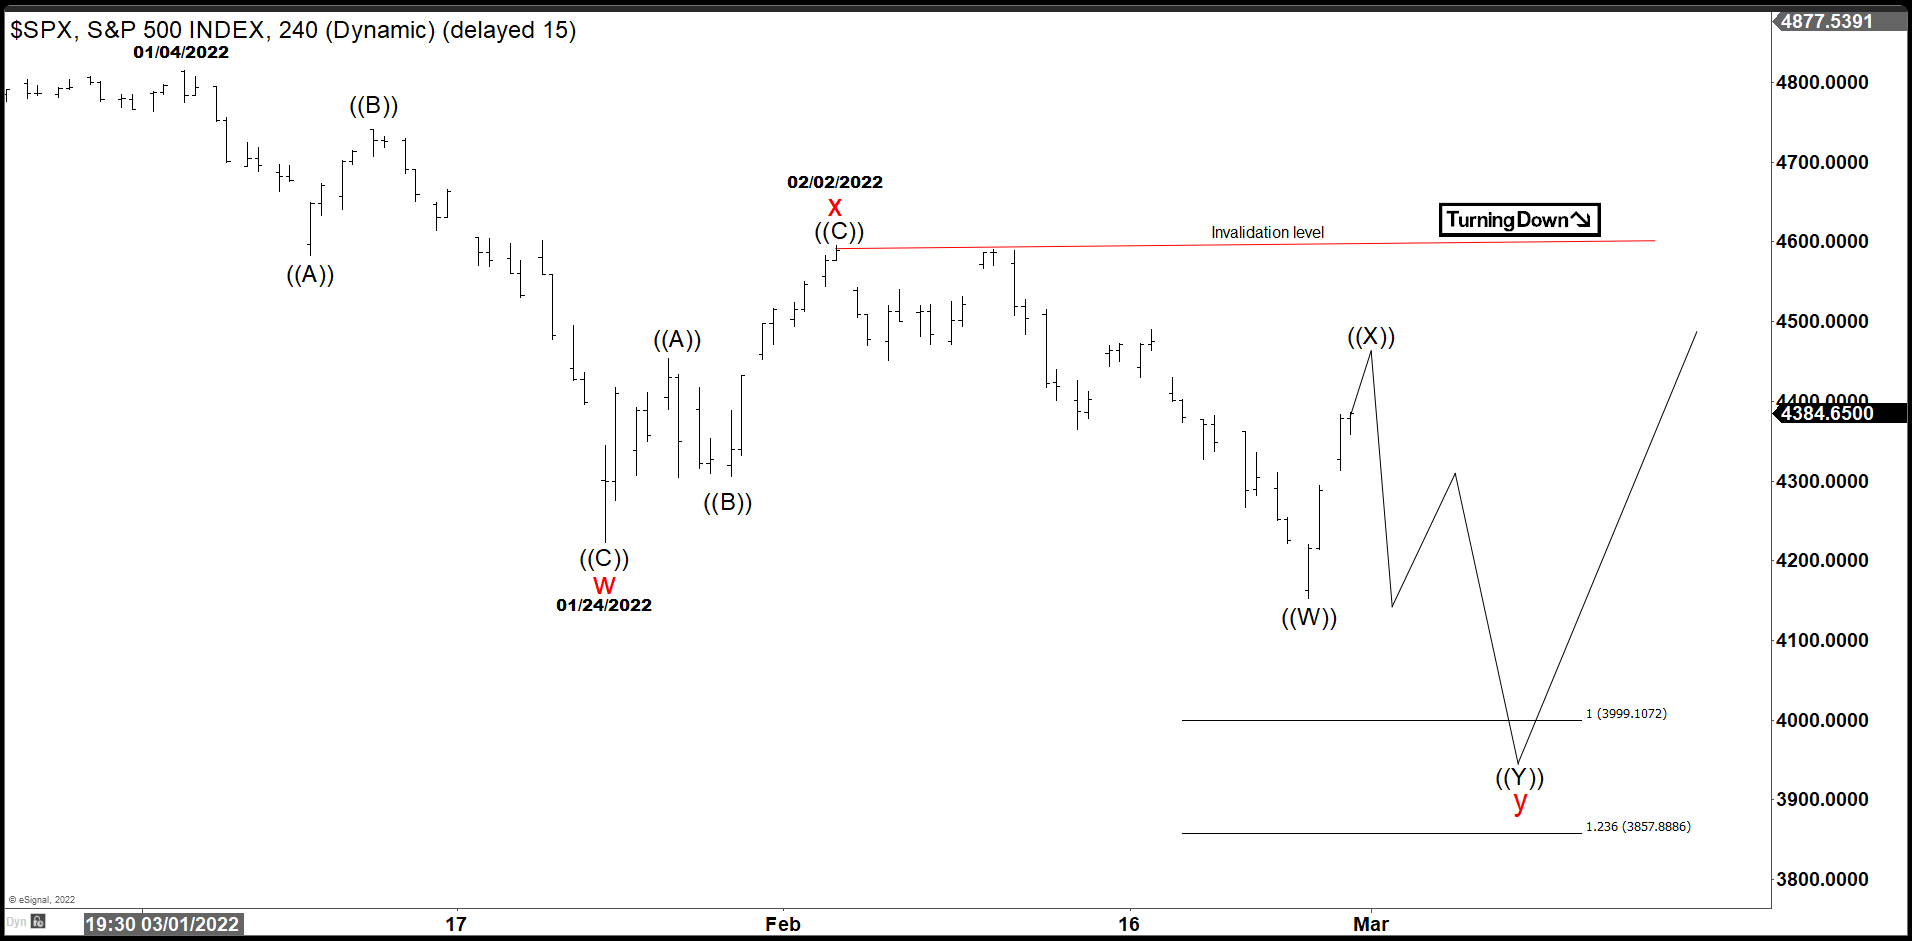
SOLUSD started in early 2020. It made initially the low of $0.5050 on 5/11/2020. It traded sideways to higher in 2020 & gain huge momentum in 2021. It go to ATH of $259.99 on 11/06/2021 as I red impulse cycle started from May-2020 low. While below there, it started correcting lower in in proposed double correction.
SOLUSD - Elliott Wave Latest Daily View:
It favored ended ((1)) at $58.39 high on 5/18/2021 as impulse started from May-2020 low. Below there, it corrected in ((2)) at $19.11 low on 5/23/2021 as 0.618 retracement of previous cycle. It gained huge momentum in ((3)) & favored ended at $216 high on 9/9/2021 as third wave extension. It corrected in ((4)) at $115.88 low on 9/21/2021. Finally, it made a new ATH at $259.99 on 11/06/2021 & finished impulse cycle as I red.
While below $259.99 high, it started correcting lower in double correction against the cycle from May-2020 low. It placed ((W)) at $147.94 low on 12/13/2021 & ((X)) at $204.88 high on 12/27/2021. Below ((X)), it proposed ended (A) at $130 and (B) at 157.87 high. Currently, it favors lower in (C) of ((Y)) & expect two more lows to end the cycle between $92.69 - $23.20 area before turning higher. We would like to buy it in extreme areas for next leg higher or at least 3 swing bounce.
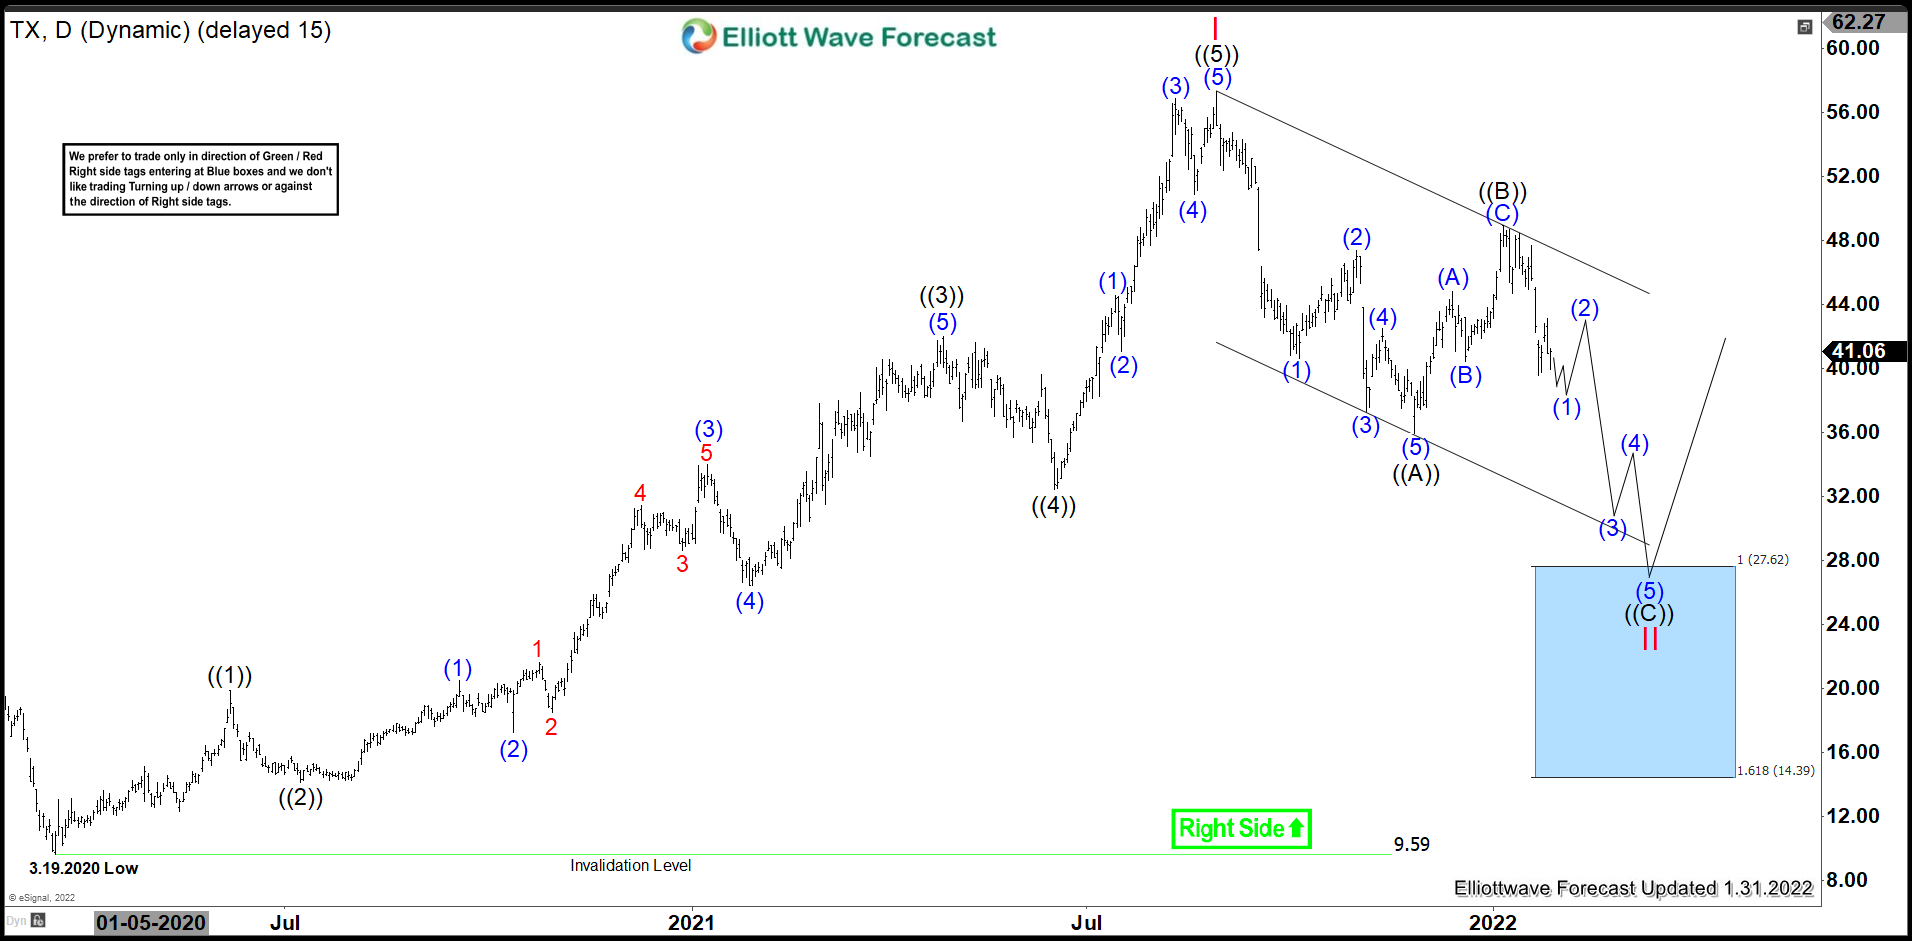
Ternium S.A. (TX) through its subsidiaries, manufactures & processes various steel products in Mexico, Brazil, US & other countries. It operates through two segments, Steel & Mining. The company founded in 1961 & based in Luxembourg. It comes under Basic materials sector & trades as ‘TX’ ticker at NYSE.
Since December-2010 high, TX made low at $9.59 on 3/19/2020 during global sell off early last year. Then it started higher high sequence & made ATH at $57.35 on 8/30/2021 as clear impulse sequence. While below there it started correcting lower in proposed zigzag structure.
TX - Elliott Wave Latest Daily View:
It favored ended ((1)) at $19.89 high on 6/08/2020 against the cycle from 3/19/2020 low. Below there, it placed ((2)) at $14.12 low as slightly below 0.5 retracement against ((1)). Then it started third wave extension & favored ended at $41.98 high on 4/28/2021. Wave ((3)) was 2.618 Fibonacci extension of wave ((1)). It proposed ended ((4)) at $32.46 low on 6/17/2021. While above there, it finally ended ((5)) at $57.35 high on 8/30/2021 as I red cycle & start correcting lower in II.
Below 8/30/2021 high, it placed ((A)) at $35.95 low & proposed ended ((B)) at $48.96 high on 1/06/2022. While bounce fails below $48.96 high, it expect to extend lower in ((C)) towards $27.62 - $14.39 area to end II correction. Currently, it favors lower in (1) of ((C)) & expect two more minor lows to end it before bounce in (2). We like to buy the next extreme areas in blue box for next cycle up or at least 3 swings bounce.
USDCAD is another instrument that has given us trading opportunity lately . Break of August 20th high made bullish sequence from the June 1st low. The price structure is suggesting further rally within that cycle. We recommended members to avoid selling the pair at this stage while favoring the long side. Recently the pair made clear 3 waves pull back and found buyers at the blue box as we expected. In this technical blog we’re going to take a quick look at the charts of USDCAD published in members area of the website and explain the Elliott Wave structure and trading strategy.
USDCAD Elliott Wave 4 Hour Chart 01.11.2022
Current view suggests USCAD is doing (B) blue correction. Pull back is showing incomplete lower low sequences, suggesting more downside toward blue box area : 1.247-1.2282 . As the main trend is bullish we expect buyers to appear at the blue box for 3 waves bounce at least. Strategy is the same as always, once bounce reaches 50 Fibs against the X red high, we will make long position risk free ( put SL at BE). Invalidation for the trade would be break of marked invalidation level 1.2282.
As our members know, Blue Boxes are no enemy areas , giving us 85% chance to get a bounce.
You can learn more about Elliott Wave Patterns at our Free Elliott Wave Educational Web Page.
USDCAD Elliott Wave 4 Hour Chart 01.15.2022
USDCAD has found buyers at the marked zone and we are getting reaction from there. Bounce is still shallow, but at this stage we already call (B) pull back completed at 1.2447. We are expecting to see further separation from the current low.
USDCAD Elliott Wave 4 Hour Chart 01.30.2022
The rally from the blue box reached and exceeded 50 fibs against the connector. Consequently members who have taken the long trades at the blue box now enjoying profits in a risk free trades. Now we would need to see break of (A) blue peak in order to confirm next leg up is in progress.
Keep in mind that market is dynamic and presented view could have changed in the mean time. You can check most recent charts in the membership area of the site. Best instruments to trade are those having incomplete bullish or bearish swings sequences. We put them in Sequence Report and best among them are shown in the Live Trading Room.
Elliott Wave Forecast
Source: https://elliottwave-forecast.com/trading/usdcad-buying-dips-blue-box/
Post automatically merged:
Ford Motor Company (commonly known as Ford) is an American multinational automobile manufacturer headquartered in Dearborn, Michigan, United States. It was founded by Henry Ford and incorporated on June 16, 1903. The company sells automobiles and commercial vehicles under the Ford brand, and luxury cars under its Lincoln luxury brand.
FORD Daily Chart
Ford started a rally from March 2020 low after covid19 crash. From there, we can see 5 waves up forming an Impulse Structure ending on December 13th 2021. (If you want to learn more about Elliott Wave Theory, please follow these links: Elliott Wave Education and Elliott Wave Theory). Wave ((1)) ended an impulse structure at 16.45. Then F corrected in 3 swings making a double fcorrection structure, ending wave ((2)) at 12.38. Another rally resumed from the low completing wave ((3)) at 21.49 and pullback again making a flat correction ended wave ((4)) at 19.05. Then last push higher made and ended the impulse structure and completed wave ((5)) and wave I of the leading diagonal at 25.87.
After peak, the stock dropped strongly losing more than 27% building an impulse structure. To complete the impulse, Ford needs to break 18.80 low to make 5 swings down which one we will labeled as wave ((A)). Then we should see a corrective bounce in 3 or 7 swings as wave ((B)) before turning lower again. This turn as wave ((C)) should build an impulse structure again, that means, 5 swings down are need to complete ((C)) and wave II. To conclude the whole correction as wave II we are suggesting a 15.00 – 16.00 area where Ford should continue with the rally.
Continental is a German multinational automotive parts manufacturing company. It is specializing in brake systems, interior electronics, tachographs, automotive safety, powertrain and chassis components, tires and other parts for the automotive and transportation industries. Founded in 1871 and headquartered in Hanover, Germany, Continental is a part of DAX40 index. From the all-time lows, the stock price is showing a series of nests. It is expected to accelerate higher towards the new all-time highs. In the initial article one year ago, we have forecasted the acceleration higher to happen. We were right. Now, a pullback provides an opportunity for even more upside.
The monthly chart below shows the Coninental stock $CON traded at XETRA. From the all-time lows, Continental has developed a cycle higher in black wave ((I)) of a grand super cycle degree. It has printed the the all-time highs on January 2018 at 228.89. Hereby, within the impulsive advance, all the subwaves (I), (III) and (V) are impulsive waves, too. Wave (III) demonstrates a clear extension in price.
From the January 2018 highs, a sharp correction in wave ((II)) has retraced more than 78.6% of the rise. It has unfolded as an Elliott wave zigzag pattern being 5-3-5 structure. Hereby, it has bottomed in March 2020 at 45.75. From there, the wave ((III)) might be in first stages and should break to the new all-time highs. The target higher for the wave ((III)) is the 1.0-1.618 extension of the wave ((I)) being 273.94-415.15 area and even higher.
The daily chart below shows the initial nest consisting of waves I and II. First, from the March 2020 lows at 45.75, a cycle higher in red wave I has unfolded as an impulse. It has printed its top in June 2021 at 117.99. Now, a correction lower in red wave II might be still in progress. While price is trading below 111.96 peak, $CON can still extend deeper into 83.75-66.22 area. There, based on our expectations, a reaction higher in the wave III should take place. While above 82.36, wave III might be already in progress. In that case, the target will be towards 1.0-1.618 extension of the wave I being 154.73-199.46 area and even beyond.
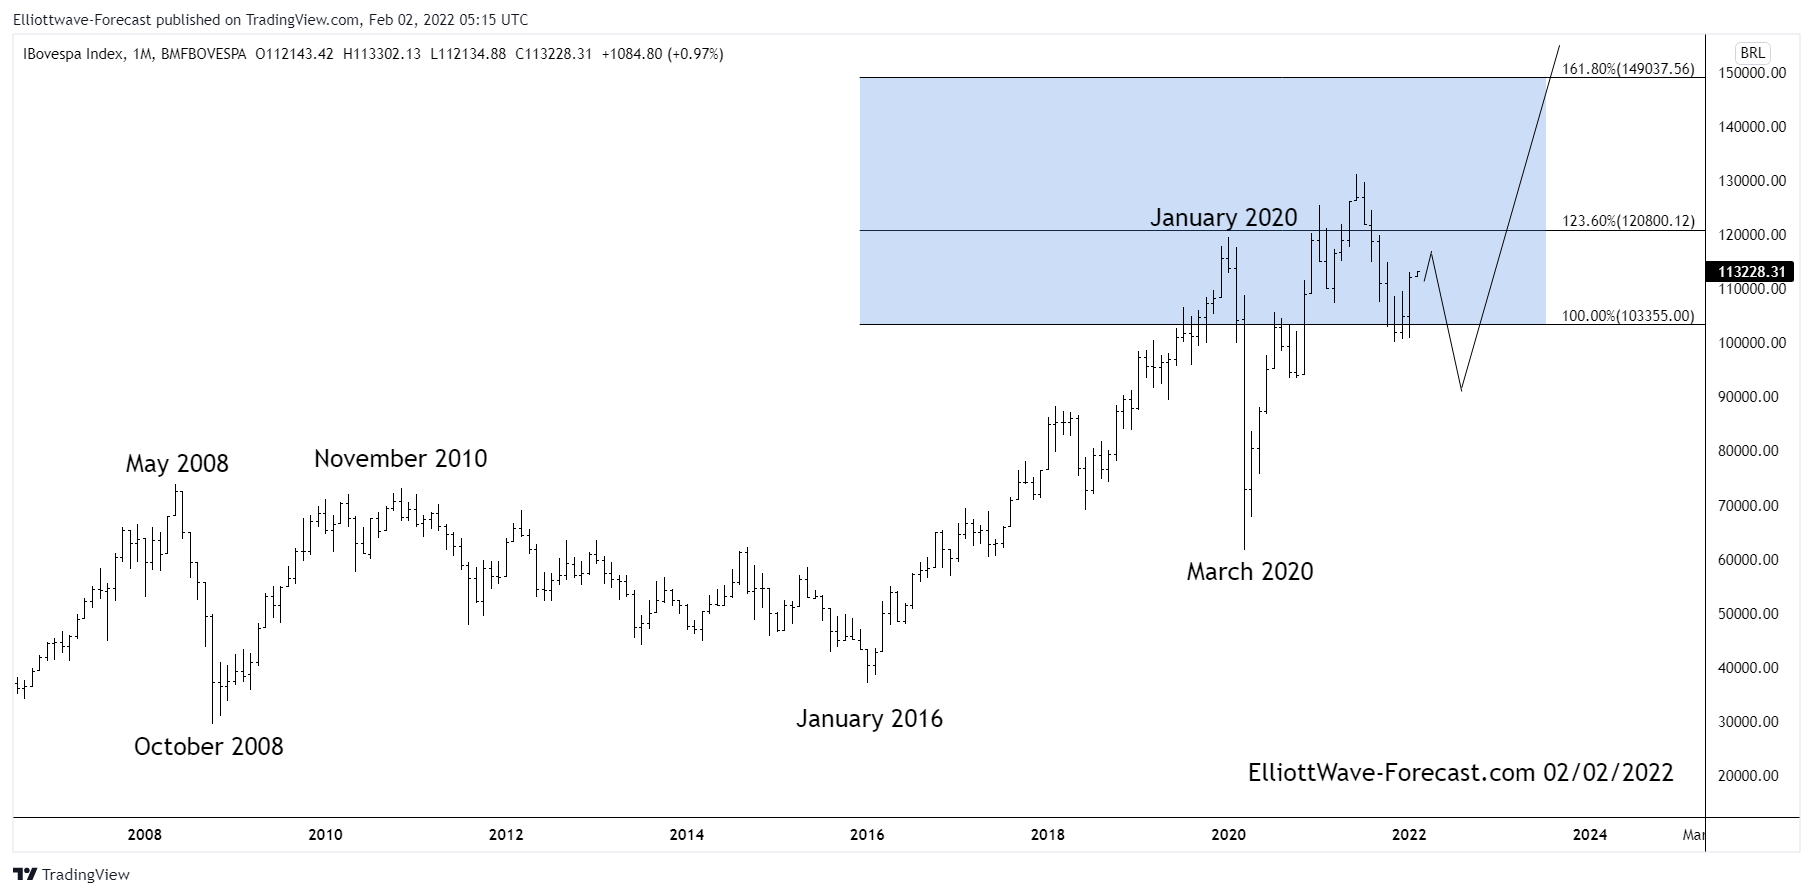
The Bovespa Index has been trending higher with other world indices. Since inception the cycles have shown a bullish trend. In early years not seen on this chart it rallied with other world indices trending higher into the May 2008 highs. It then corrected the whole bullish cycle from the beginning. That was while most other world indices were in a pullback lower. The index ended that larger degree correction in October 2008. At this point is where the index corrected the whole decades long bullish cycle. Thus the October 2008 lows is from where this bullish cycle and swing analysis will begin.
First from the October 2008 lows the index rose into the November 2010 highs in what appears as an Elliott Wave impulse. From there the index endured an almost 6 year long correction of that cycle into the January 2016 lows.
The analysis continues below the chart.
Secondly I want mention the blue box area that was reached in the cycle up into the January 2020 highs. This is Fibonacci extension measured from zero up to the May 2008 highs then back down to the October 2008 lows. This is a typical place for the next cycle higher in any degree to reach as it did in January 2020.
Thirdly and in conclusion. The pullback into the March 2020 lows was enough to suggest it was correcting the cycle from the 2008 lows. This was shared by other world indices and many others have already made new yearly highs in their bullish cycles. This emerging market index was no different and eventually did get back above the January 2020 highs. From the March 2020 lows the index appears to be an impulse when looked at in the lower time frames. There should be a bright future bullish outcome in the index while a pullback remains above the March 2020 lows.
The last time I looked at Workhorse was in August 2020, I was still expecting some further upside to take place. And after that, I was looking for a pullback correcting the whole cycle from the all time low. You can view this article here.
Lets take a look at the company profile:
"Workhorse Custom Chassis, LLC was founded in 1998 by investors who took over the production of General Motors' P30/P32 series stepvan and motorhome chassis. By 2005, they were taken over by Navistar International, which had been selling them diesel engines. Navistar then shuttered the plant in 2012 to cut costs after having suffered heavy losses.
In March 2013, AMP Electric Vehicles took over Workhorse Custom Chassis, LLC's assets and began offering a range of electric vehicles. In 2015, AMP changed its company name to Workhorse Group Incorporated. On January 4, 2016, the Company was approved by Nasdaq Capital Market and its common stock started being quoted on Nasdaq under the symbol “WKHS” (NASDAQ: WKHS).
In February 2019, Steve Burns, co-founder of AMP Electric Vehicles and CEO of Workhorse decided to resign from the company. President and COO Duane Hughes became the new CEO of Workhorse.
In November 2021 it was reported that Workhorse faced a Department of Justice investigation as well as a SEC investigation that was first reported in a September 2021 report by shortselling research firm Fuzzy Panda who accused the company of fraud which was followed up by a Cincinnati Enquirer report which found that top Workhorse executives and board members sold off $60 million worth of stock and that part of the selling occurred following interactions with postal officials which signaled their USPS bid was in trouble.
The report also stated that Workhorse was being sued by some shareholders in the company, which accuses them orchestrating its USPS as part of an insider trading scheme. On November 9, 2021, Workhorse confirmed it's SEC and Department of Justice investigations in a regulatory filling which stated that the investigations were related to the trade of securities in the company leading up to the award of the USPS contract to Oshkosh."
As you can see, the company faced some troubles in November 2021. Well what do the technicals say about the outlook? Lets take a look.
Workhorse Elliottwave View:
The all time low for Workhorse came in late 2018 at the 28 cents low. After that, a new cycle higher has been established. This cycle has momentum divergence at the Feb 2021 peak to give evidence that an impulse from the 2018 low has taken place. From that Red I peak set Feb 4/2021 @ 42.96, the stock has experienced a very deep correction. It has been a very technical correction so far. ((A)) and ((B)) have clear technicals to support that swing as the connector. From the ((B)) peak, Workhorse is now in another impulse lower for ((C)) of Red II. The stock is probing deep levels of price. Currently, at around the 3.00 level. The all time low is at 28 cents, as long as prices remain above that low, it is favoured that this pullback is a wave II before resuming higher in a Wave III.
In conclusion, as one can deduct, this stock is very volatile. It has already pulled back enough to almost erase the whole rally from the low. Further downside can still take place before the next cycle higher resumes. The equal leg blue box is not providing any good level due to the depth of the ((A)). It is also well below the 61.8 retrace which comes in at 16.63. Momentum on the recent Jan 24 low was very strong. And could be suggesting that the end of this correction could be close.
Hello fellow traders. Another instrument that has given us nice trading opportunity recently is NZDJPY . In this technical article we’re going to take a look at the past charts of NZDJPY presented in members area of the of our website. The pair is showing incomplete bearish sequences in the cycle from the 10/21 peak. Consequently we expect to see further decline within October cycle. Recently we got a short term recovery that has given us opportunity to enter short trades again. Recovery has unfolded as Elliott Wave Double Three Pattern. In further text we’re going to explain the Elliott Wave pattern and trading strategy.
Before we take a look at the real market example, let’s explain Elliott Wave Double Three pattern.
Elliott Wave Double Three Pattern
Double three is the common pattern in the market , also known as 7 swing structure. It’s a reliable pattern which is giving us good trading entries with clearly defined invalidation levels.
The picture below presents what Elliott Wave Double Three pattern looks like. It has (W),(X),(Y) labeling and 3,3,3 inner structure, which means all of these 3 legs are corrective sequences. Each (W) and (Y) are made of 3 swings , they’re having A,B,C structure in lower degree, or alternatively they can have W,X,Y labeling.
NZDJPY 1 Hour Elliott Wave Analysis 02.03.2021
NZDJPY is giving us (2) blue recovery that is unfolding as Elliott Wave Double Three Pattern. It’s having WXY inner labeling. We can see 3 waves up in W red leg. Then we got 3 waves bounce in X connector. Last leg up Y red is also counted as corrective structure - ((a)) ((b)) ((c)) Zig Zag pattern, when ((b)) was shallow pull back. Recovery has already reached the extremes at 76.65-77.31 , blue box area. At the marked blue box area, we expect sellers to appear and to pull price lower toward new lows ideally. As the main trend is bearish we expect to get at least 3 waves pull back from the selling zone. Once pull back reaches 50 Fibs against the X red connector, we will make short position risk free ( put SL at BE). Invalidation level for the trade is break above 1.618 fib extension (77.317).
You can learn more about Elliott WaveDouble Three and Zig Zag Patterns at our Free Elliott Wave Educational Web Page.
NZDJPY 1 Hour Elliott Wave Analysis 02.07.2021
Sellers appeared at the blue box area : 76.65-77.31 and we got good reaction from there. The decline from the blue box reached 50 fibs against the X connector, as a result members who took short positions should be enjoying profits in a Risk Free positions. At the moment we see wave (2) blue recovery completed at 76.78 high. Decline from that high high looks like unfolding as 5 waves - ((i)) and we expected to see bounce in ((ii)) before further decline ideally resumes .
NZDJPY 1 Hour Elliott Wave Analysis 02.07.2021
We got short term bounce ((ii)) as expected. As far as the price stays below 76.49 , next short term tech zone to the downside comes at 75.67-75.47. Key level for this view is at 76.78 peak. If that level gives up , the pair will make another 3 waves up within correction (2) blue.
Keep in mind that market is dynamic and presented view could have changed in the mean time. Not every chart is trading recommendation. You can check most recent charts and new trading setups in the membership area of the site. Best instruments to trade are those having incomplete bullish or bearish swings sequences. We put them in Sequence Report and best among them are shown in the Live Trading Room.
Caterpillar Inc. (often shortened to CAT) is an American Fortune 100 corporation that designs, develops, engineers, manufactures, markets, and sells machinery, engines, financial products, and insurance to customers via a worldwide dealer network. It is the world's largest construction-equipment manufacturer. Caterpillar stock is a component of the Dow Jones Industrial Average.
Caterpillar November 28th Daily Chart
At the beginning, we labeled an impulse structure from Jan 2016 low that ended at 173.24 in Jan 2018 as wave (I). Then Caterpillar made a pullback and built a zig zag structure ending wave (II) at 87.50 in March 2020 when the COVID pandemic spread worldwide.
A bounce appeared in that year and we started to develop wave (III). We could see in the chart above wave (III) structure that ended at 246.69 in May 2021. Thus, another pullback began making a double correction structure and we called wave (IV) ended at 186.98. From here, we were looking for a last impulse to break wave (III) peak and complete the impulse structure from 2016 as wave (V).
Caterpillar December 26th Daily Chart
After Christmas, we analyzed the world capital market and realized that it was close to make a major correction and it was better to forget about looking for wave (V) and rather, it was better to look for a continuation of wave (IV) with a more complex double correction. For this reason, we deleted the impulse forecast in Caterpillar and changed it to a double correction to complete wave X formed by waves ((W)), ((X)), and ((Y)). Using the Fibonacci tool, we suggested the 221.00 – 228.00 zone as a possible area where wave X should end and continue declining.
Caterpillar January 7th 2022 Daily Chart
The wave ((W)) ended at 216.47 then pullback wave ((X)) ended at 191.36. Wave ((Y)) started slow, but it moved strong high at the beginning of 2022.The internal structure in lesser degree was a flat correction (A), (B), (C), where wave (C) was an impulse. With this impulse we change the target in Caterpillar to complete wave X change it from 221.00 – 228.00 to 228.00 – 239.00 area. (If you want to learn more about Elliott Wave Theory, please follow these links: Elliott Wave Education and Elliott Wave Theory).
Caterpillar January 28th 2022 Daily Chart
Caterpillar continued higher ending wave ((Y)) and X at 230.96. Then we saw a reaction lower as expected and we should continue lower to break 186.98 and complete wave (IV). The possible area to complete wave (IV) comes in 170.00 – 184.00 and from there we should continue with the rally to complete wave (V).
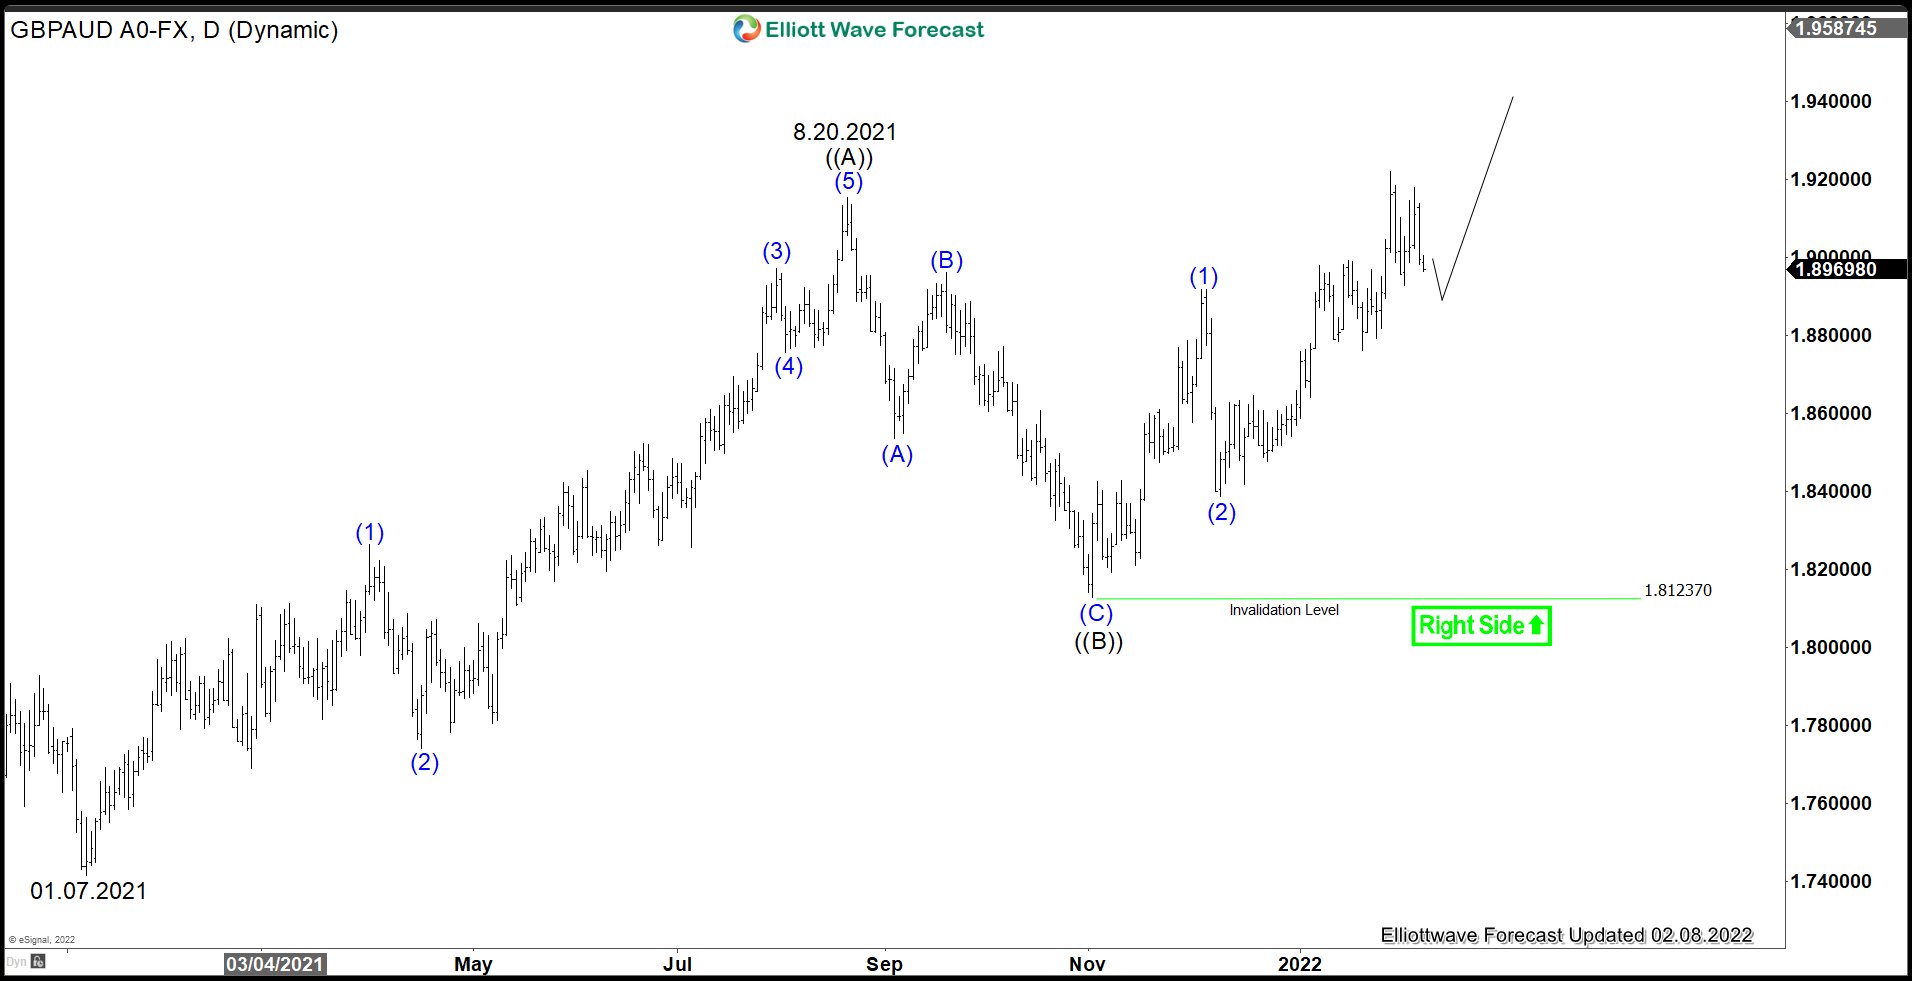
GBPAUD has found bid due to the divergence in the monetary policy between RBA and BOE. Bank of England (BOE) this year has hiked interest rate twice to fight against inflation. However, BOE indicates that it may still need to hike a few more times this year before it stops. This should take interest rates closer to 1% or even higher. Meanwhile, Reserve Bank of Australia (RBA) does not sound as hawkish as the other central banks. In the last monetary policy statement, the RBA has emphasized that the growth in workers' wage is significant in the UK and US. RBA has judged that wage growth of three percent or more will be necessary to deliver the bank's inflation target of 2.5%. In other words, RBA is not in a rush to raise the rate despite the current underlying inflation at the top of their target.
GBPAUD Daily Elliott Wave Chart
GBPAUD has broken above 08.20.2021 high (1.9154) and now the pair shows a higher high bullish sequence from December 11, 2020 low. The pair has potential target higher which can be calculated as 100% - 161.8% Fibonacci Extension from December 2020 low at 1.987 - 2.095. Near term pullback should find support in the sequence of 3, 7, or 11 swing for further upside as far as pivot at 1.8123 low stays intact.
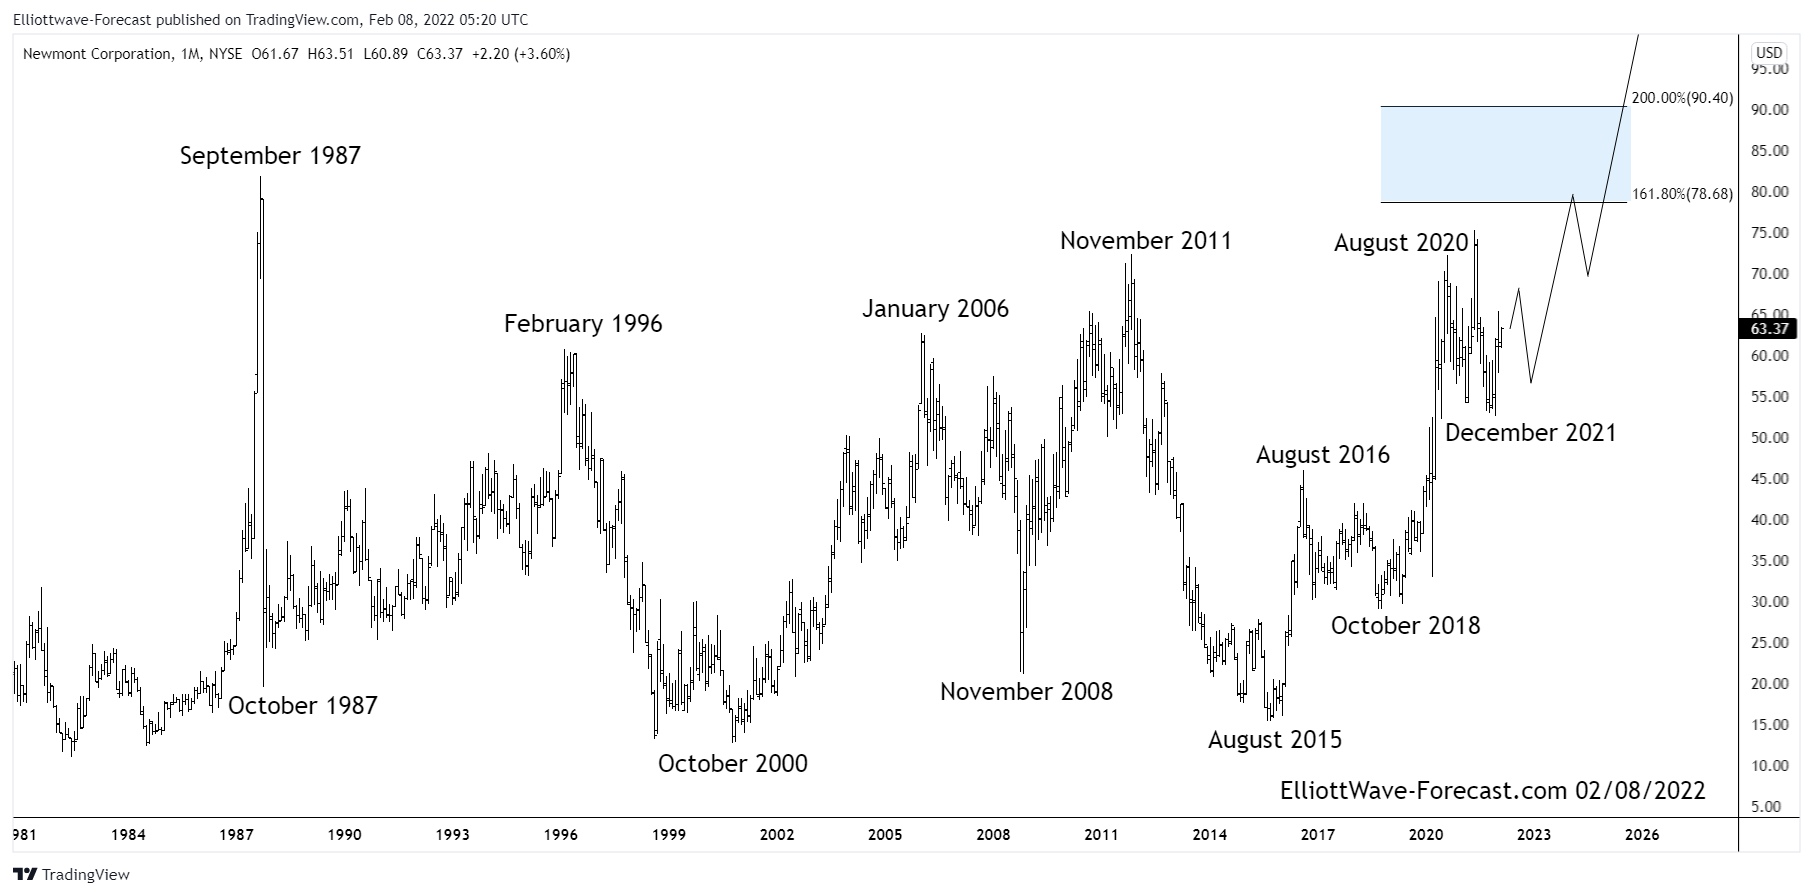
The Newmont Corporation Longer Term Bullish Cycles $NEM
Firstly from the beginning of price data from back in the 1970’s not shown on the chart, the price trend was obviously up. It ended that bullish cycle in September 1987 and pulled back really hard during the October 1987 crash. Price stabilized from there several years into the 1996 highs before another cycle lower into the October 2000 lows. That swing lower finished a correction of the cycle up from the all time lows. Those lows are still intact. The bounce that developed from the October 2000 lows into the January 2006 highs appears to have been an Elliott Wave impulse of five waves.
Secondly the three large swings from the January 2006 highs down to November 2008 lows appears to be the beginning of a large flat 3-3-5 structure. From the November 2008 lows back up to the November 2011 highs was likely a zig-zag structure by itself. The decline from the November 2011 highs down to the August 2015 lows appeared to be five waves. This completed a 3-3-5 flat structure. Of note, the lows from October 2000 remained intact again suggesting the August 2015 lows finished correcting that cycle up from there.
The analysis continues below the chart.
Thirdly in conclusion the aforementioned lows from August 2015 & now as well as the October 2018 lows should remain intact during future pullbacks for a long time to come. The bounce from those lows definitely ended the cycle lower. The bounce to the August 2016 high appeared to be five waves up. This was similar to the October 2000 to January 2006 bounce although of smaller degree. The pullback lower from the August 2016 high to the October 2018 low was obviously three swings. Price has bounced real hard from there suggesting it is within a larger degree wave three. Pullbacks should remain well above the October 2018 cycle lows & now as well as the December 2021 lows. While doing that, the possibility remains that current cycle will take out the old highs from September 1987 in the not too distant future.
The last time I Chevron was back in November 2021 (you can view this article here). The energy Industry has been impulsive and bullish since the low struck at the March 2020 low. In my previous view I was looking for a 5th wave off the 2020 low to take place before pulling back to correct that low. Lets take a look at the chart below:
Chevron Elliottwave View November 2021:
In November 2021, as mentioned, I was looking for further extension higher in Chevron. At the time there was some momentum divergence to suggest that the cycle from the 2020 low was close to coming to an end. Extension higher did take place, but ended up giving more bullish momentum than was expected. Lets take a look at the current view, and what momentum is suggesting for Chevron.
Chevron Elliottwave View Feb 2022:
Since the October 2020 low in Chevron, the count is looking very bullish. Momentum is suggesting that the instrument is nesting before moving higher in a wave 3 of 3 advance. There is an area above that can be an area where another pullback can take place. The 140.55 to 170.14 area is the 100% - 161.8% extension area for the black ((3)) area to possibly peak. Ideally, ((3)) will extend higher to the 170.14 161.8% extension. Due the idea that this instrument is nesting with a possible triple nest (after blue (2) retraces) it is possible higher extension takes place than anticipated for ((3)). For now, another nest in (2) is expected to take place before the next rally higher.
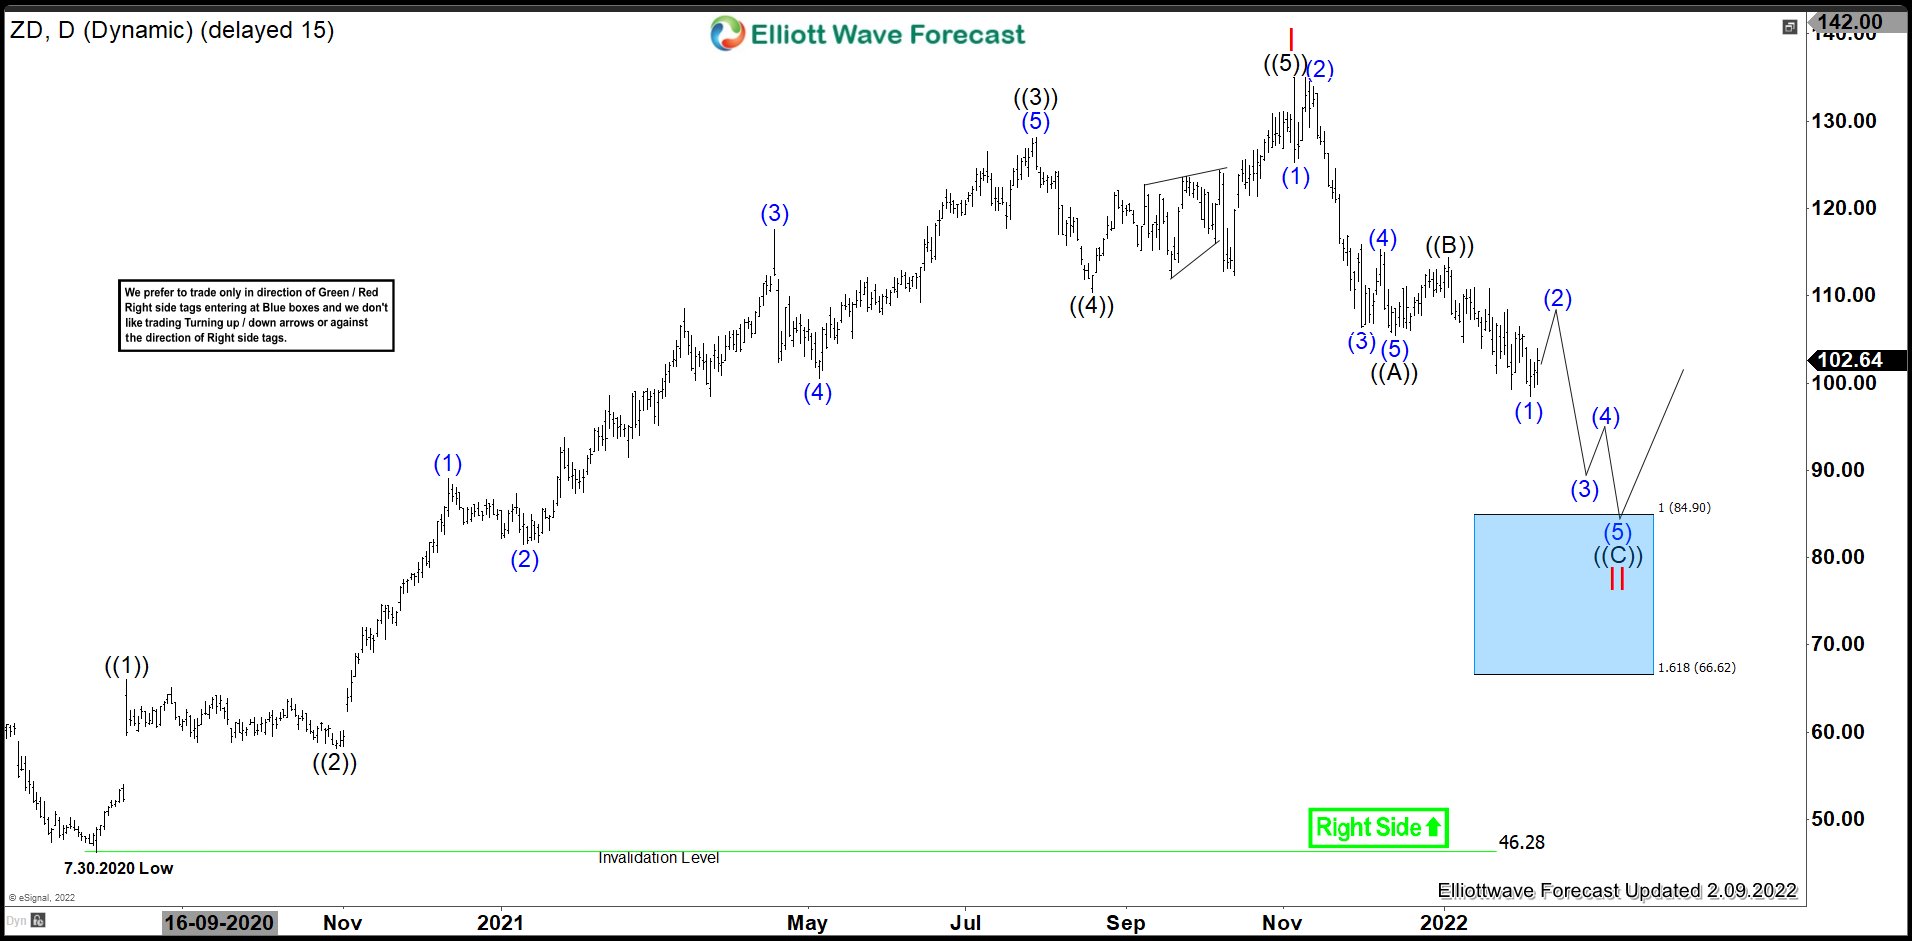
Ziff Davis Inc ( ZD ) operates as a vertically focused digital media & internet company. It primarily invests in technology, entertainment, shopping, health & cybersecurity. It based in New York. It comes under Communication services sector & trades under “ZD” ticker at Nasdaq.
ZD continue weakness during global sell off in early 2020, while market started turning higher, but it made an intermediate low at $46.28 on 7/30/2020. After that, it started higher high sequence & made ATH at $135 in 2021 as impulse sequence & starts correcting it.
ZD - Elliott Wave Latest Daily View:
It favored ended ((1)) at $66.09 high on 8/11/2020. Below there, it corrected lower in ((2)) at $58.11 low on 10/29/2020 as 0.382 retracement against ((1)). It started ((3)) as an extended wave & favored ended at $128.08 high on 7/29/2021. ((4)) correction proposed ended at $110.43 low on 8/19/2021 as 0.236 retracement against ((3)). Finally, it favored ended ((5)) at $135 high on 11/04/2021 as I red impulse sequence started from July-2020 low. While below there it starts correcting lower in II.
It favored ended ((A)) at $105.50 low & ((B)) at $114.43 high dated 1/04/2022. While below $114.43 high, it confirms the lower low sequence calling for ((C)) leg down towards $84.90 – $66.62 area to end II correction before it resumes upside or at least 3 swing bounce. We like to buy it in the blue box area when reached.
In this technical blog, we will look at the past performance of 4 hour Elliott Wave Charts of XLK. In which, the rally from 23 March 2020 low unfolded as an impulse and showed a higher high sequence. Therefore, we knew that the structure in XLK is incomplete to the upside & should see more upside. So, we advised members not to sell the ETF & buy the dips in 3, 7, or 11 swings at the blue box areas. We will explain the structure & forecast below:
XLK 4 Hour Elliott Wave Chart
Here’s 4hr Elliott wave Chart from the 1/23/2022 Weekend update. In which, the rally to $177.68 high ended the cycle from 23 March 2020 low in cycle degree wave III & made a pullback in wave IV. The internals of that pullback unfolded as Elliott wave zigzag structure where wave ((A)) ended in 5 swings at $161.29 low. Then a bounce to $170.36 high ended wave ((B)) & started the next leg lower in wave ((C)) towards $153.84- $143.59 blue box area. From there, buyers were expected to appear looking for new highs ideally or for a 3 wave bounce minimum.
XLK Latest 4 Hour Elliott Wave Chart
Above is the latest 4hr Elliott wave Chart from the 2/08/2022 update. In which the ETF is showing a reaction higher taking place from the blue box area at $153.84- $143.59. Right after ending the zigzag correction within the blue box area. Allowed members to create a risk-free position with the minimum reaction higher towards 50%- 61.8% Fibonacci retracement from the peak at $161.98- $165.69 area. However, a break above $177.68 high is still needed to confirm the next extension higher & avoid double correction lower.
Apple Stock ( $AAPL ) is another instrument that has given us trading opportunity lately . As our members know the stock is having clear bullish sequences and we were keep buying dips in 3,7,11 swings whenever we got an opportunity. We recommended members to avoid short selling the stock in any proposed pull back while keep favoring the long side. Recently Apple stock made clear 3 waves pull back and found buyers at the blue box as we expected. In this technical blog we’re going to take a quick look at the charts of AAPL published in members area of the website and explain the Elliott Wave structure and trading strategy.
Apple ( $AAPL ) Elliott Wave 4 Hour Chart 01.19.2022
Current view suggests Apple Stock is doing (4) blue correction which is unfolding as Elliott Wave Zig Zag Pattern. Pull back is showing incomplete lower low sequences, suggesting more downside toward blue box area : 162.1-152.8. As the main trend is bullish we expect buyers to appear at the blue box for 3 waves bounce at least. Strategy is the same as always, once bounce reaches 50 Fibs against the Bred high, we will make long position risk free ( put SL at BE). Invalidation for the trade would be break of marked invalidation level 152.8
As our members know, Blue Boxes are no enemy areas , giving us 85% chance to get a bounce.
You can learn more about Elliott Wave Patterns at our Free Elliott Wave Educational Web Page.
The stock has found buyers at the marked zone and we are getting good reaction from there. Pull back has ended at 154.73 low. The rally from the blue box reached and exceeded 50 fibs against the ((B)) connector. Consequently, members who have taken the long trades at the blue box now enjoying profits in a risk free trades. Now we would need to see break of III red peak in order to confirm next leg up is in progress. Short term cycle from the 154.73 low looks to be unfolding as 5 waves structure. While above 170.61 low, we could be in wave 5 red toward 177.6-179.7 area.
Keep in mind that market is dynamic and presented view could have changed in the mean time. You can check most recent charts in the membership area of the site. Best instruments to trade are those having incomplete bullish or bearish swings sequences. We put them in Sequence Report and best among them are shown in the Live Trading Room
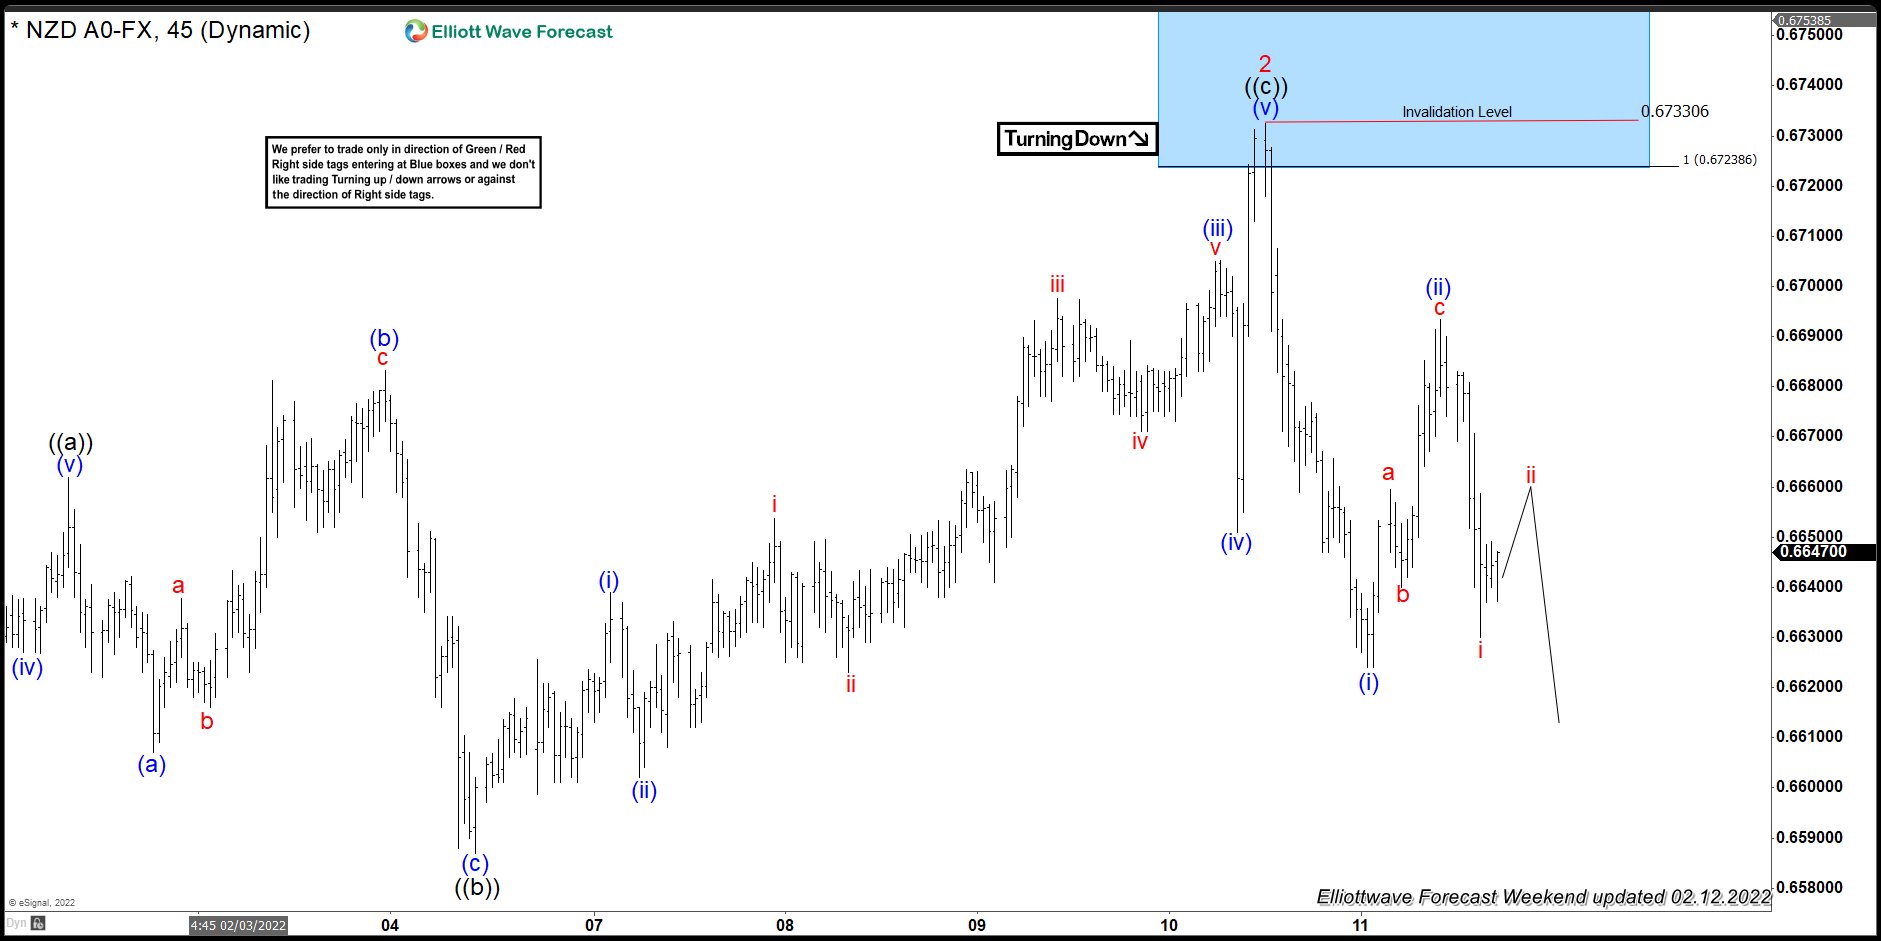
In this technical blog we’re going to take a quick look at the Elliott Wave charts of NZDUSD. The pair has reached extremes in the cycle from the February 2021 peak. However cycle from the October 21st 2021 peak still shows incomplete sequences. Besides that, AUDUSD and USDCAD still have not reached their extremes in equivalent cycles, which suggested potential extension down in NZDUSD. As our members know, NZDUSD has given us nice selling opportunity recently. The pair has made 3 waves bounce against the 0.6892 peak. We recommended members to avoid buying and keep selling rallies in 3,7,11 swings. In the further text we are going to explain the Elliott Wave Pattern and the Forecast.
NZDUSD H4 Elliott Wave Analysis 02.09.2022
NZDUSD is correcting the cycle from the 0.6892 peak. Recovery shows higher high- incomplete sequences at the moment. Consequently we are calling for more short term strength toward 0.67224-0.6806 area to complete 2 red as potential Elliott Wave Zig Zag pattern. We recommended members to avoid buying the pair in proposed push up. Strategy is waiting for Blue Box to be reached before selling the pair again. As the main trend is bearish we expect sellers to appear at the blue box for 3 waves pull back at least. Once pull back reaches 50 Fibs against the ((b)) black low, we will make short position risk free ( put SL at BE). Invalidation for the trade would be break above 1.618 fibs extension: 0.6806
As our members know Blue Boxes are no enemy areas , giving us 85% chance to get a pull back.
You can learn more about Zig Zag Elliott Wave Patterns at our Free Elliott Wave Educational Web Page.
Now let's take a look at H1 charts, to see what the price structure looks like in shorter time frames.
NZDUSD H1 Elliott Wave Analysis 02.12.2022
The pair reached equal legs area at 0.67224-0.6806 ( blue box) and made turn lower from there. At this stage we are calling recovery completed at 0.6733 high. Short term cycle from the mentioned peak ended as 5 waves decline- (i) blue. Then, we got 3 waves bounce in (ii) blue. Now we would like to see break of (i) blue low, to confirm further extension down and more separations from the latest high. The decline has already reached 50 fibs against the ((b)) black connector, so all short positions from the blue box are risk free. (SL put at BE)
NZDUSD H1 Elliott Wave Analysis 02.14.2022
Eventually NZDUSD made further extension down and broke (i) blue low. While (ii) blue peak holds, xext short term tech zone to the downside comes at 0.6586-0.6521. We would like to see break of 01/28 low to confirm next leg down is in progress.
Keep in mind market is dynamic and presented view could have changed in the mean time. You can check most recent charts in the membership area of the site. Best instruments to trade are those having incomplete bullish or bearish swings sequences.We put them in Sequence Report and best among them are shown in the Live Trading Room.
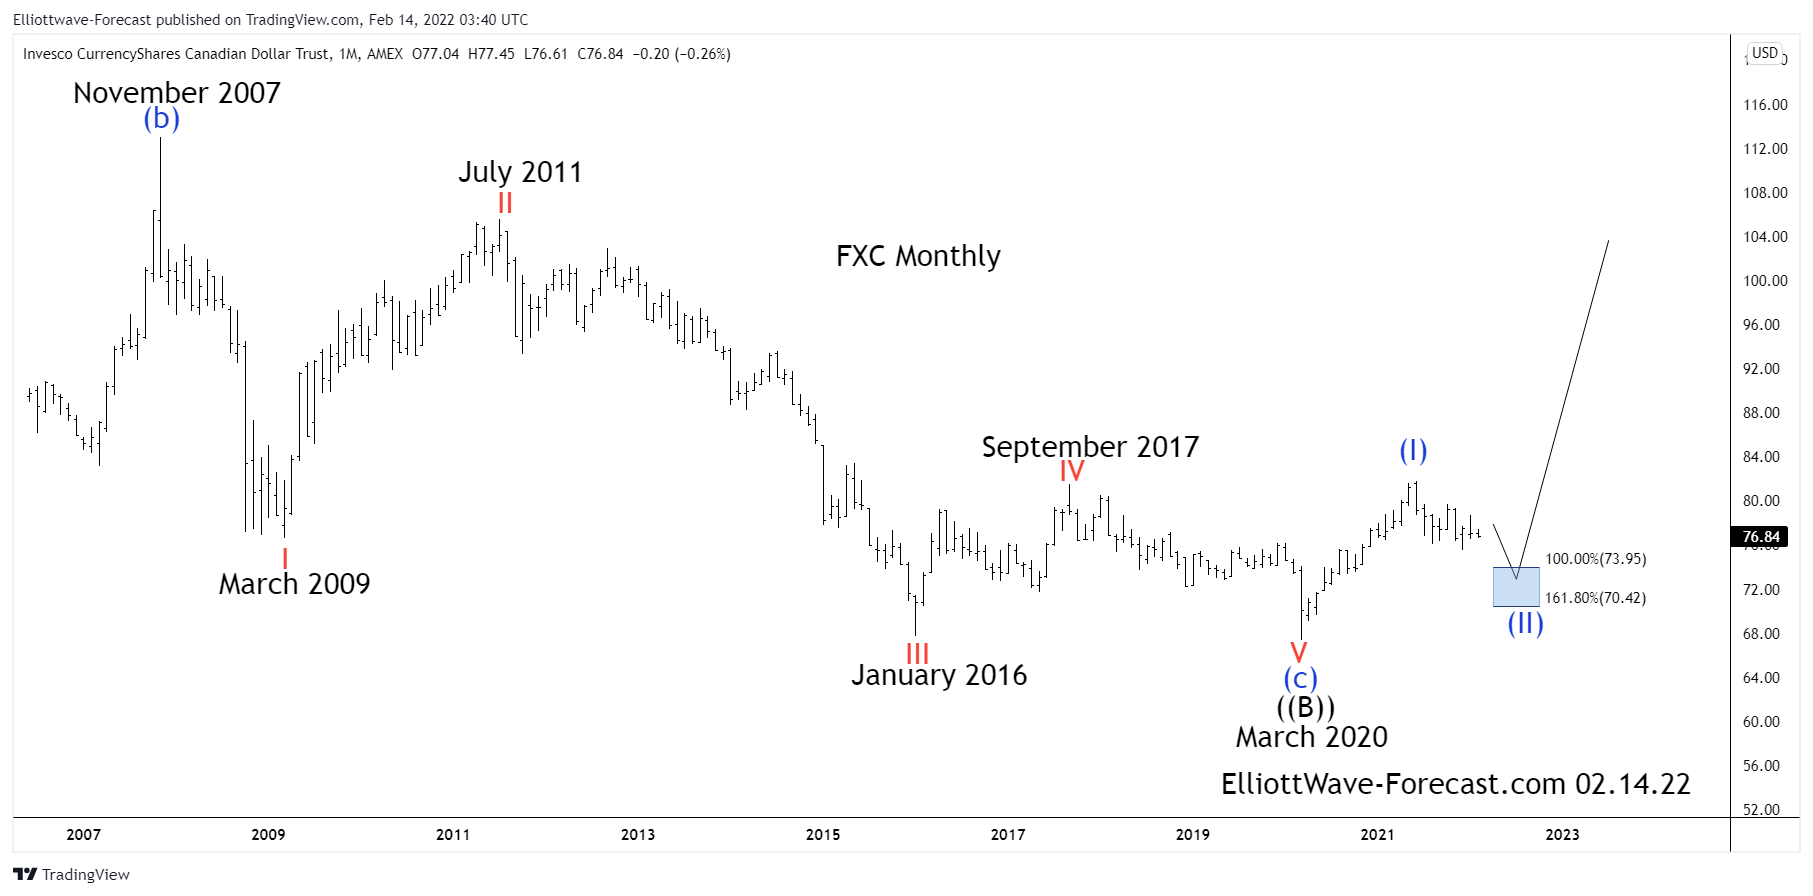
Canadian Dollar Trust Long Term Cycles & Elliott Wave $FXC
Firstly the FXC instrument inception date was 6/26/2006. The instrument tracks changes of the value of the Canadian dollar relative to the U.S. dollar. The FXC trades inversely to the USDCAD forex pair. In January 2002 the USDCAD forex pair made an all time high at 1.6184. Then it saw a decline into the November 2007 lows at .9059 where it is thought to have ended correcting the cycle up from the all time lows. That translates to the 113.02 price high from November 2007 in FXC. This is where the analysis begins on the FXC monthly chart shown below. The analysis continues below the FXC Monthly chart.
Secondly as previously suggested the FXC instrument mirrors USDCAD price highs and lows inversely. The decline from the November 2007 highs in FXC appears to be a complete Elliott Wave five wave impulse although it does have some price overlap as would a diagonal. The wave III ended in January 2016 then saw a zig zag wave structure in wave IV that ended in September 2017 correct the cycle from the July 2011 wave II highs.
In conclusion: As the chart suggests, the instrument appears ended a larger cycle lower in wave V of (C) to complete a flat wave ((B)) in March 2020. The bounce from there can be corrected while below the June 1st 2021 highs. The pullback area for the wave (II) in blue is pending however while it’s below 79.67 it can see the 73.95-70.42 area as it corrects the cycle up from the March 2020 lows. While above the March 2020 lows it should resume higher again.
In our previous May 31, 2021 article on Nio (NYSE: NIO), we argued that the stock is in the process of all-time low correction. Nio is a Chinese electric car manufacturer based in Shanghai. The stock sees a meteoric rise since it debuted on September 2018 at NYSE. We have suggested previously that due to mounting competition in China's electric vehicle market as well as unsustainable valuation, it needs some profit taking and healthy pullback. Fast forward 6 months later, we see a 70% correction from the all-time high of $67, quite e hefty correction. Below we will update the Elliott Wave outlook for the stock.
If you’d like to receive regular updates on stocks, forex, commodities, and cryptos, feel free to try our service here –> 14 days Free Trial.
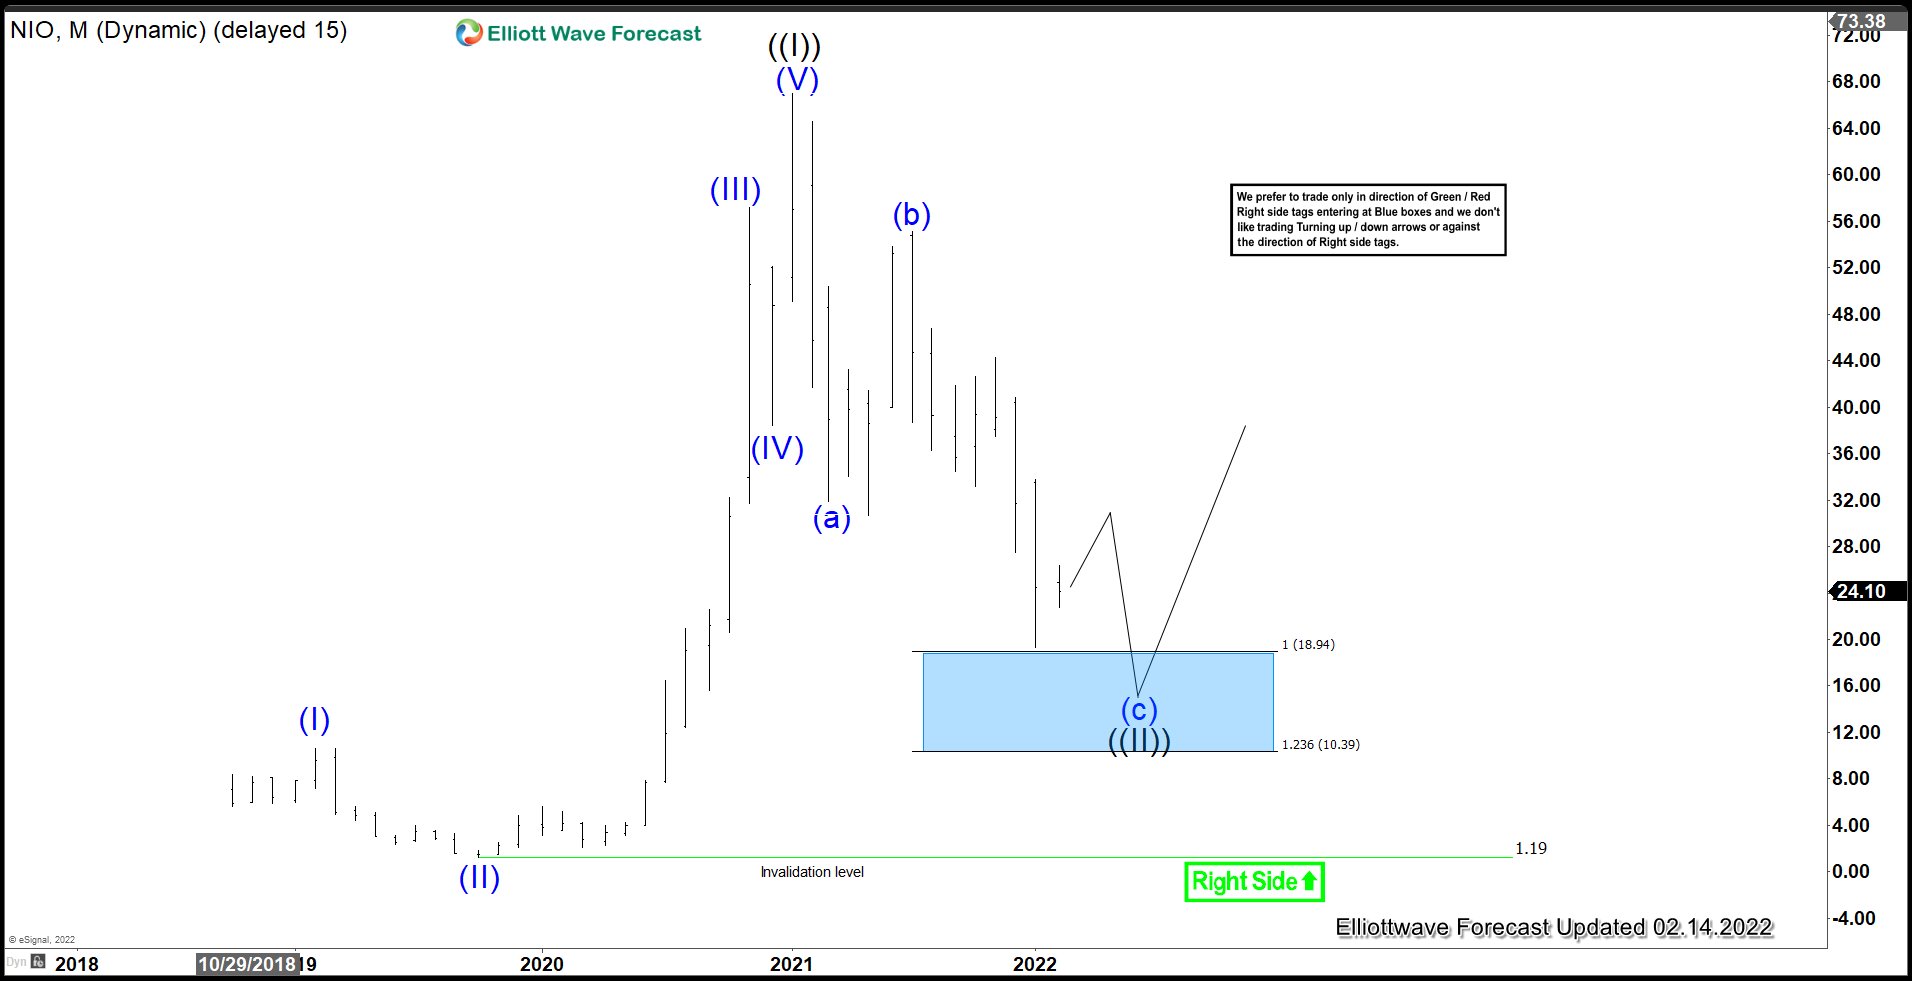
NIO Monthly Elliott Wave Analysis – 02.14.2022
Nio went to public on September 2018 and priced its shares at $6.26. Within a span of slightly more than 2 years, the stock saw almost 1000% increase from the IPO price when it hit the all-time high of $67 on January 11, 2011. Since then, the stock has retreated sharply. It is currently down 70% from the all-time high but as we can see from the monthly chart above, it is near the support area of $10.5 - 19.00. This is when the pullback reaches 100% - 123.6% in 3 swing from the all-time high of January 11, 2011 peak. From this area, the stock can see at least a 3 waves rally if not beginning a new bullish leg.
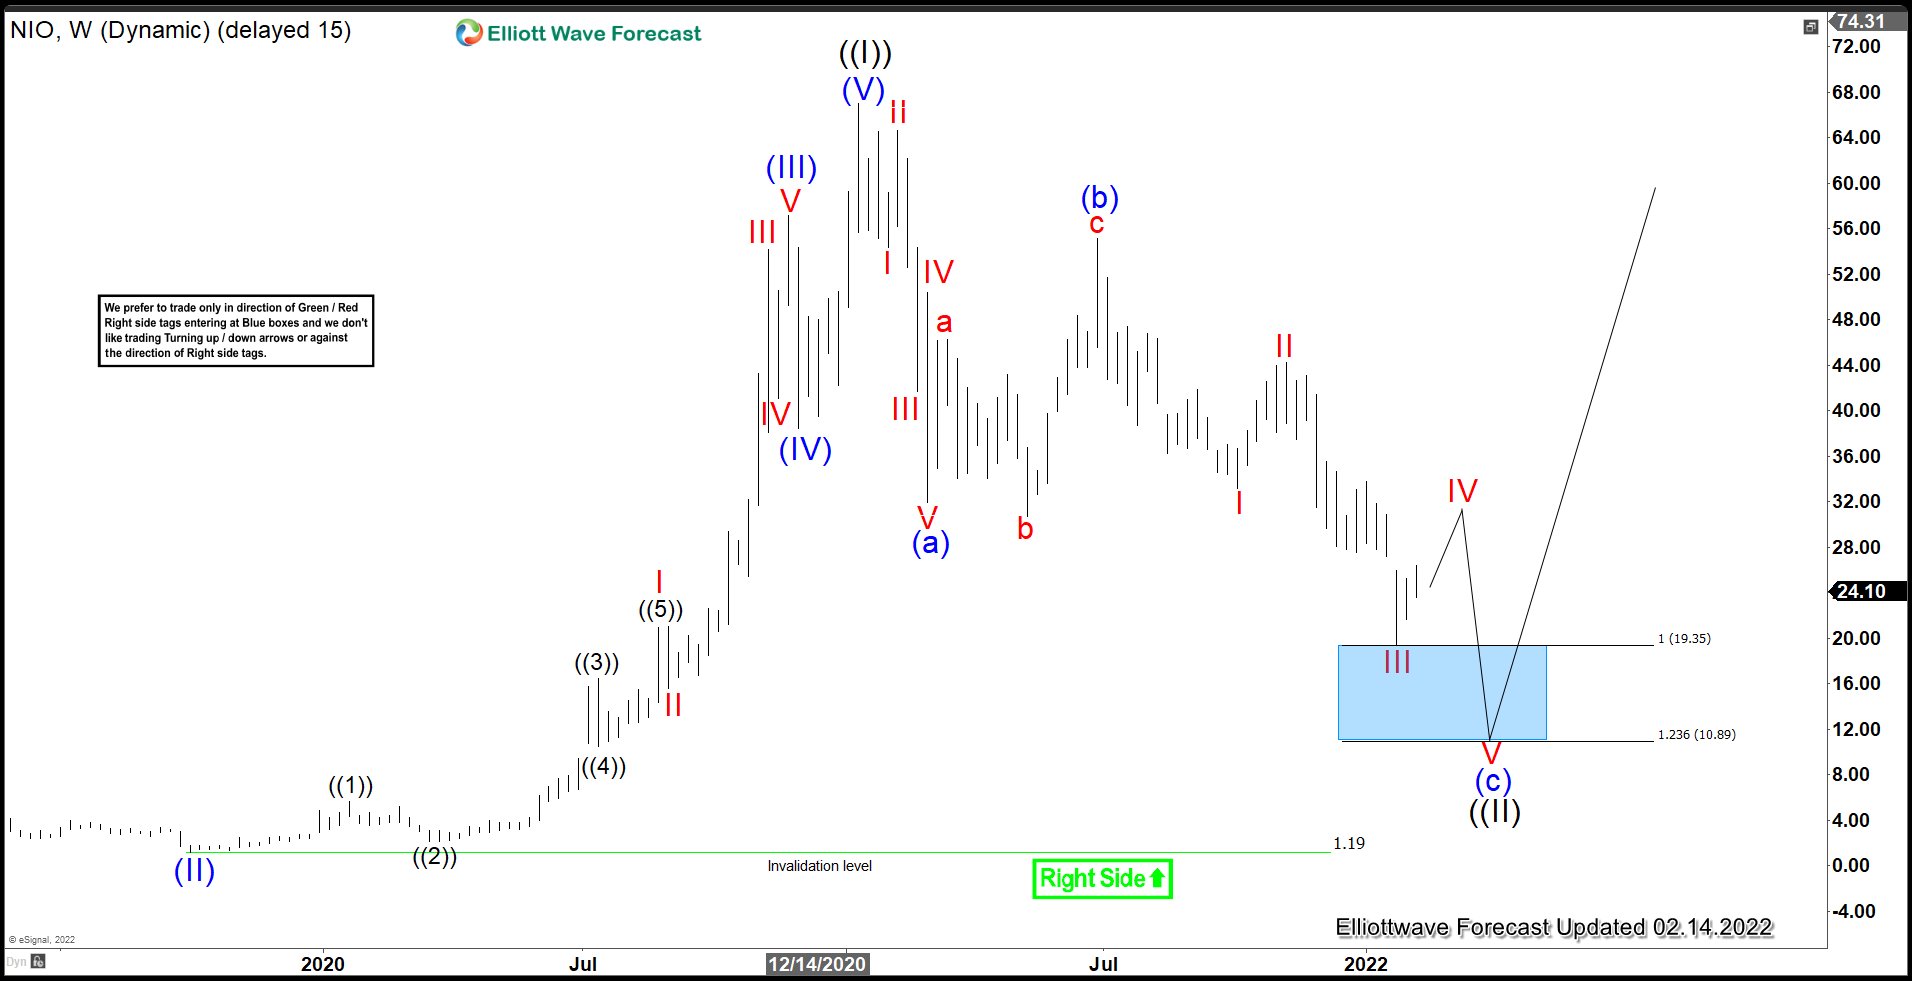
NIO Weekly Elliott Wave Analysis – 02.14.2022
Downgrading to the lower time weekly time frame, we can see that the pullback in wave ((II)) is in the form of a zigzag structure. The rally to $67 ended a Grand Super Cycle degree wave ((I)). Then Grand Super Cycle wave ((II)) pullback is in progress to correct the entire rally from all-time low. Down from wave ((I)), wave (a) ended at $31.91 as an impulse. Wave (b) ended at $55.13 as an expanded flat. Finally wave (c) lower is in progress as a 5 waves impulse where another push lower is possible into the $10 area before the stock find supports.
CrowdStrike Holdings, Inc.(CRWD) is an American cybersecurity technology company based in Austin, Texas. It provides cloud workload and endpoint security, threat intelligence, and cyberattack response services.
CrowdStrike (CRWD) July 2021 Daily Chart
On July 22nd, we analyzed CRWD showing an structure suggesting that a very important market cycle was near to end; that is, the whole cycle from its foundation in 2011. We were expecting to peak after 5 waves up from 168.67 wave IV low and we provided a blue box area in 271.69 – 303.60 as possible zone to finish this Super Cycle and start a huge pullback.
CrowdStrike (CRWD) November 2021 Daily Chart
In November, the structure of CRWD had enough swings to think that 5 waves impulse and the Super Cycle had ended. The impulse started with wave I ended at 101.800 on 2019, the wave II pullback finished at 31.95 on March 2020 with the pandemic drop. From there the rally continued and wave III ended at 251.28 and a corrective wave as IV completed at 168.67. In this point, the last push to complete wave V higher began, and as expected CRWD made 5 swings up being the last wave ((5)) of (V) an ending diagonal. The cycle ended at 298.48 inside our possible target area 271.69 – 303.60 and we were expecting a very important drop in the stock. (If you want to learn more about Elliott Wave Theory, please follow these links: Elliott Wave Education and Elliott Wave Theory).
CrowdStrike (CRWD) December 2021 Daily Chart
The dip was very strong and in 3 weeks CRWD hit 185.71 losing 37.78%. We change our first view for a possible wxy correction to an abc correction and marked an impulse structure from the top ending wave “a” at 185.71. We suggested a pullback in wave “b” before continuing with the downtrend.
CrowdStrike (CRWD) January Daily Chart
The corrective wave “b” was small ending at 217.11 and CRWD kept dropping. Therefore, we began to build the next impulse to complete wave “c” the last one of the abc correction and finish the whole correction as wave (II). We were calling one more low to end wave ((1)) and an correction as wave ((2)) to then see further downside in the stock.
CrowdStrike (CRWD) February 12th Daily Chart
After 3 swings down from wave “b”, CRWD bounced from 150.02 and the rally were stronger that we thought. That made us to return to the original plan of a wxy correction and we labeled the fall in that way, given the end of the wxy structure and wave (II) at 150.02. From here, the rally looks like as a leading diagonal ending the wave (1) at 193.40. Currently, we are developing wave (2) pullback and as we stay above 150.02 we should continue with the rally.
To conclude, there is still a probability to see 3 swings more down in CRWD. That is a ((W)), ((X)), ((Y)) structure from wave “b”. Wave ((W)) could have ended at 150.02 then wave ((X)) ended at 193.40 and we need 3 swings more to complete the fractal and the corrective wave (II). Thus, we are looking to complete wave (2) and continuing with the rally as we stay above 150.02. In case the invalidation level gives up, we could continue down to 110.90 – 126.64 area in 3 swings more and from there resume the rally. This is a nice possibility for a long-term trade in this stock.
RTY_F made a sharp decline during the month of January 2022. Clients of Elliottwave-Forecast were aware that decline was nothing more than another buying opportunity and our daily chart had the range defined where we expected 3 waves decline to end and buyers to appear to resume the rally or produce 3 waves reaction higher at least.
With Bitcoin having rallied over 40K from the March 2020 low, Crypto and Blockchain markets continue to show potential. Bit Digital is a company that experienced a large vertical rally in late 2020. After that, it has been correcting the whole rally in a large wave II.
Bit Digital touts itself as one of the world’s largest publicly-listed bitcoin mining companies. Bit Digital is a sustainability-focused generator of digital assets with large-scale, global mining operations representing a currently-owned maximum hash rate of 1.603 EH/S
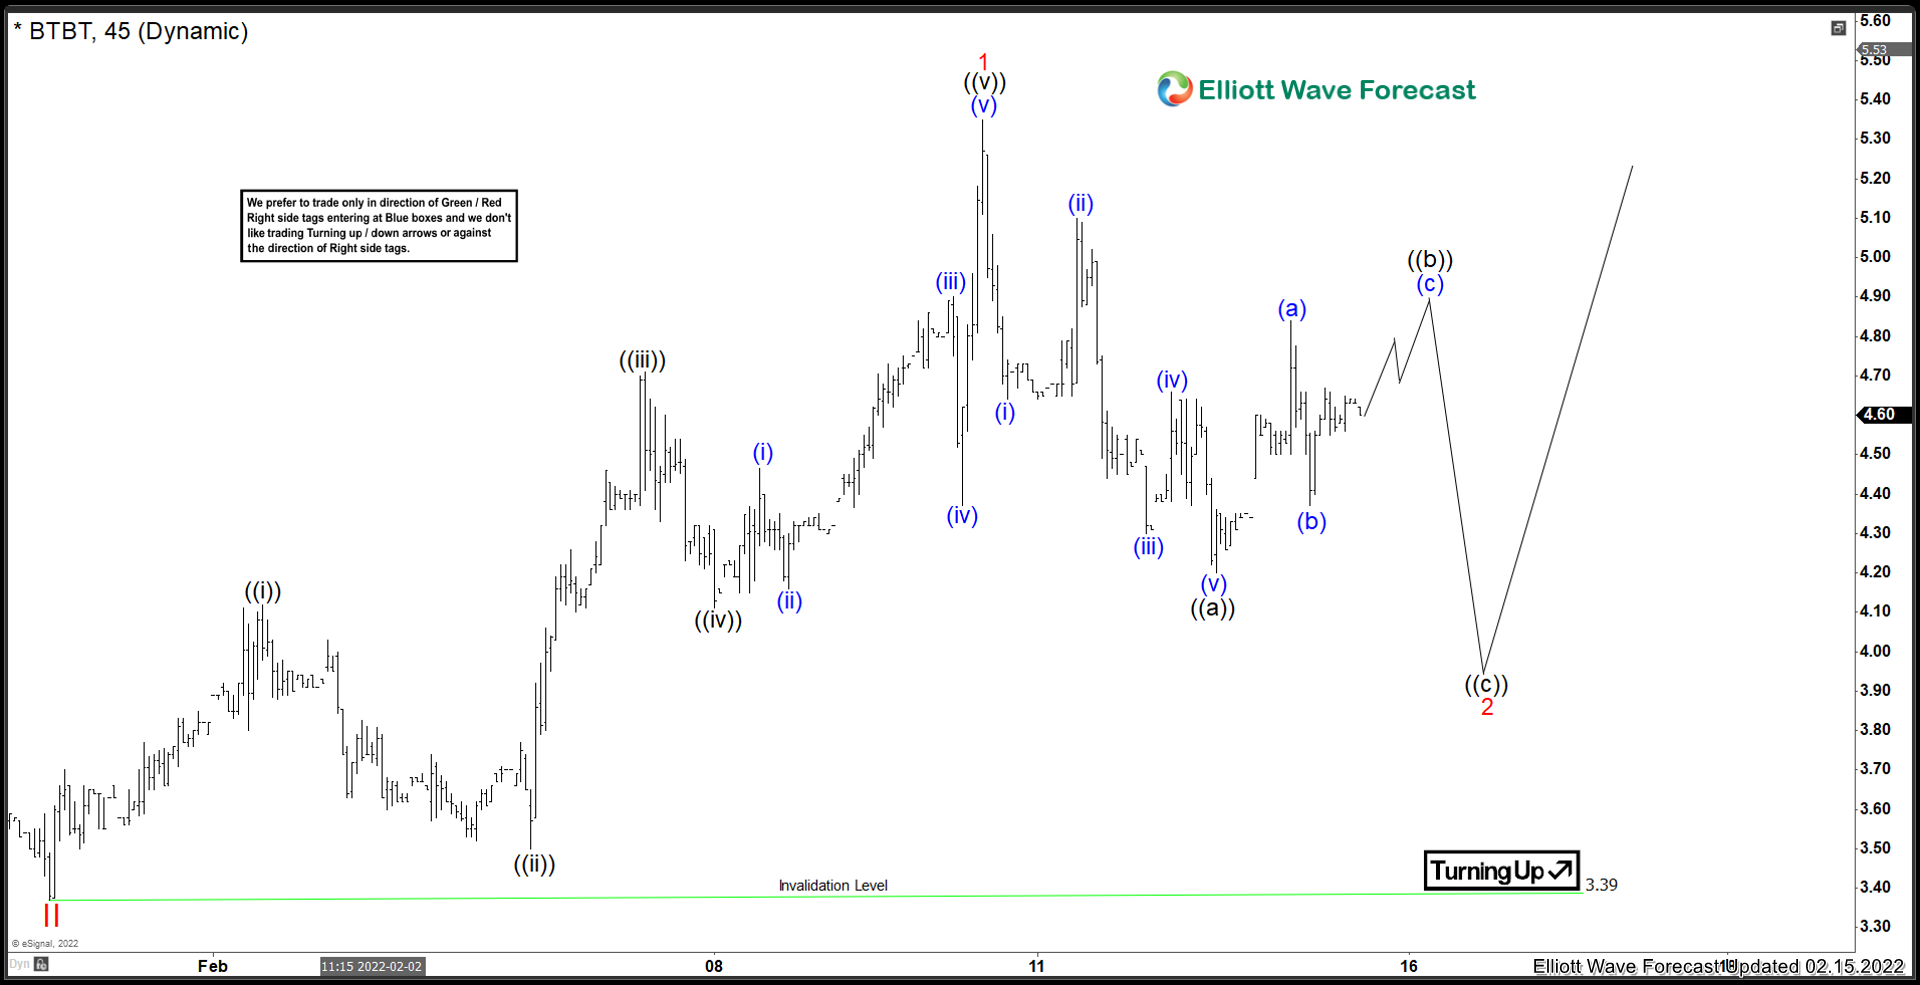
After ralling from 28 cents to a peak of 33.00, and then recently declining to a low of 3.39, traders should be aware of the extreme volatility inherent in the Bitcoin Mining sector. Lets take a look at the charts.
Bit Digital Elliottwave View Daily:
Longer term term view from the all time low in March 2020. In Summary, there was a 5 waves advance with a very extended 5th wave. This impulse peaked in January 4/2021 at a price of 33.00. After that, a long pullback has taken place. This pullback found support in July 2021 where a bounce in ((X)) took place. It has been very choppy since the major peak in Early 2021. With the most recent data and momentum RSI Readings, it is favoured that this stock has struck a low at the recent Jan 28/2022 low. This date has proven to be a market wide cycle low date. For now, as long as prices remain above the Jan 28 low of 3.39 further upside is favoured to take place.
Lets zoom into the 1H view below.
Bit Digital Elliottwave View 1H:
Shorter cycle view from the Jan 28/2022 low. Bit Digital shows a clean 5 waves higher into the Red 1 peak. Red 1 peaked on Feb 10 @ 5.25. Momentum is suggesting that a pullback to correct the rally from Jan 28 is underway. There is 5 waves down into ((a)) presently, and now a reaction higher. The expectation would still be for another swing lower in ((c)) of Red 2, before moving higher. As long as the low of 3.39 remains intact, further upside is favoured to take place after ((c)) of 2 is set.
In this technical blog, we will look at the past performance of 1 hour Elliott Wave Charts of AUDUSD. In which, the decline from 13 January 2022 high unfolded as an impulse sequence and showed a lower low sequence. Therefore, we knew that the structure in AUDUSD is incomplete to the downside & should see more weakness. So, we advised members not to buy the pair & sell the bounces in 3, 7, or 11 swings at the blue box areas. We will explain the structure & forecast below:
AUDUSD 1 Hour Elliott Wave Chart
Here’s 1hr Elliott wave Chart from the 2/03/2022 Asia update. In which, the decline to $0.6963 low ended 5 waves from 1/13/2022 high in wave 1 & made a bounce in wave 2. The internals of that bounce unfolded in a lesser degree 5 wave impulse sequence, which suggested that it's a continuation pattern & it should see another leg higher to complete the Elliott wave zigzag correction before the pair gets ready to turn lower.
AUDUSD 1 Hour Elliott Wave Chart
Above is the 1hr Elliott wave chart from the 2/11/2022 Asia update. In which, the pair continued the bounce higher & managed to reach the extreme $0.7243- $0.7290 blue box area. From there, the pair got rejected & found sellers as expected. Since then the pair has made a good reaction lower & already retraced more than 50% of the whole bounce allowing members to create a risk-free position shortly after taking the longs.
AUDUSD Latest 1 Hour Elliott Wave Chart
This is the latest 1hr view from the 2/17/2022 Asia update. In which the pair is showing reaction lower taking place as expected so far. Now as far as bounces fail below $0.7248 high then the pair is expected to resume lower. However, a break below $0.6963 level remains to be seen to confirm the next leg lower & avoid double correction higher.
BorgWarner Inc (BWA) provides solutions for combustion, hybrid & electric vehicles worldwide. The company operates through four segments, Air management, E-propulsion & drivetrain, Fuel injection & Aftermarket. It is based in Auburn Hills, Michigan. It comes under Consumer cyclical sector & trades as “BWA” ticker at NYSE.
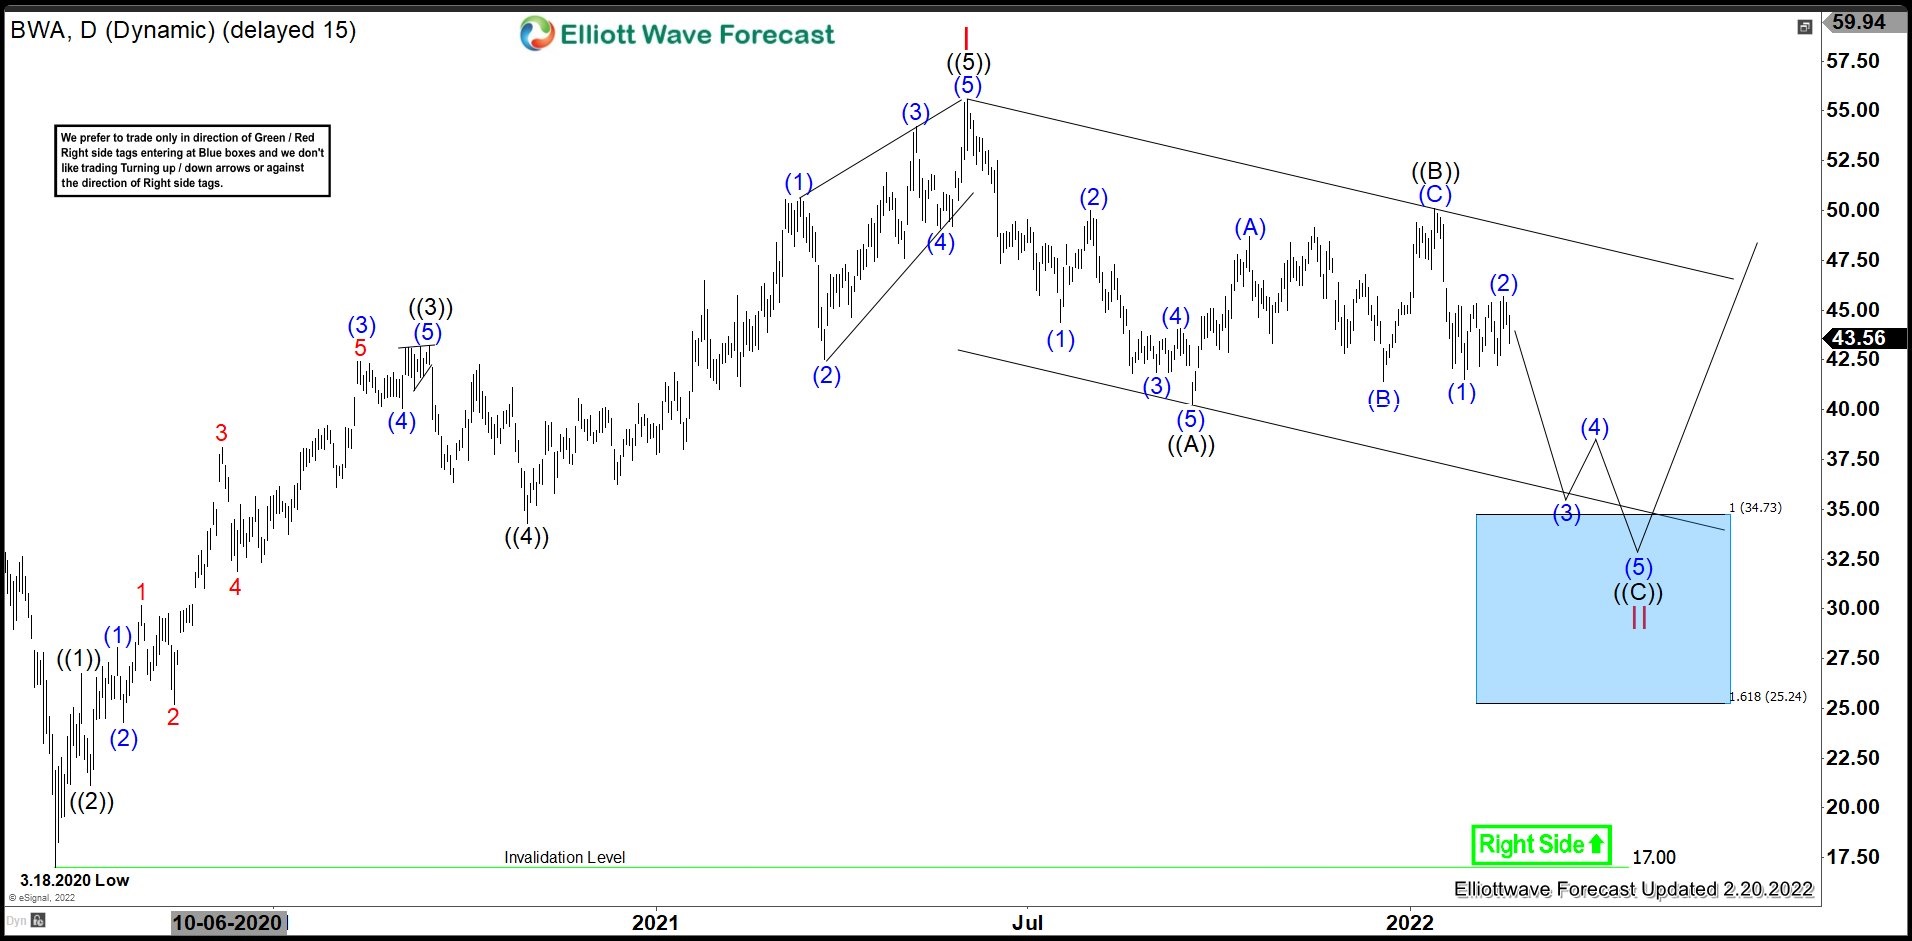
BWA favored ended larger correction in weekly at $17.00 on 3/18/2020 against during global sell off in March-2020. While above there, it favored ended impulse I at $55.55 high on 6/03/2021. Below there, it favors correction in II & expect further downside before resume upside.
BWA - Elliott Wave Daily Latest View :
It placed ((1)) at $26.73 high on 3/31/2020 in the sequence started from 3/18/2020 low. While below there, it favored ended ((2)) at $21.15 low as 0.618 retracement against previous cycle. Thereafter, it started ((3)) higher & favored ended at $43.22 high on 9/15/2020 low. It placed ((4)) at $34.30 low as 0.382 retracement against previous cycle. It finally ended ((5)) at $55.55 high 6/03/2021 as I red impulse from the March-2020 low. While below there, it favors correction lower in proposed zigzag structure to end II before upside resume.
It favored ended ((A)) at $40.28 low & ((B)) at $50.09 high. While below there, it placed (1) & (2) at $45.70 high & favors more weakness in (3) lower, which will confirm below $41.49 low. It expect to extend lower towards $34.73 - $25.24 area to end ((C)) & so II correction before upside resume. We like to remain bullish from the blue box area for next leg higher or at least 3 swing bounce.
Hello fellow traders. Another instrument that has given us trading setup lately is BTCUSD. In this technical blog we’re going to take a quick look at the Elliott Wave charts of Bitcoin. As our members know the Cryptocurrency shows lower low sequences in the cycle from the all-time high ( 10 November 2021). That makes BTCUSD bearish against the 52094.62 pivot. We recommended members to avoid buying BTCUSD at this stage and keep selling rallies in 3,7,11 swings. Recently Bitcoin has given us 3 waves bounce against the 52094.62 high that has given us good trading opportunity. In the further text we are going to explain the Elliott Wave Forecast and the trading strategy.
BTCUSD H4 Elliott Wave Analysis 02.07.2022
BTCUSD is correcting the cycle from the 52185.7 peak. Correction looks to be unfolding as Elliott Wave Zig Zag pattern, with ABC red labeling. Recovery (X) blue already shows 3 waves up and price is at the extremes (blue box zone) . We recommended members to avoid buying the Cryptocurrency at this stage while favoring the short side. We expect sellers to appear at the blue box : 42374.5-46131.7 area. As the cycle from the November 2021 looks incomplete, we believe Bitcoin should see further decline from the marked zone or 3 waves pull back alternatively. Once pull back reaches 50 Fibs against the B red low, we will make short position risk free ( put SL at BE). Invalidation for the trade would be break above 1.618 fibs extension: 46131.7
As our members know Blue Boxes are no enemy areas , giving us 85% chance to get a pull back.
You can learn more about Zig Zag and other Elliott Wave Patterns at our Free Elliott Wave Educational Web Page.
BTCUSD H4 Elliott Wave Analysis 02.07.2022
The price held below upper level of the blue box : 45989.3 . Sellers were strong enough to pull the price lower. We are calling (X) recovery completed at 45875.8 high. However, break of January 24th low is needed for a confirmation. The decline from the selling zone ( blue box) has already reached and exceeded 50 fibs against the ((b)) black connector. As a result members who took short trades are enjoying profits in risk free positions now. All positions from the blue box are risk free. (SL is put at BE) + partial profit is taken.
We know it's not popular to call decline in $BTCUSD, but that is what sequences suggest. As our members know we have had a lot of buying setups in BTCUSD during the past 2 years. But at this moment Crypto still shows incomplete sequences so bulls should be careful. 52094.6high is the key pivot to hold for the bearish view.
Keep in mind market is dynamic and presented view could have changed in the mean time. You can check most recent charts in the membership area of the site. Best instruments to trade are those having incomplete bullish or bearish swings sequences.We put them in Sequence Report and best among them are shown in the Live Trading Room.
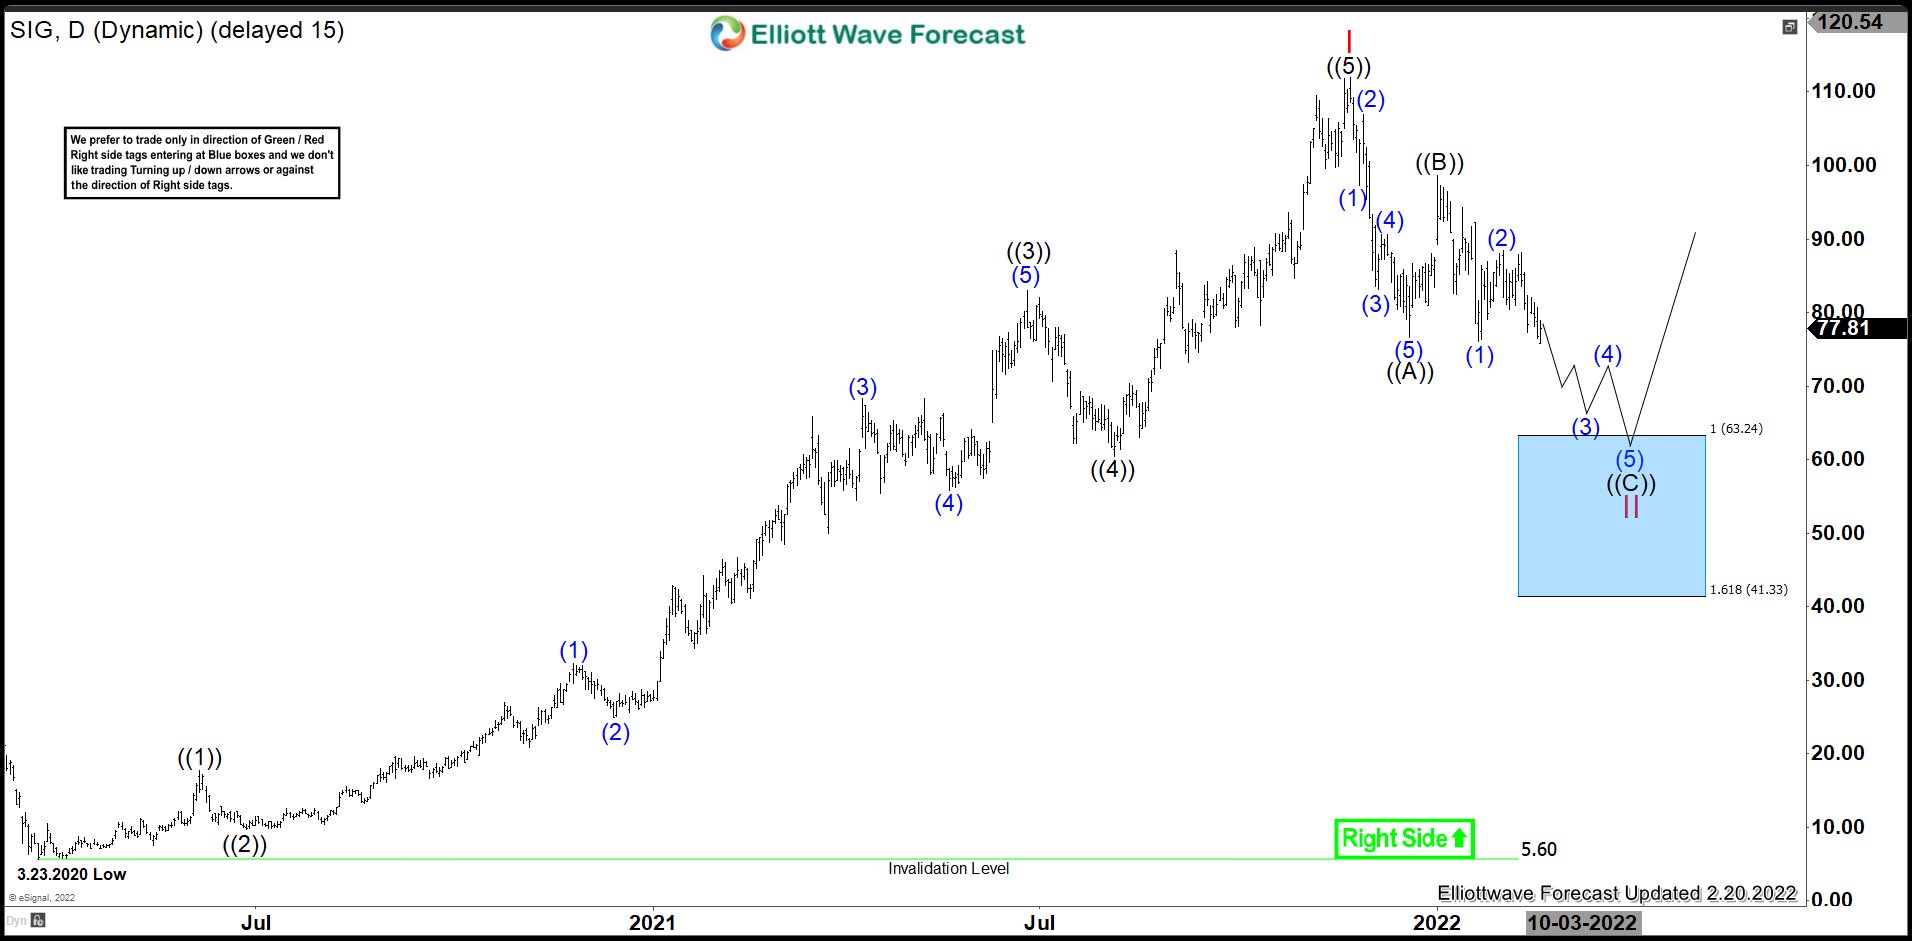
Signet Jewelers Limited (SIG) engages in the retail sale of diamond jewelry, watches & other products. It is based in Hamilton, Bermuda, comes under Consumer Cyclical sector & trades as “SIG” ticker at NYSE.
SIG made intermediate low at $5.60 during Covid pandemic early last year. Thereafter it started higher high sequence as impulse up, which proposed ended at $111.92 high & below there it favoring correction lower of II.
SIG - Elliott Wave Latest Daily View:
Above 3/23/2020 low of $5.60, it favored ended ((1)) at 17.67 high on 6/05/2020. Below there, it favored ended ((2)) at $9.71 low on 6/26/2020 as 0.618 retracement against ((1)). While dips remain above there, it started third wave extended move & favored ended ((3)) at 83.00 high on 6/25/2021. It placed ((4)) at $60.47 low on 8/5/2021. Finally, it proposed ended ((5)) at $111.92 high on 11/22/2021. While below there it favors correction lower in II red against the cycle from 3/23/2020 low & expect to extend lower towards $63.24 - $41.33 area before it resume higher.
Below $111.92 high, it favored ended impulse ((A)) at 76.66 low & ((B)) at $98.67 high. It placed (1) & (2) at $88.44 high & below there expecting more weakness towards $63.24 to end ((C)) correction in proposed zigzag structure to end II. It already confirmed lower low sequence calling for more weakness continues. We like to buy it within blue box area for next leg higher or at least 3 swing bounce.
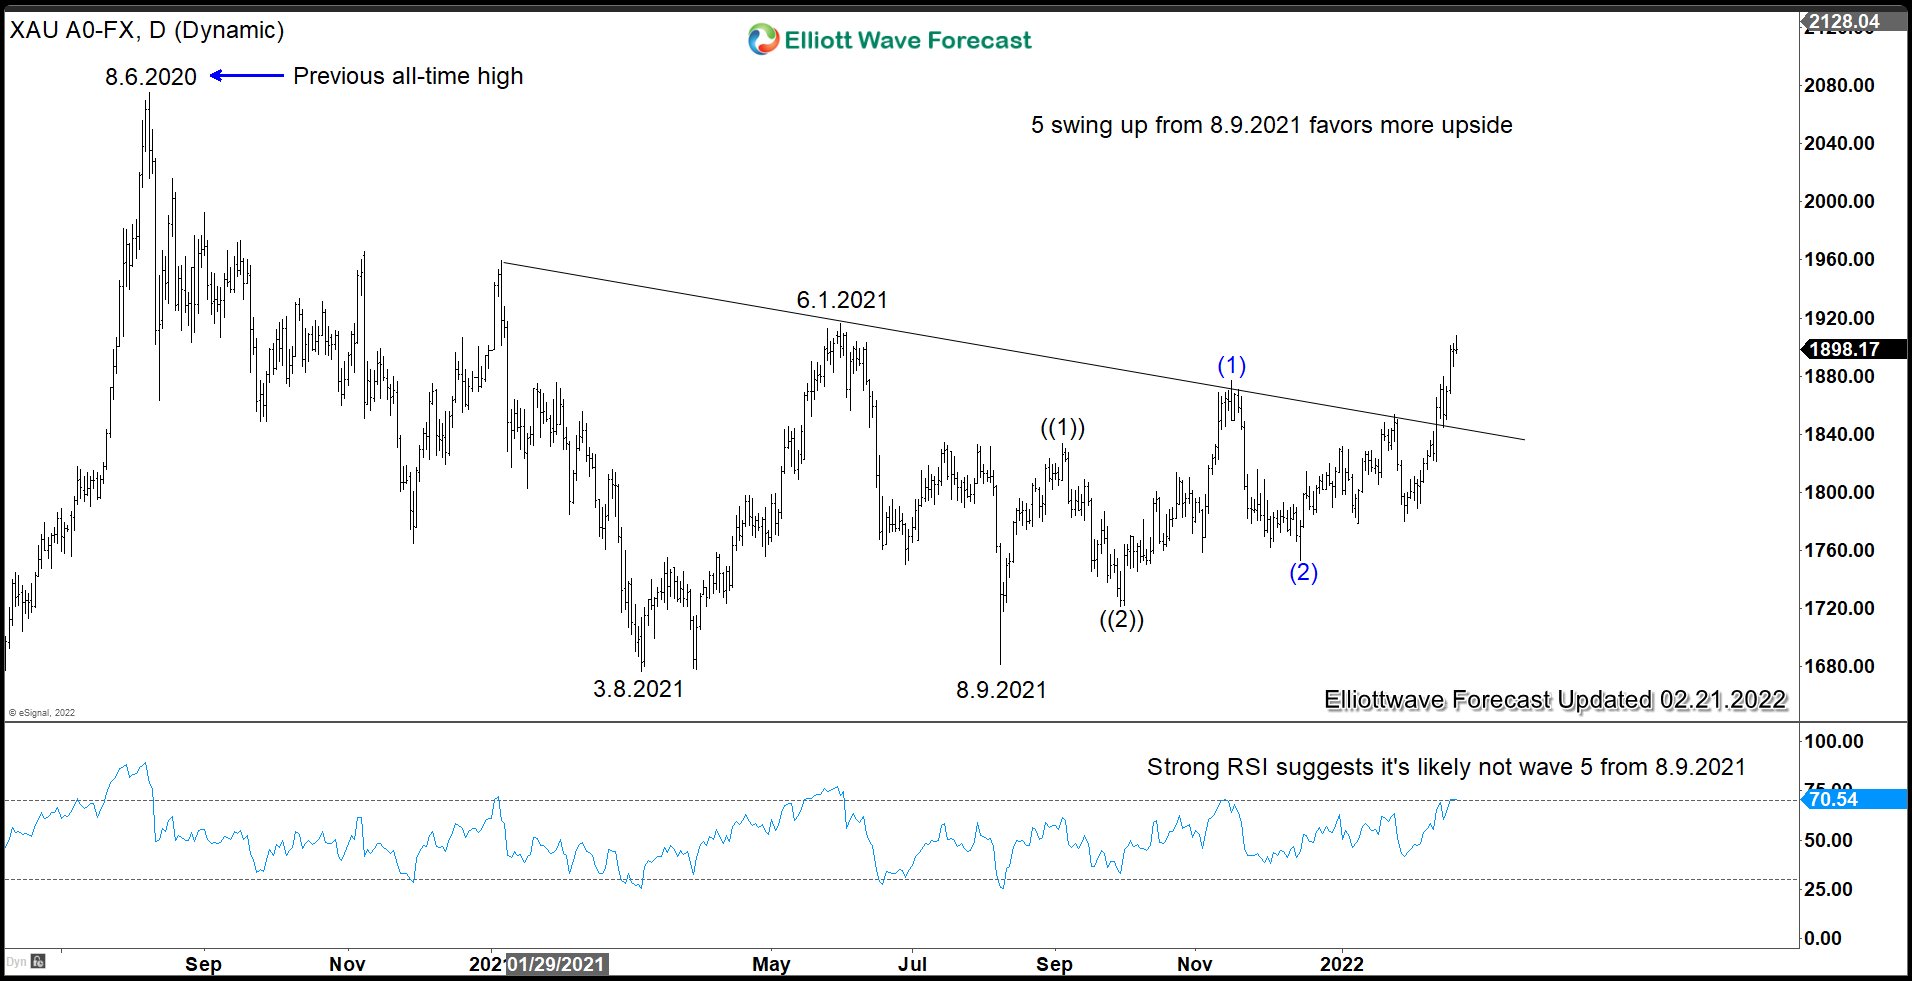
After 1 year of muted and sideways movement, Gold looks to show some strength recently. Gold futures settled at $1900 an ounce for the first time since June last year. A threat of potential war between Russia and Ukraine might contribute to the recent strength. However, the main driver for the precious metal remains to be persistently high inflation. The Fed is widely expected to start raising the benchmark rate in the next March meeting to contain inflation. This should be the first among several benchmark rate raise this year.
Daily Chart of Gold (XAUUSD)
Daily Chart of Gold (XAUUSD) above shows a clear 5 swing from 8.9.2021 low. A 5 swing is an incomplete sequence, suggesting further upside to come. A break above 6.1.2021 high (1916.5) should further creates a higher high sequence from 3.8.2021 low favoring further upside. Momentum, as measured by RSI, also shows strength suggesting the previous metal is not likely within wave ((5)) from 8.9.2021 low. Wave ((5)) usually shows the lack of momentum (momentum divergence). We can conclude therefore that the move higher from 8.9.2021 low can be nesting ((1))-((2))-(1)-(2). This suggests pullback should continue to find support in 3, 7, or 11 swing against wave (2) low at 1753.10.
Gold in Yen (XAUJPY) Breaking to New All-Time High
Gold in Yen terms (XAUJPY) broke to new all-time high last week. This is the first currency from G7 which has done so and most likely lead the other fiat currencies. As we can see from the monthly chart above, breaks to new high suggests the correction is over and it is ready to start a new bullish cycle higher. The potential target higher is the 100% extension area which comes at 286226 - 323489.
Starbucks Corporation (SBUX) is an American multinational chain of coffeehouses and roastery reserves. It is the world's largest coffeehouse chain. As of November 2021, the company had 33,833 stores in 80 countries, 15,444 of which were located in the United States. Out of Starbucks' U.S.-based stores, over 8,900 are company-operated, while the remainder are licensed.
Starbucks (SBUX) Daily Chart
Starbucks (SBUX) completed an impulse structure from March 2020 low. It topped at $126.32 on July 2021. At that price, the stock started a correction of all cycle from March 2020. We can see from the peak a double correction, that means a ((W)), ((X)) and ((Y)) structure where each one is formed by 3 waves (A), (B), and (C) (If you want to learn more about Elliott Wave Theory, please follow these links: Elliott Wave Education and Elliott Wave Theory). The first 3 waves of ((W)) ended at 104.02, then we can see a pullback in 3 waves ending ((X)) at 117.80.
From here, we should see 3 swings more down to complete a double correction. Wave (A) made an impulse ending at 93.79, then a shallow correction as wave (B) completed at 99.15. We are already in wave (C) and we are calling more downside looking for an impulse structure. This drop should end below $90.12 and it should not extend below $79.03. Keep an eye when 5 waves structure finish, because after that, SBUX should continue rally.
Moderna, Inc. is an US American pharmaceutical and biotechnology company. Founded in 2010 and headquartered in Cambridge, Massachusetts, USA, it is a part of NASDAQ100 and S&P500 indices. Investors can trade it under the ticker $MRNA at NASDAQ. The company's only commercial product is the COVID-19 vaccin. Moreover, it has a portfolio of vaccine candidates for such disease areas like influenza, cancer, HIV, Eppstein-Barr virus, Nipah virus, chikungunya, respiratory syncytial virus and others. Will this broad engagement promote the stock price into a new rally? In the initial article from April 2020, we have called for more upside in Moderna. We were right. Here we present an update.
Moderna Weekly Elliott Wave Analysis 02.21.2022
The weekly chart below shows the Moderna stock $MRNA traded at Nasdaq. From the all-time lows, the stock price is showing Elliott wave motive wave pattern. The main cycle up in blue wave (I) of super cycle degree has ended by printing the all-time high in August 2021 at 497.49. Clearly, one can see an impulse with an extended wave III. After 5 waves higher in wave (I), the correction lower in 3 swings of wave (II) lower is still in progress. While price is holding below 377.19, expect wave c of (II) to reach lower.
Investors and traders can be looking to buy wave (II) from 89.20-21.23 area. The target for wave (III) will be 497.49 and even higher.
Moderna Daily Elliott Wave Analysis 02.21.2022
The daily chart below shows in more detail the final stages of the wave (I) and the decline in wave (II). From the all-time highs in August 2021, wave (II) unfolds currently as an Elliott wave zigzag pattern being 5-3-5 structure. Hereby, waves a and b have already finished, wave c is in progress and should reach towards 100% extension of the wave a. Also, the structure of the wave c looks incomplete.
Therefore, the blue box area 89.20-21.23 is a great opportunity to enter the market at a good price. Buyers should be waiting there. From the extremes, the Moderna stock should accelerate in the blue wave (III) towards 497.49 and higher.
Cryptocurrencies have become very popular worldwide. Many young investors want to chase every move the instrument does daily. The reality is that many traders tend to trade without looking at the higher time frames. Traders also don't relate instruments that trade within the same group. $BTC (Bitcoin) might have ended the all-time cycle when it peaked at 11.01.2021.
Currently, $BTCUSD is trading at $38275. However, there is a possibility that it can trade much lower into the $23267-$17903 area or even lower. The price to buy the leading cryptocurrency is still high, so we are looking at BITO as a much better instrument and cheaper to invest in crypto. BITO (Proshares Bitcoin Strategy ETF ) was the first U.S. bitcoin-linked ETF offering investors an opportunity to gain exposure to bitcoin returns in a convenient, liquid, and transparent way.
The Fund seeks to provide capital appreciation primarily through managed exposure to bitcoin futures contracts. By definition, an ETF is a collection of hundreds or thousands of stocks or bonds, managed by experts, in a single fund that trades on major stock exchanges, like the New York Stock Exchange and NASDAQ. Many investors buy Cryptocurrencies without understanding the risk that comes with it. BITO provides investors with a cheaper alternative than investing directly. In addition, it is arguably a safer alternative for gaining exposure as it does not involve using a wallet required for Bitcoin.
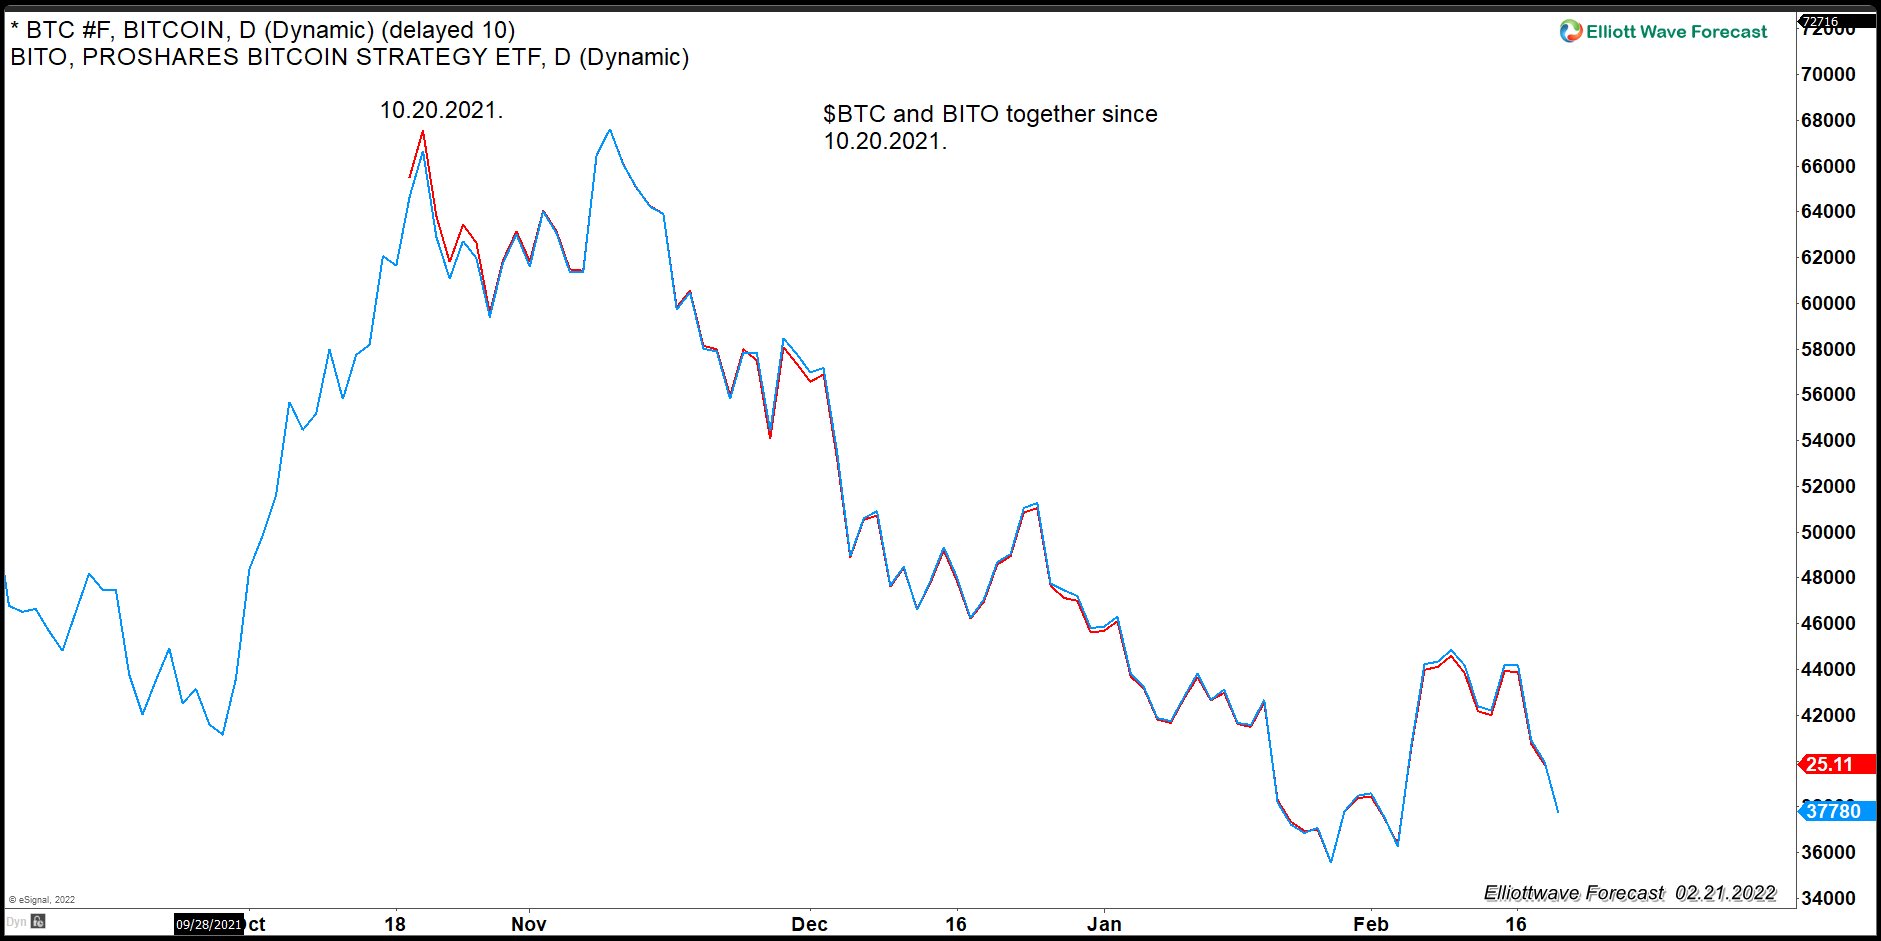
Investors should be aware that the BITO ETF does not hold Bitcoin directly, but the price action is almost identical. As we mentioned above, many new traders do not understand or use multi-market correlation and mostly rely on the short-term charts of a single instrument. We will present three steps of Market correlation, providing the right timing to invest in BITO. First, the relationship between $BTC and BITO as the following chart shows
Correlation between Bitcoin and BITO
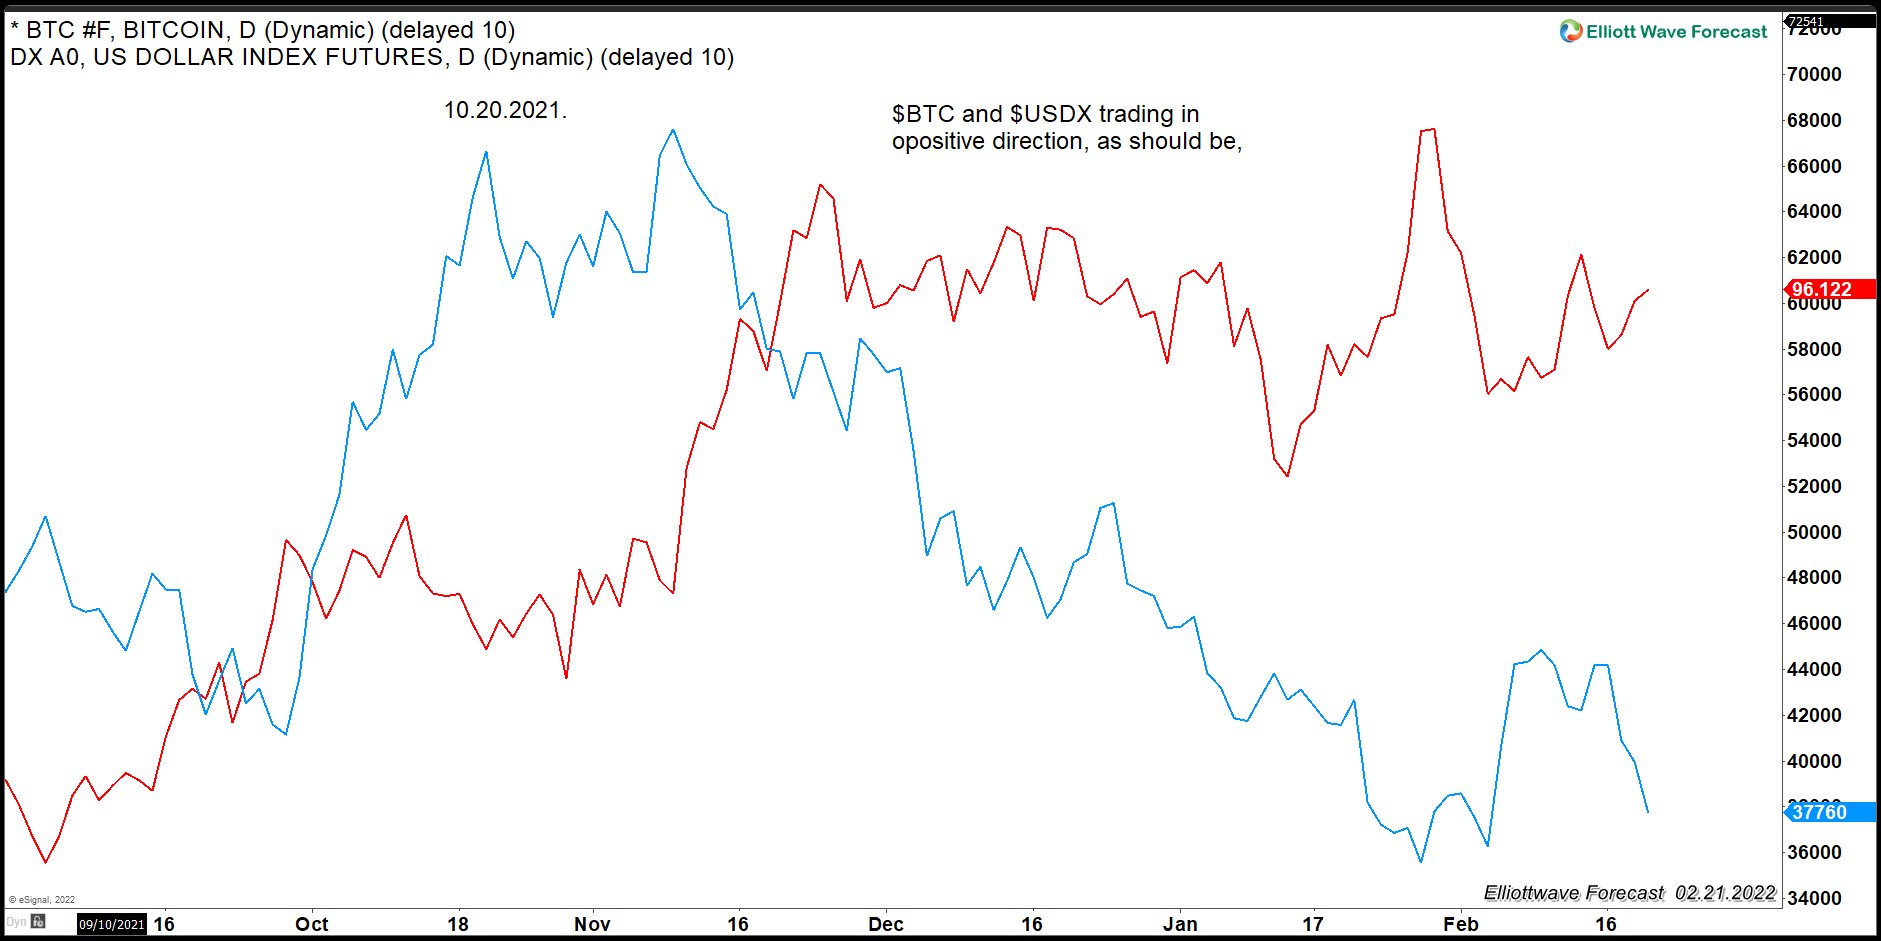
The chart above shows the price action since BITO entered the marketplace back on October 18th, 2021. The price action is almost identical, proving that trading BITO is the same as trading $BTC. Secondly, we need to understand that Bitcoin is trading against the USD, which makes the USD path key to determine the path of Bitcoin. The following chart is a correlation chart between Bitcoin and US Dollar Index:
Correlation chart between Bitcoin and USD Index
The chart above shows $BTCUSD and $USDX moves together in the opposite direction. This means a higher $USDX makes $BTC going lower. Thirdly, to understand what the Dollar Index should be doing, we will use $GBPAUD as a pair showing an incomplete sequence in favor of the $USDX as the chart below shows:
Bullish Sequence in GBPAUD Favors More Upside in USDX
The chart above shows the relationship between the two instruments. It shows the USD should trade higher until $GBPAUD reaches the extreme Blue Box area from the low at 01.06.2021. We can also see the 10.29.2021 low, which is the same as the peak at BITO and $BTC. In conclusion, we know $GBPAUD should trade higher and take the USD with it higher. We also see that a higher USD will make $BTCUSD to trade lower into the $23267-$17903 or even lower. Consequently, BITO will trade lower following $BTCUSD. A multi-market analysis allows us to get a better price and timing to invest in BITO and therefore buy $BTCUSD at a lower and safer cost.
The last time I took a look at Datadog was a few months ago. At the time, my favoured view was looking for a pullback to correct the low from May 2021. You can view this article here.
Lets take a look at the expectation in December 2021.
DataDog Elliottwave View December 2021:
As mentioned above. I was looking for the pullback to go deeper in ((2)) before resuming higher. Lets take a look below at how this stock performed.
DataDog Elliottwave View February 2022:
It is hard to get a better level for a dip than what the market provided for DDOG. Once the connector was complete in (B) of ((2)), the market declined impulsively right into the blue box area. In addition to entering the blue box, prices retraced to the 61.8 retrace of the rally from Red II to ((1)) peak. This is a common area where a wave 2 retrace depth takes place.
The reaction from the blue box has resulted in a sharp reaction that is favoured to have peaked in blue (1). Price action is suggesting a pullback against the Jan 24 low is now taking place. In the absence of a connector for (2), we can look to the 61.8 retrace of the ((2)) to (1) rally, which comes in at 144.33. This is the area where a bounce can take place for the next leg higher as long as the ((2)) low @ 119.19 remains intact.
RTSI is a Russian stock market index representing 50 most important companies on the Moscow Stock Exchange. From the introduction in 1995 until May 2008, RTS index has performed very well. Then, the index remains sideways while American indices are rallying. One of the reasons for this lagging behavior could be the highly depressed commodity prices. As a matter of fact, Russian companies are strongly represented in the oil, gas, refining, metals and mining industries. Hence, it is obvious that in a period of strong US dollar and low commodity prices, those companies could not rise significantly. Currently, commodity prices seem to turn higher which can give a fuel for RTSI for a long expected rally.
RTSI Weekly Elliott Wave Analysis 02.21.2022
The weekly chart below shows the RTS Index on the Moscow Stock Exchange. First, the stock price has developed a cycle higher in wave ((I)). The impulse has printed the top on December 2007 at 2345.45. Then, the correction lower in wave ((II)) has unfolded as an expanded flat. Hereby, wave (b) of ((II)) has set the all-time high in May 2008 at 2498.10. From there, wave (c) has reset lower and printed an important bottom on January 2009 at 492.59.
While RTSI is trading above 492.59, wave ((III)) is in progress. One can see, hereby, 2 nests which represent series of waves 1 and 2. Indeed, first nest being waves (I)-(II) has ended on December 2014 at 578.21. The 2nd nest containing waves I and II is still in progress. Once accomplished, expect acceleration higher in wave III of (III) of ((III)).
The target for black wave ((III)) is 2851.30-4310.89 area and even beyond.
RTSI Weekly Elliott Wave Analysis 02.21.2022
The daily chart below shows in more detail the leading diagonal in wave in wave I and decline lower in wave II. The consolidation in wave II is an Elliott Wave zigzag structure. While below 1640.39, wave ((C)) should reach in 5 waves lower. Investors and traders should be looking to buy RTSI from 1220.11-960.37 area. There, a rally in wave III of (III) should take place or a bounce in 3 waves as minimum. The target for blue wave (III) is 2224.10-3241.58 area.
If commodities are going to rally, then RTSI might outperform US american indices providing a good investment possibility for long and medium term. As an outlook, TSX may rally to the monthly equal legs towards 2851.30-4310.89 area.
One of the first principles we learn in FX are market sentiments. The first thing we learn in market sentiments is about how the yen is known for being a safe-haven currency.
During global uncertainties, investors tend to shelter their investments. This is within risk off assets as opposed to risk on assets and yen is one of those risk off assets.
A risk off asset is a type of investment that is expected to retain value or even strengthen during periods of intense market turbulence. Uncertainty within the economic systemic are practically inevitable, but safe-haven assets are inverse correlated to investors which is what provides shelter to investors.
Yen
Fundamentally speaking there are many reasons why yen it is considered as a safe-haven, one of them for starters being that Japan has 0% interest rates, therefore, Japan is considered as a creditor country. For example, is that it is a common currency to borrow for purpose of carry trading.
Alternatively, this is also human behaviour, we are just stuck within a herd-based habit that yen is a safe-haven, therefore, investors just tend to park their investments within yen without a reason except the fact everyone else does it.
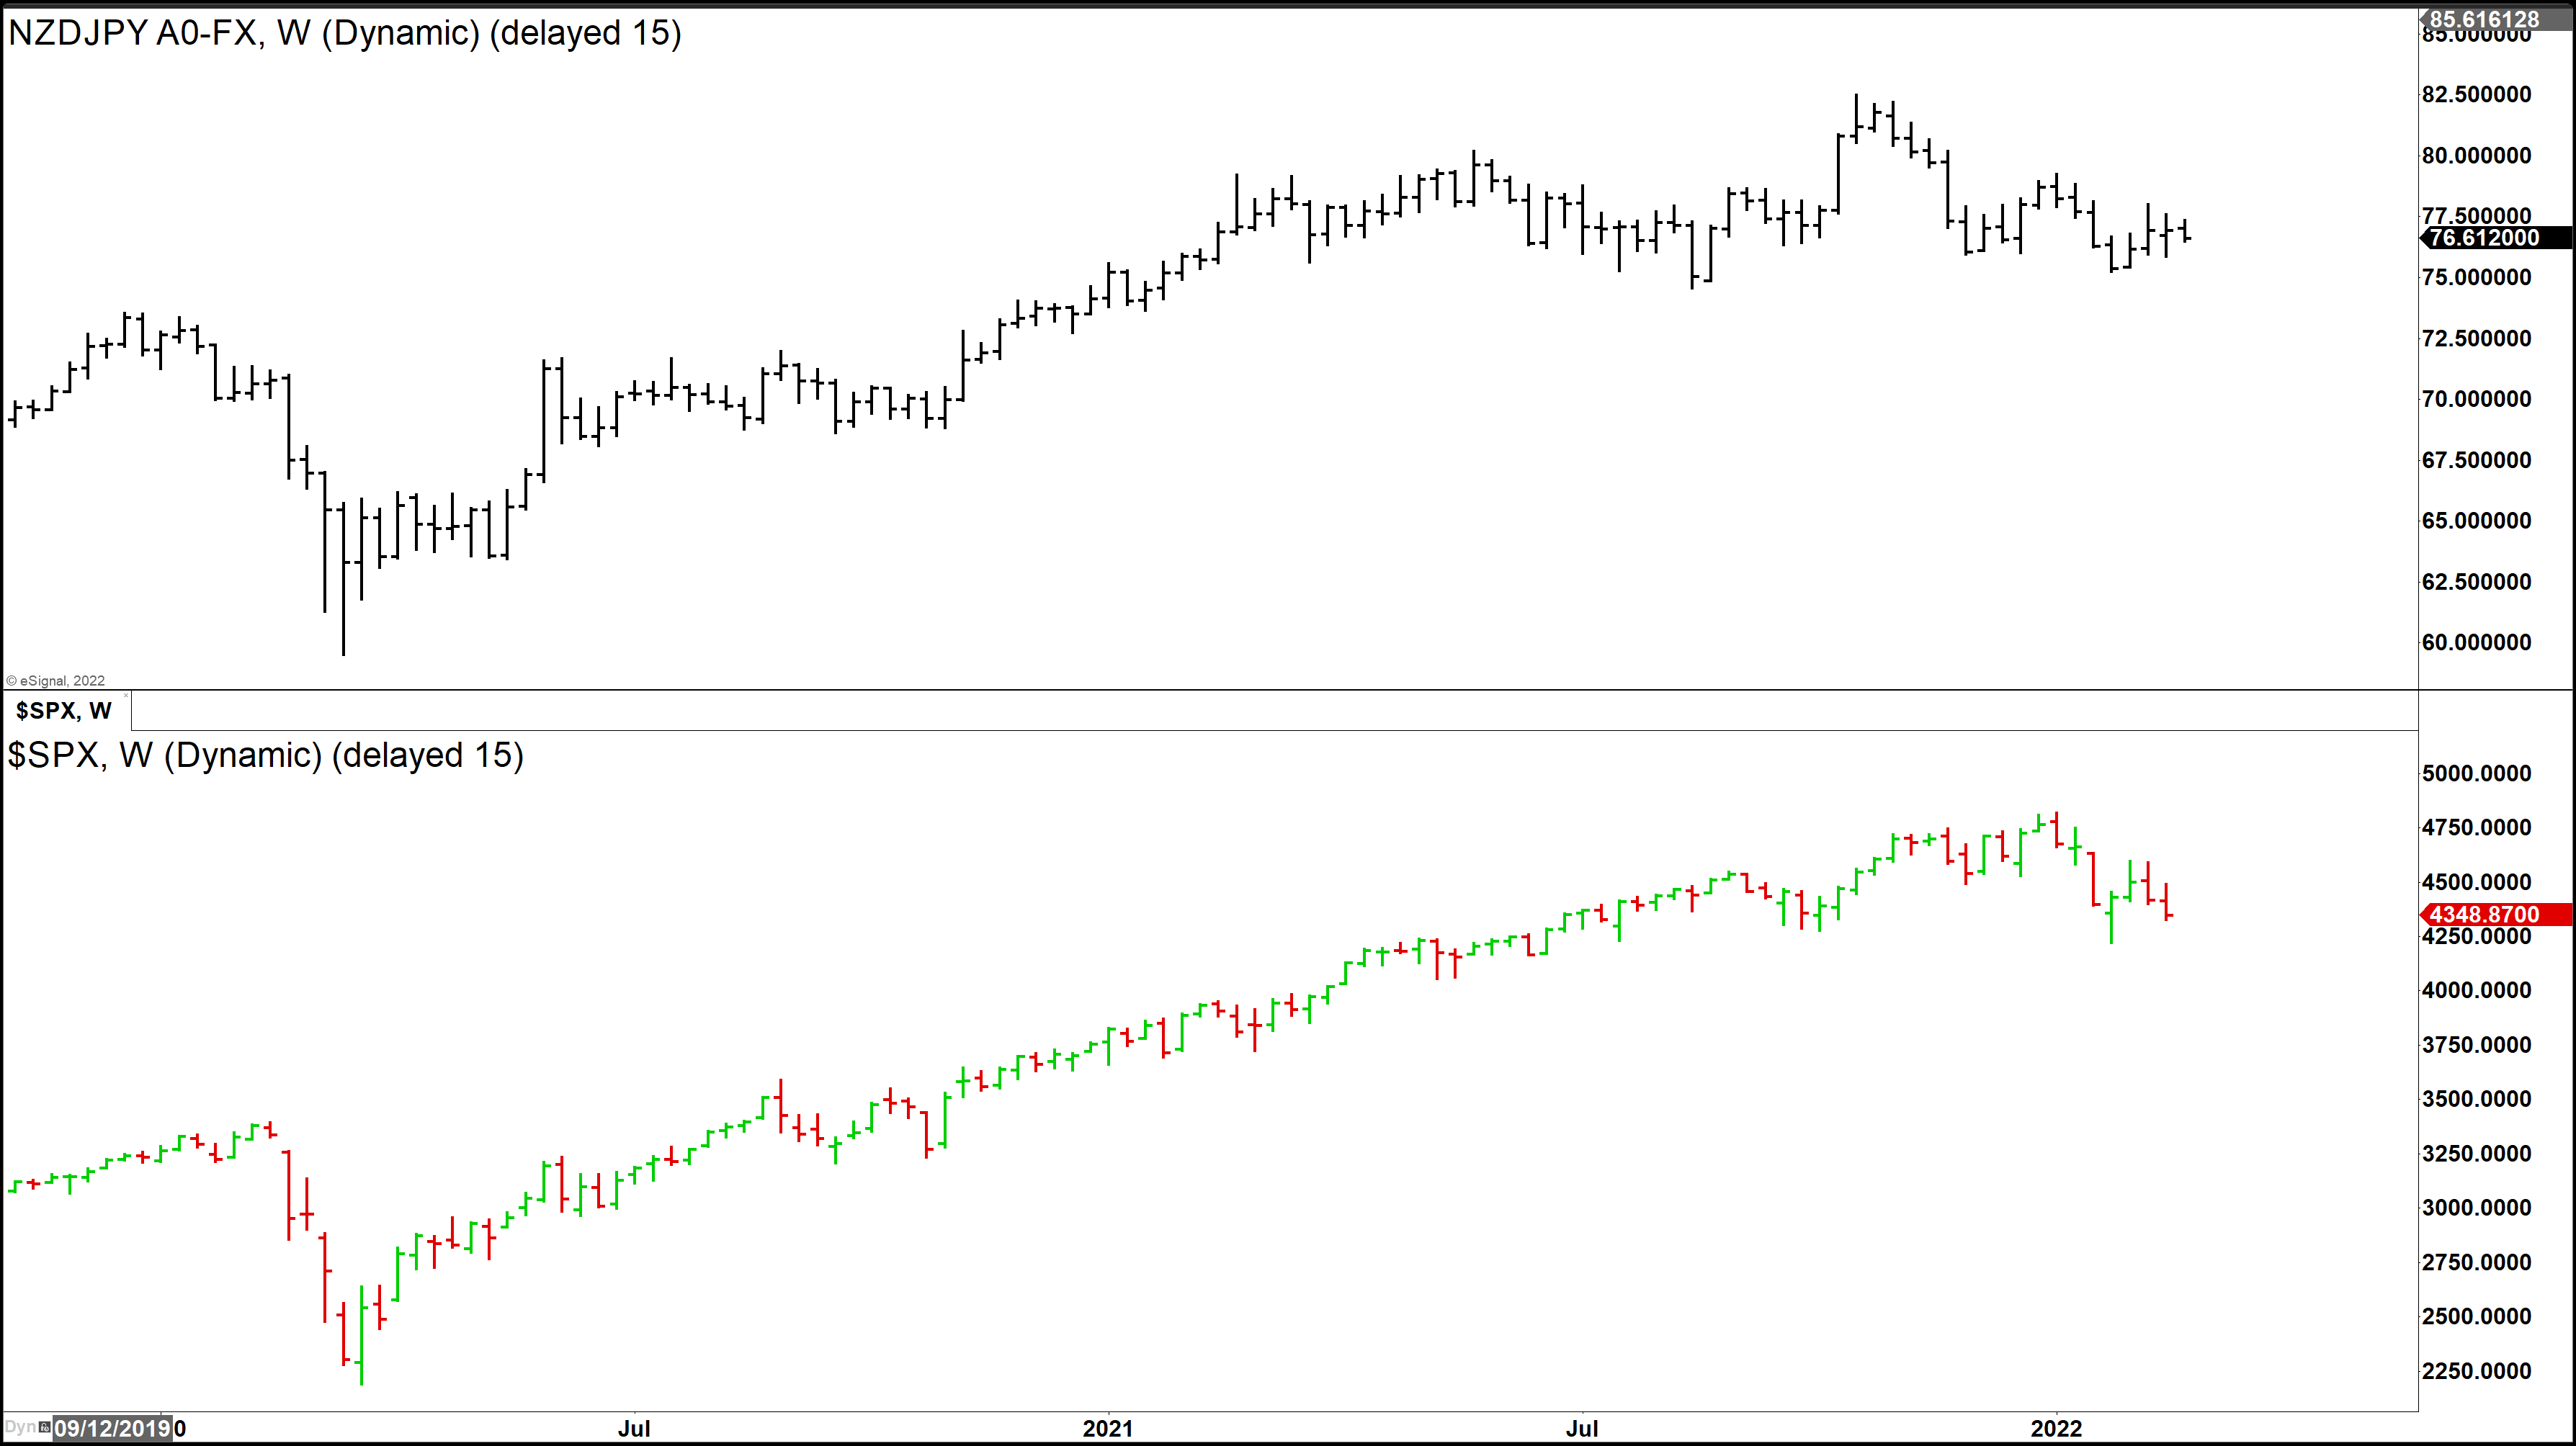
Proof is in the pudding
As per shown below, these two tend to negatively correlate, when the S&P500 appreciates, yen depreciates simultaneously against other pairs, especially commodity risk on pairs. The below is a prime example, you can see how these both assets climbed up to October 2022. That’s when the stock market started to correct. We can see yen then built its strength against the New Zealand dollar.
What clue does it provide us with indices now?
Yen negatively correlates against the stock market. Elliott Wave Forecast are concentrating on the next potential move within the stock market, based on yen’s near-term future.
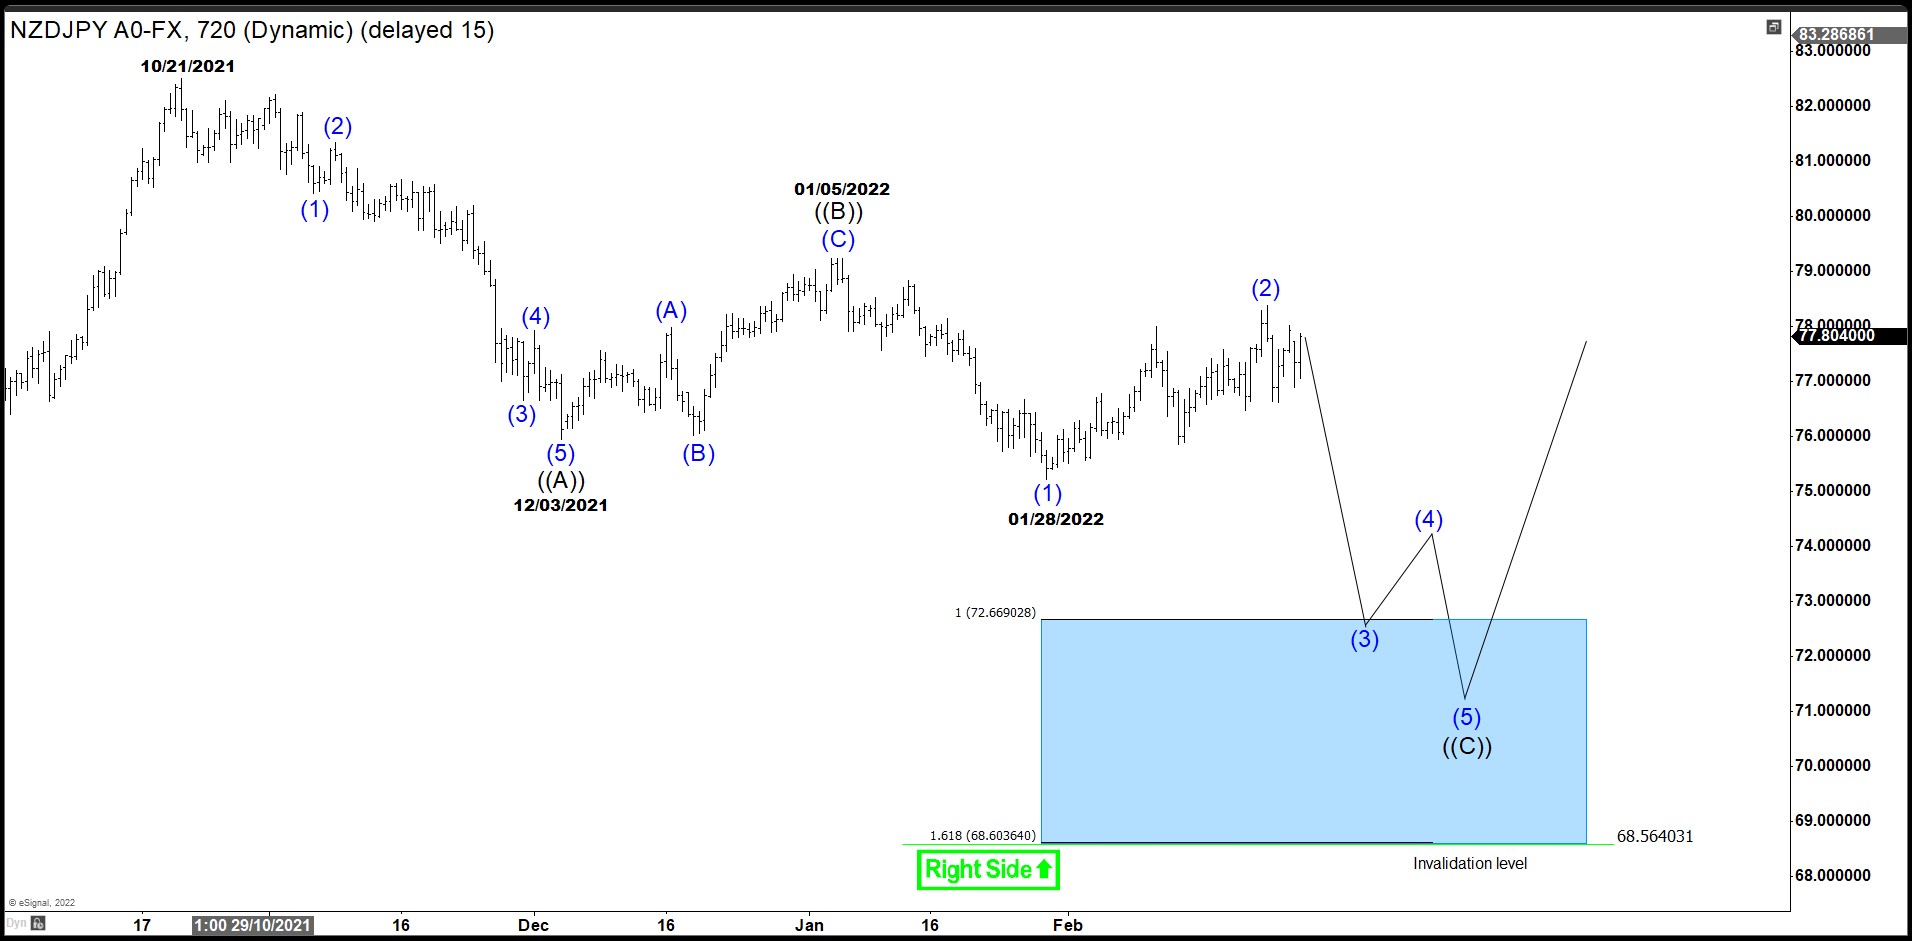
Our first chart that caught our attention was NZDJPY. This is the first pair, against a risk on asset, formed a new low, as per shown below. We are currently unfolding a 5-wave down and aiming to reach ((C)) around 72.66, based on equality of wave ((A)).
This wave count indicates that we should be expecting Japanese yen to strengthen. This indicates that indices are due to correlate negatively against the yen. Therefore, we are expecting the opposite move. However, as yen is a secondary currency against the New Zealand dollar, we will witness them both have a short bias together.
We are currently within a corrective cycle. Expecting equality based on wave S&P500. For example, is currently playing inside a corrective cycle of the previous bull run.
If NZDJPY unfolds wave ((C), we should expect S&P500 breaking a new low prior to appreciation in the near-term future. This move would complete the wave (IV) corrective cycle. Break below 4200 to confirm this and as long as we hold beneath this price, this would put the theory into existence.
This sums up to being a bit more patient with the stock market. Yen is giving us clues that it is on its way to completing a corrective cycle. Therefore, means yen will appreciate in the near-term future.
The Goldman Sachs Group, Inc. (GS) is an American multinational investment bank and financial services company headquartered in New York City. It offers services in investment management, securities, asset management, prime brokerage, and securities underwriting.
GS OCTOBER 2021 DAILY CHART
Last October, we were looking to complete an impulse from March 2020 low. The first wave of impulse that we called wave (1) ended at 225.24 dollars. Pullback as wave (2) ended at 185.52. Then the stock rally creating 5 swings up in lesser degree to form wave (3) completed at 393.26. Wave (4) correction finished at 348.13 and from here last rally ended at 426.16 without reaching our minimum target 444.39. GS drawn an ending diagonal structure to complete wave (5) and the impulse wave ((1)). (If you want to learn more about Elliott Wave Theory, please follow these links: Elliott Wave Education and Elliott Wave Theory).
GS FEBRUARY DAILY CHART
From the peak, GS fell in 3 swings to end wave A at 366.65. Then 3 swings up to complete wave B at 412.66 and an impulse dropped to finish a flat correction. As we have already drawn 3 swings correction, we can perfectly continue with the rally from here. However, given the market conditions we are calling a double correction. Therefore, we are labeling 326.23 low as (W), bounce to 377.40 as wave (X). This Elliott structure needs 3 swings down more, a simple ABC, to complete it. Wave A is done already at 326.95 and currently we are developing wave B and after ending this wave we should see further bearish movement. The target to complete this correction and wave ((2)) we are considering 305.00 – 277.00 area. The view is valid as we stay below 377.40.


 July 2021 Daily Chart")
 November 2021 Daily Chart")
 December 2021 Daily Chart")
 January Daily Chart")
 February 12th Daily Chart")


 Daily Chart")